Download presentation
Presentation is loading. Please wait.

1
CHAPTER 2: BIOLOGY AS A SCIENCE

3
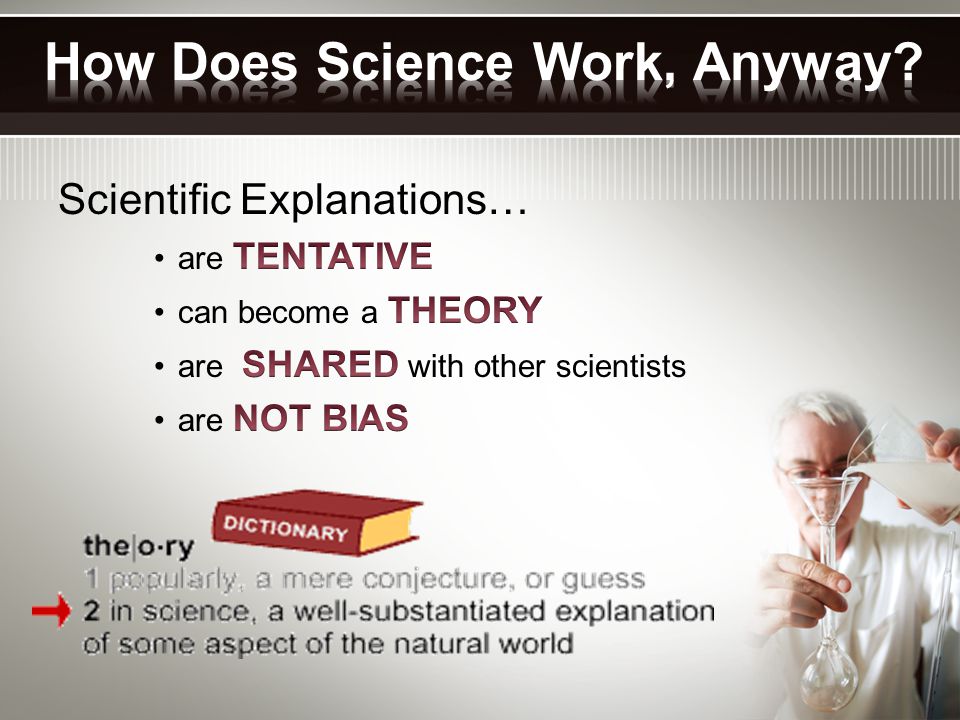
Information you gather with your senses Logical conclusions based on observations

4
The Scientific Method The scientific method is an organized way to solve a problem using prediction and experimentation

6
Steps of the Scientific Method 1.Make observation & State the problem Formulate a question that needs to be answered 3. Propose a hypothesis A hypothesis is an educated guess about what the solution to the problem is. If…then… statement Independent Variable: What the scientist is testing 2. Research the problem Conduct a research plan to find available information

7
Problem

8
Hypothesis

9
Steps of the Scientific Method 4. Conduct an experiment Controlled Experiment: an experiment with a control and an experimental group, with several constants DOES NOT RECEIVE THE INDEPENDENT VARIABLE (WHAT THE SCIENTIST IS TESTING) DOES RECEIVE THE INDEPENDENT VARIABLE QUALITIES KEPT THE SAME BETWEEN BOTH THE CONTROL AND THE EXPERIMENTAL GROUP; REMOVES OTHER EXPLAINATIONS FOR THE RESULTS
 DOES RECEIVE THE INDEPENDENT VARIABLE QUALITIES KEPT THE SAME BETWEEN BOTH THE CONTROL AND THE EXPERIMENTAL GROUP; REMOVES OTHER EXPLAINATIONS FOR THE RESULTS.")
10
Test the Hypothesis experimental control groupgroup Constants: Experimental Group Control Group

11
Steps of the Scientific Method 5. Observations and data. Observations are made with our senses and instruments; the data is measureable Data measured with numbers is quantitative Data measured with words is qualitative Often the data or results of the experiment is called the dependent variable Dependent Variable: the aspect of an experiment that changes (as time passes), the data being collected Graphed in the y-axis
, the data being collected Graphed in the y-axis.")
12
Observations & Data

13
Steps of the Scientific Method As data is collected, it must be organized in a data table, diagram, chart or equation. Data is interpreted by a graph. Graphs organize data tables and make results more clear. Control Group - plant height Experimental Group - plant height Day 10.0 cm Day 20.2 cm0.5 cm Day 30.3 cm0.9 cm Day 40.5 cm1.3 cm Day 50.7 cm1.7 cm

14
Steps of the Scientific Method 6. Analysis & Conclusions The data from the experiment needs to be looked at and analyzed. Conclusion: determines if the stated hypothesis was supported by the results 7. Repeat Experiment & Report Results are only valid after other scientists have repeated the experiment several times and get the same results Research reports must be peer reviewed and can be published in scientific journals

15
Report and Repeat Repeat your experiment to make sure you get the same results. Tell other tomato growers about your results and let them try the experiment to see if they get the same results.

17
1.Have two groups: control and experimental 2.Have ONE independent variable 3.Perform several trials (trial: an experiment’s test) 4.Have a large sample size (subjects in the experiment) 5.Have as many constants as possible 6.Have a detailed Data Table
 4.Have a large sample size (subjects in the experiment) 5.Have as many constants as possible 6.Have a detailed Data Table")
18
RESEARCH HOW THIS SCIENTIST USED THE SCIENTIFIC METHOD: LOUIS PASTEUR’S SPONTANEOUS GENERATION EXPERIMENT What was the QUESTION he was trying to answer? What was his HYPOTHESIS? Describe his EXPERIMENT. Explain his RESULTS. What CONCLUSIONS did he make?

19
http://bcs.whfreeman.com/thelifewire/cont ent/chp03/0302003.htmlhttp://bcs.whfreeman.com/thelifewire/cont ent/chp03/0302003.html

20
2005-2006 How does fertilizer affect the growth rate of plants? –we set up an experiment testing different amounts of fertilizer on different plants & measuring the growth (height) of the plants: dependent variable (Y-axis)? independent variable (X-axis)? The effect of _____________ on _____________
 of the plants: dependent variable (Y-axis). independent variable (X-axis). The effect of _____________ on _____________.")
21
2005-2006 How does exercise affect heart rate of 10th grade student? –we set up an experiment testing different lengths of time of exercise (minutes) on the heart rate of students: dependent variable (Y-axis)? independent variable (X-axis)? The effect of _____________ on _____________
 on the heart rate of students: dependent variable (Y-axis). independent variable (X-axis). The effect of _____________ on _____________.")
22
2005-2006 What’s the favorite drink of students? –we set up an experiment surveying students and asking which is their favorite drink : dependent variable (Y-axis)? independent variable (X-axis)? The effect of _____________ on _____________
. independent variable (X-axis). The effect of _____________ on _____________.")
Similar presentations