Download presentation
Presentation is loading. Please wait.

1
Scientific Method Notes or How Do I Design An Experiment?

2
What is the Scientific Method Scientific method is a problem solving technique. The scientific method is based on 3 main concepts: Observation: using our senses to gather information or use of measurements Experimentation: “doing” science Development of theories or natural laws

4
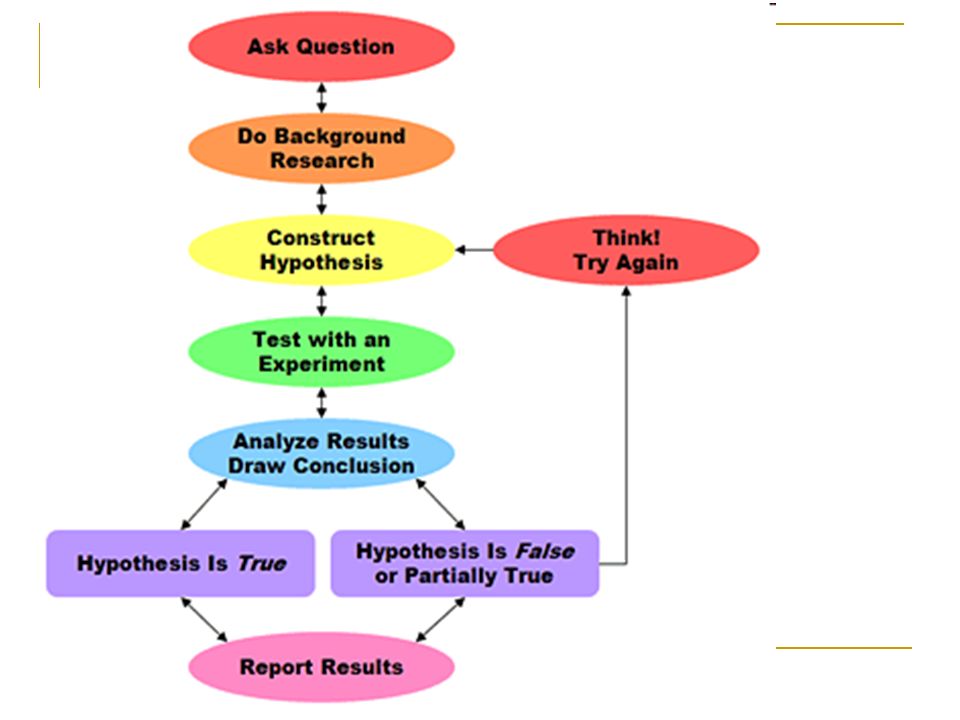
How to “do” the Scientific Method 1. STATE THE PROBLEM State the problem as a question All scientific questions are limited to the natural world— we can physically observe or use instruments and or mathematical equations to gain information 2. Research and form a HYPOTHESIS Formulate the hypothesis: What is the probable answer to our problem? Always write the hypothesis as an if...then... Statement 3. DESIGN AND CONDUCT EXPERIMENTS 4. COLLECT DATA from the experiments

5
5. ANALYZE THE DATA: How can I show the results of my experiment? 6.DRAW CONCLUSIONS What happened in the experiment? Does your conclusion agree with your hypothesis? What did you find out? 7. RETEST or make recommendations Make recommendations: What do I do next? If my hypothesis was correct --- do the experiment again to check results. If the hypothesis was incorrect --- Why?

6
Experimental design An experiment must consist of certain things to be considered valid. In order for an experiment to be valid it must have: An experimental group A control group One Independent variable Dependent variables Constants

7
In every experiment there should be two groups The experimental group- that part of the experiment that has the one factor you are testing The control group- that part of the experiment that does not have the factor you are testing

8
Variables Independent variable: this is the part of the experiment that we purposely change— what we are investigating. There should be only one factor that is being tested. Dependent variable : this variable changes because of what we did in the experiment. It is the results we are looking for in the experiment.

9
Constants In every experiment there must be things that are exactly the same in the experimental group and the control group-these are called constants. Constants should never change. Only one thing should be different between the two groups, everything else is the same

10
Lets do an example Problem: If a plant is exposed to more sunlight, will it grow better? Hypothesis: If a plant is given more sunlight, it will grow better. My experimental group could be ____? My control group could be ____? My independent variable is ____? My dependent variable is ____? My constants would be _____?

11
How would you display this data effectively? Amount of Average height sunlight of plants exposure (min) (cm) 50 14.8 30 11.0 60 14.9 75 15.1 95 15.2 100 16.1 110 16.5 135 17.3 Which set of data points is the independent and which is the dependent variable?
 (cm) Which set of data points is the independent and which is the dependent variable .")
12
What is data? Data is information gathered by observations or experimentation Most often data in science experiments is presented in data tables and graph form There are 3 basic types of graphs: Line Bar Circle or pie graph

13
Graphing Data On a line graph the x axis is horizontal and represents the independent variable The y axis is vertical and represents the dependent variable.

14
Conclusions There are 4 characteristics of a well written conclusion: 1.Restate the problem and hypothesis 2.Briefly state what your experiment was 3.Include some of the data 4.If your hypothesis was correct, give the evidence from your data that supports it. If your hypothesis was incorrect—explain what went wrong or what you would do differently, or how you would change about your hypothesis

Similar presentations


 Deals only with the natural world 2.) To collect and.>")


