Download presentation
Presentation is loading. Please wait.

1
Complete Blood Count (CBC)
Islamic University – Gaza (IUG)
")
2
Complete Blood Count (CBC)
Panel of tests that examine different components of the blood.

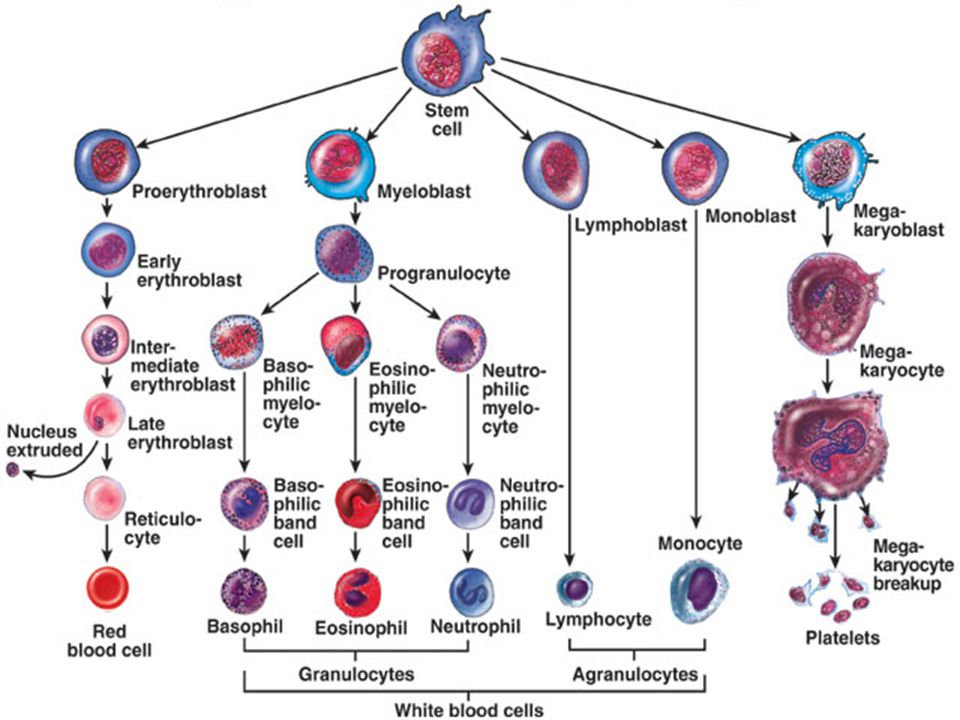
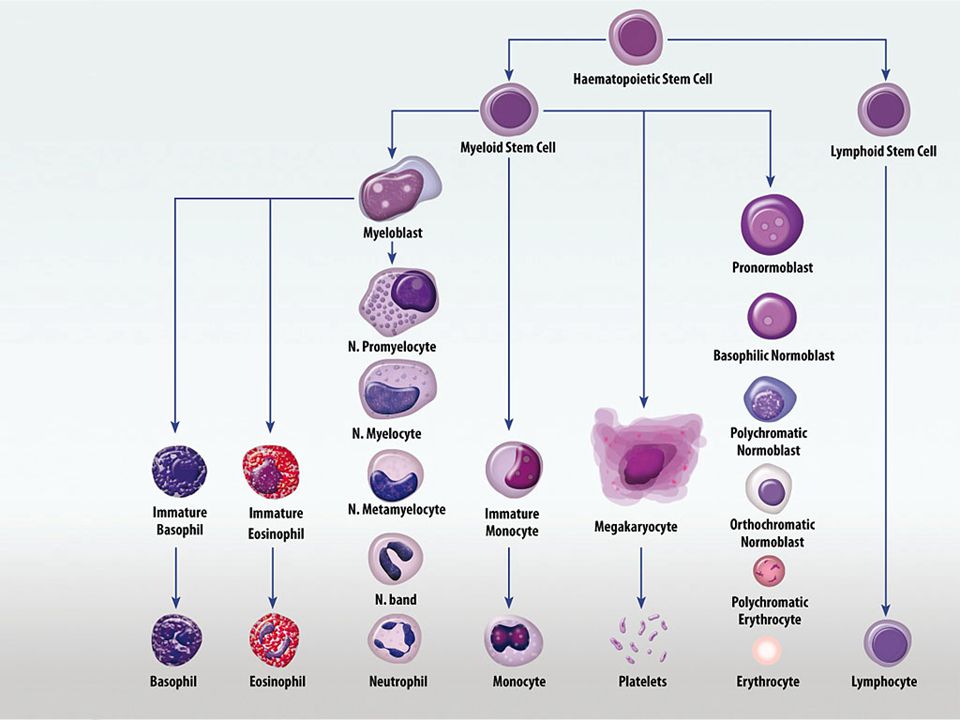
6
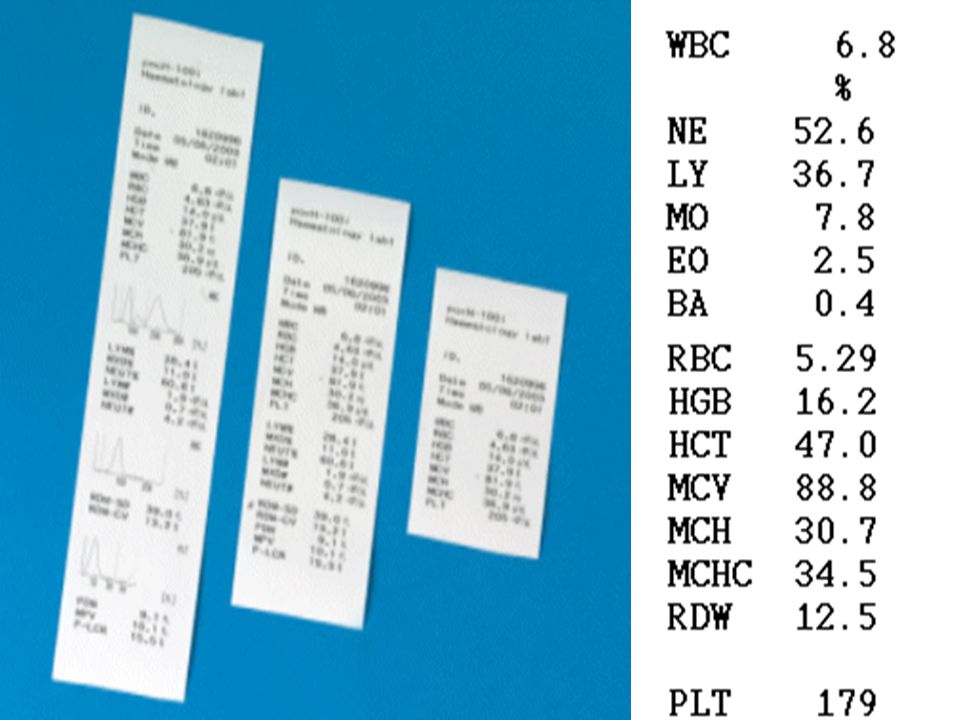
Complete Blood Count (CBC)
CBC values RBC count Hemoglobin Hematocrit RBC indices WBC count and differential Platelet count

7
WBC - White Blood Count - actual number of white blood cells per volume of blood.
WBC differential - types of WBC present.

8
RBC - Red Blood Cells – actual number of red blood cells per volume of blood
HGB - Hemoglobin - amount of the oxygen carrying protein in the blood (gm/dL) PLT - Platelets - actual number of platelets per volume of blood
 PLT - Platelets - actual number of platelets per volume of blood.")
9
MCV - Mean Corpuscular Volume, a measurement of the average size of RBCs (fl)
MCH - Mean Corpuscular Hemoglobin - the mean cell hemoglobin (pg/cell) picogram per cell MCHC - Mean Corpuscular Hemoglobin Concentration - the mean concentration of hemoglobin per volume of red cells (gm/dl) RDW - Red Cell Distribution Width - a variation in the size of RBCs
 picogram per cell. MCHC - Mean Corpuscular Hemoglobin Concentration - the mean concentration of hemoglobin per volume of red cells (gm/dl) RDW - Red Cell Distribution Width - a variation in the size of RBCs.")
10
CBC Normal values RBC count (varies with altitude): Male: 4.7 to 6.1 million cells/micro L Female: 4.2 to 5.4 million cells/micro L WBC count: 4000 to cells/micro L Hematocrit (varies with altitude): Male: 40.7 to 50.3% Female: 37-47% Hemoglobin (varies with altitude): Male: 13 to 18 gm/dL Female: 12 to 16 gm/dL MCV: 80 to 96 femtoliter MCH: 27 to 31 pg/cell MCHC: 32 to 36 gm/dL
: Male: 40.7 to 50.3% Female: 37-47% Hemoglobin (varies with altitude): Male: 13 to 18 gm/dL. Female: 12 to 16 gm/dL. MCV: 80 to 96 femtoliter. MCH: 27 to 31 pg/cell. MCHC: 32 to 36 gm/dL.")
11
It is common for normal to vary from lab to lab.

12
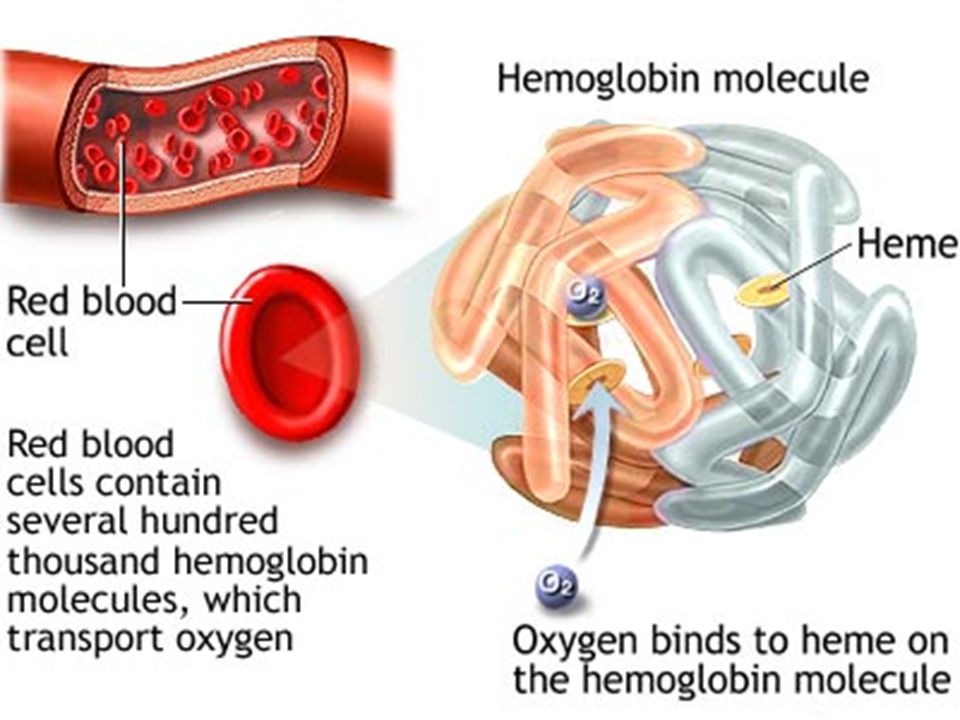
Hemoglobin (Hb or HGB) The iron-containing oxygen-transport metalloprotein in the red blood cells . The main component of RBCs Males g/dl Females g/dl Newborns g/dl

13
Hemoglobin, the main component of the red blood cell, functions in the transportation of oxygen and CO2. Hemoglobin consists of 1 molecule of globin and 4 molecules of heme (each containing 1 molecule of iron in the ferrous state). Globin consists of 2 pairs of polypeptide chains. In the hemoglobin molecule, each polypeptide chain is associated with 1 heme group; each heme group can combine with 1 molecule of oxygen or CO2. Hemoglobin carries oxygen from places of high oxygen pressure (lungs) to places of low oxygen pressure (tissues), where it readily releases the oxygen. Hemoglobin also returns CO2 from the tissues to the lungs.
 to places of low oxygen pressure (tissues), where it readily releases the oxygen. Hemoglobin also returns CO2 from the tissues to the lungs.")
14
Structure of Hb

15
Normal blood contains about 15-16 grams hemoglobin per 100 ml (dL).
Each gram of hemoglobin can carry about 1.35 ml of gaseous oxygen. Fully saturated arterial blood will therefore contain about 20 ml of oxygen per 100 cc. The relative amount of oxygen in the blood compared to the carrying capacity of the hemoglobin is called the oxygen saturation, and is expressed as a percentage.

17
RBC Indices RBC indices include: Mean Corpuscular Volume (MCV)
Mean Corpuscular Hemoglobin (MCH) Mean Corpuscular Hemoglobin Concentration (MCHC) RBC Distribution Width (RDW)
 Mean Corpuscular Hemoglobin Concentration (MCHC) RBC Distribution Width (RDW)")
18
The secondary indices are derived from the three possible combinations of the primary indices thus:
Haemoglobin MCHC=(Hb/PVC) MCH =(Hb/RCC) Hematocrit (PCV) Red cell count (RCC) MCV=(PCV/RCC)
 MCH =(Hb/RCC) Hematocrit (PCV) Red cell count (RCC) MCV=(PCV/RCC)")
19
MCV Mean corpuscular volume MCV is average size of RBC MCV = Hct x 10
RBC (millions) If fL, normal range, RBCs considered normocytic If < 80 fL are microcytic If > 96 fL are macrocytic Not reliable when have marked anisocytosis
 If fL, normal range, RBCs considered normocytic. If < 80 fL are microcytic. If > 96 fL are macrocytic. Not reliable when have marked anisocytosis.")
20
It should be pointed out that, because the red cell count is involved, this determination may be subject to wide variations due to technical error. In general, if an accurate MCV determination is to be done, a triplicate red cell count should be done and the average taken. If this is not done, the results may be misleading as compared to the visual inspection of the red cells on the stained smear and a false impression may be passed on to the clinician.

21
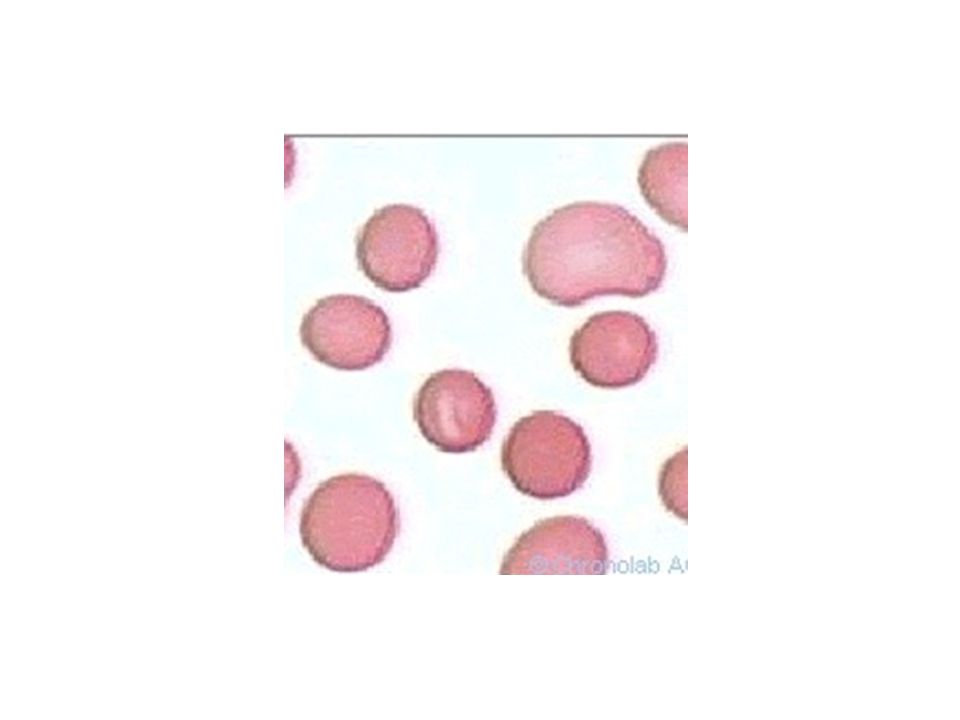
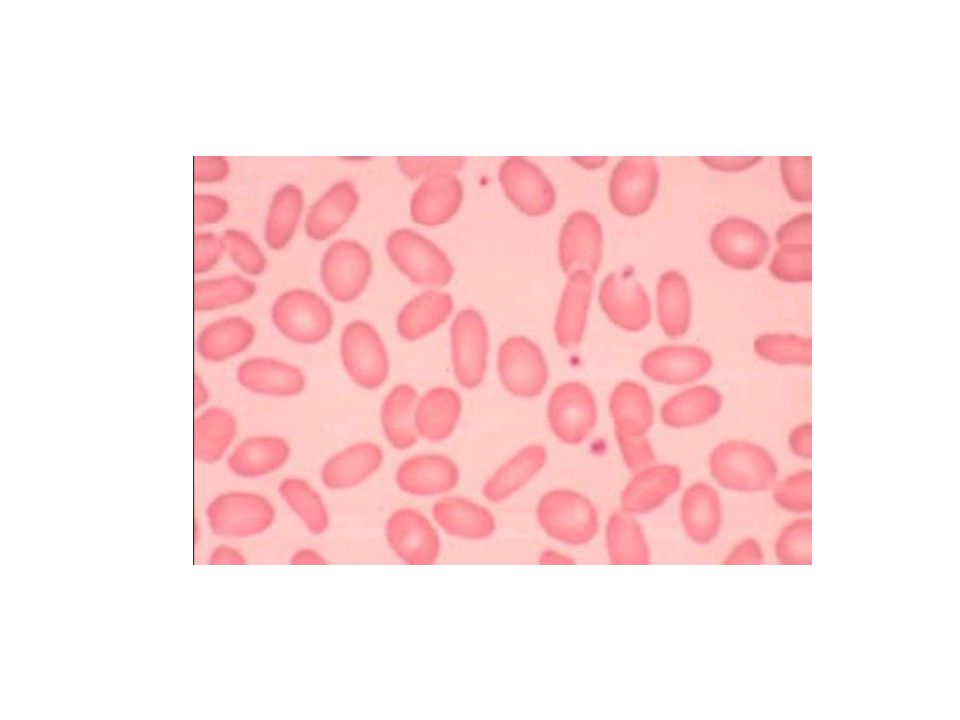
Size variation Red blood cells can vary in size .
smaller than normal: microcytes larger than normal: macrocytes. When red cells of normal size, microcytes and macrocytes are present in the same field, the term anisocytosis is used.

22
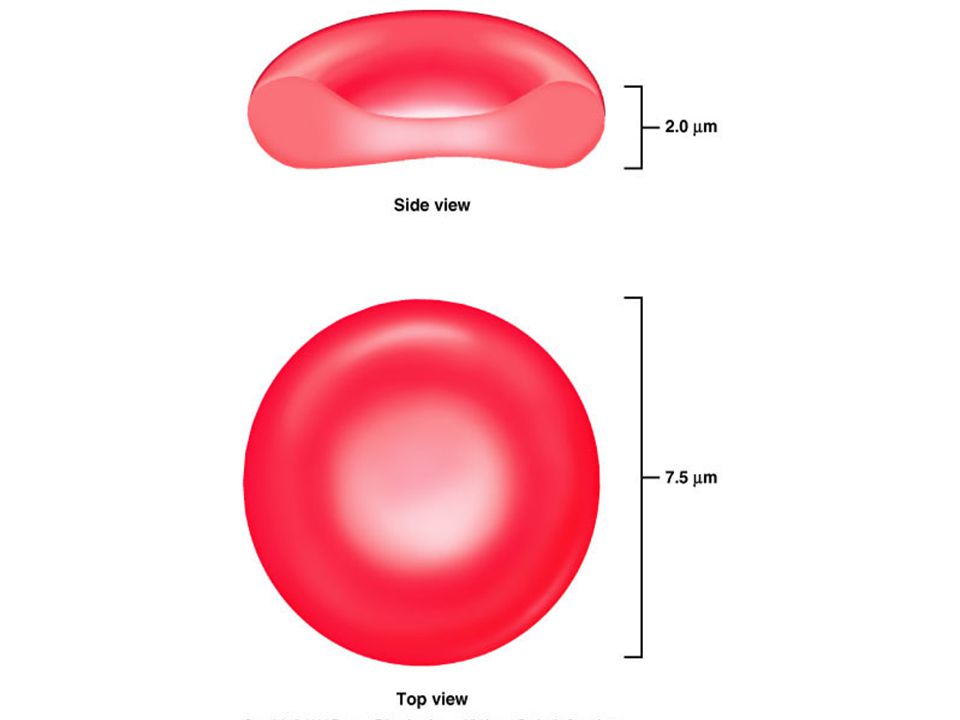
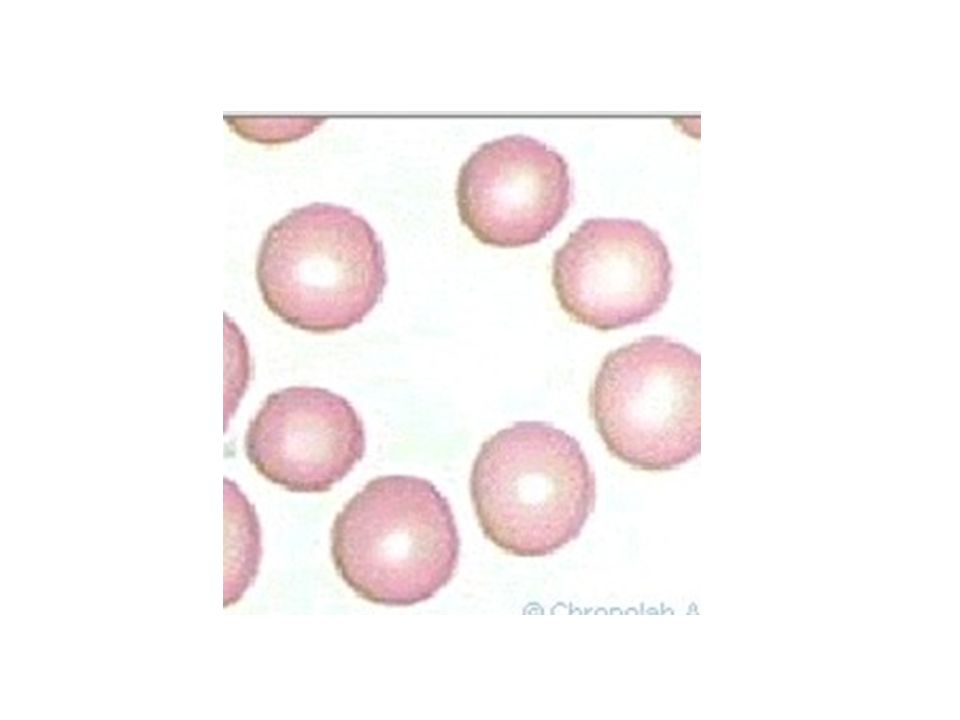
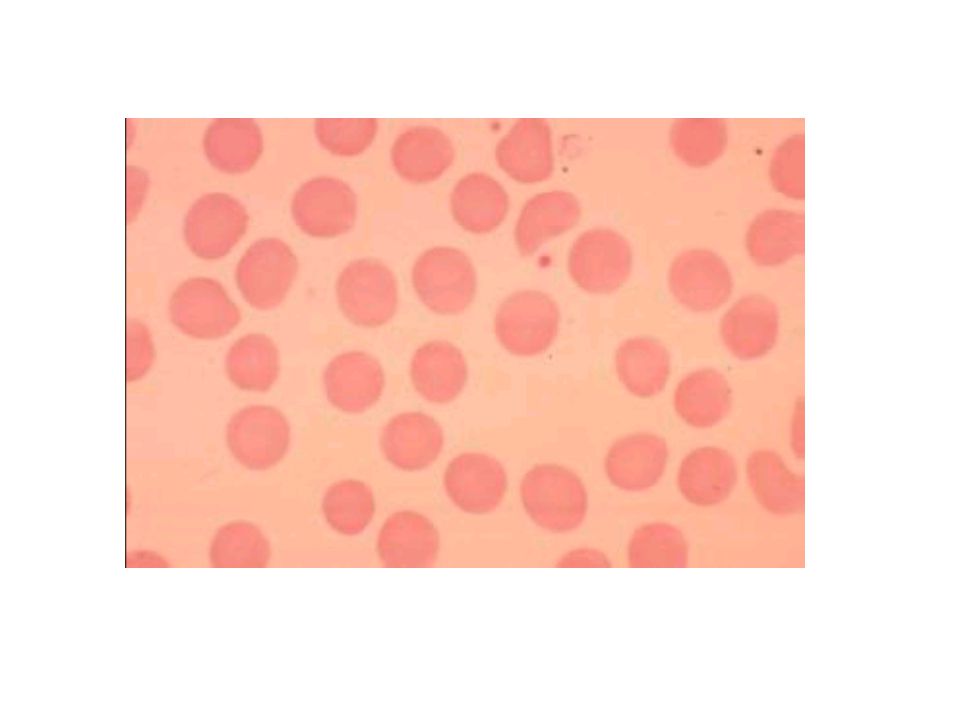
Normal RBCs Round, elastic, non-nucleated, bi-concave discs.
Many RBCs have an area of central pallor which covers about one-third of the cell. The pallor occurs as a result of the disc-shaped cells being spread on the slide. Size of normal RBC is almost the size of the nucleus of the lymphocyte.

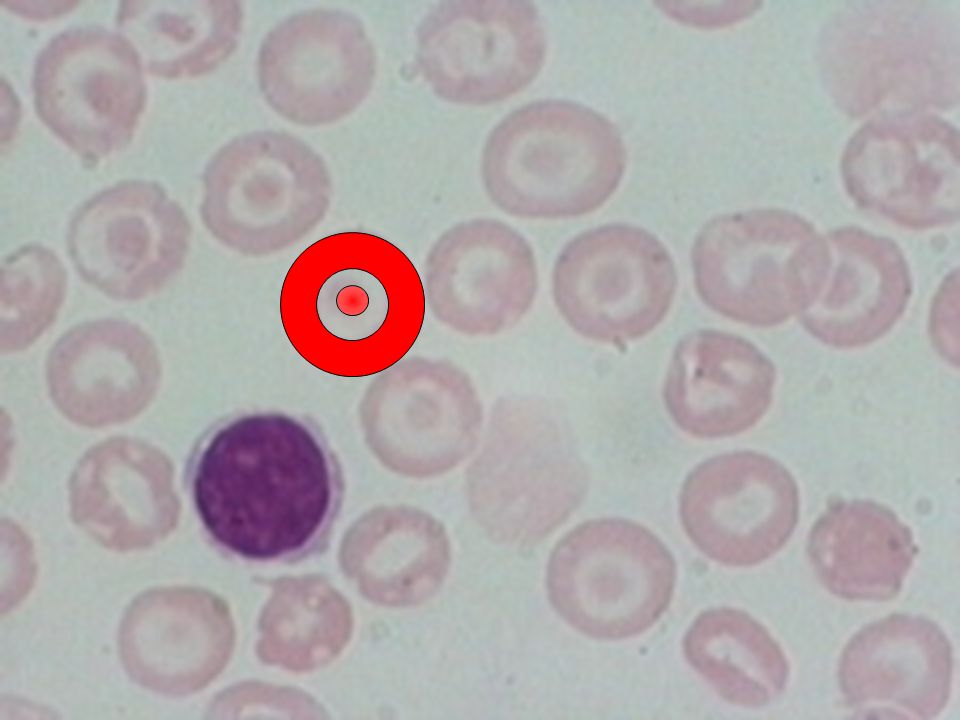
25
Microcyte Smaller than a nucleus of the lymphocyte,
central pallor is greater than 1/3 of the cell

26
Microcytes

28
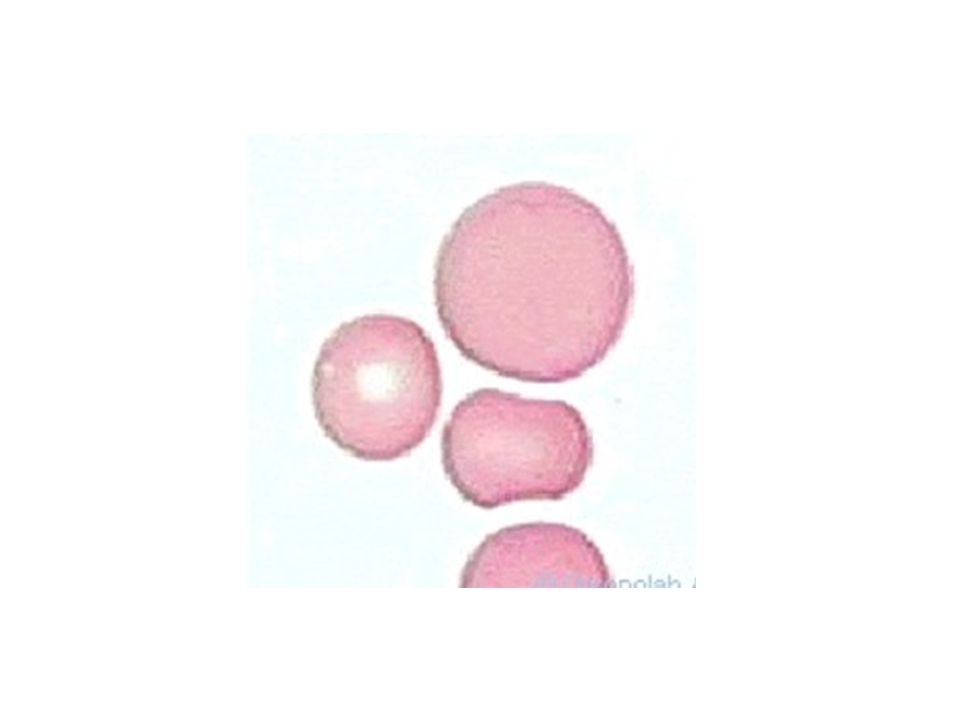
Macrocyte (megalocyte)
diameter of 9-14 microns ( times larger than normal red cells) MCV is 100 fL or more.
 MCV is 100 fL or more.")
30
Megalocytes Megalocytes are the result of decreased DNA synthesis, frequently due to vitamin B12 and/or folic acid deficiencies. Decreased DNA synthesis causes the nucleus in the developing red cells to mature at a slower than normal rate. Since hemoglobin production is not affected, the mature red cell is larger than normal

31
Macrocytes

33
MCH The mean cell hemoglobin (pg/cell)
The average amount of hemoglobin per red blood cell MCH = Hgb x 10 RBC (millions) Normal pg/cell
 Normal pg/cell.")
34
MCHC The mean concentration of hemoglobin per volume of red cells (gm/dl) The average concentration of hemoglobin in the cells. MCHC = Hgb x 100 Hct (%) If MCHC is normal: normochromic If MCHC is less than normal :hypochromic Normal gm/dL
 If MCHC is normal: normochromic. If MCHC is less than normal :hypochromic. Normal gm/dL.")
35
It should be pointed out that the determination of the MCH involves the red cell count which should be done in triplicate if accurate results are to be obtained. The red cell count is not involved in the determination of the MCHC, so the results tend to be more standard.

36
RBC Color Erythrocytes, when spread on a glass slide, show varying degrees of central pallor. This central pallor is related to the hemoglobin concentration present in the red cells. Megalocytes (macrocytes) are normochromic
 are normochromic.")
37
RBC Color The central area (1/3 of the cell) is white, while buff-colored hemoglobin is visible in the outer 2/3 of the cell. The MCHC (32-36 gm/dl) is the index value which is used to verify the presence of adequate hemoglobin concentration in the cells visible on the peripheral smear.
 is the index value which is used to verify the presence of adequate hemoglobin concentration in the cells visible on the peripheral smear.")
38
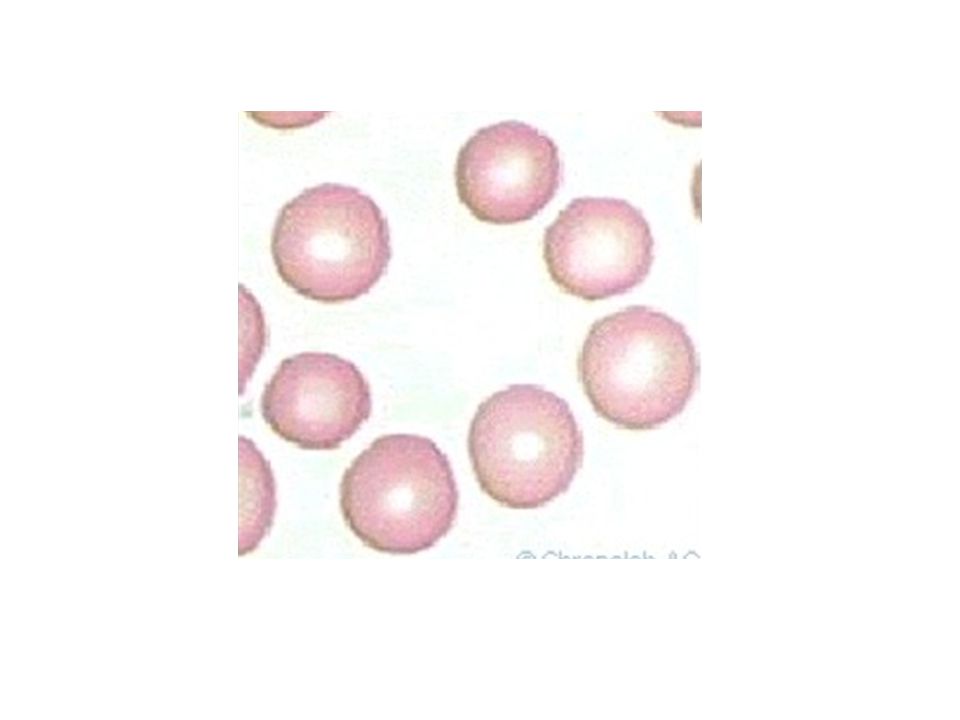
Normochromic cells

40
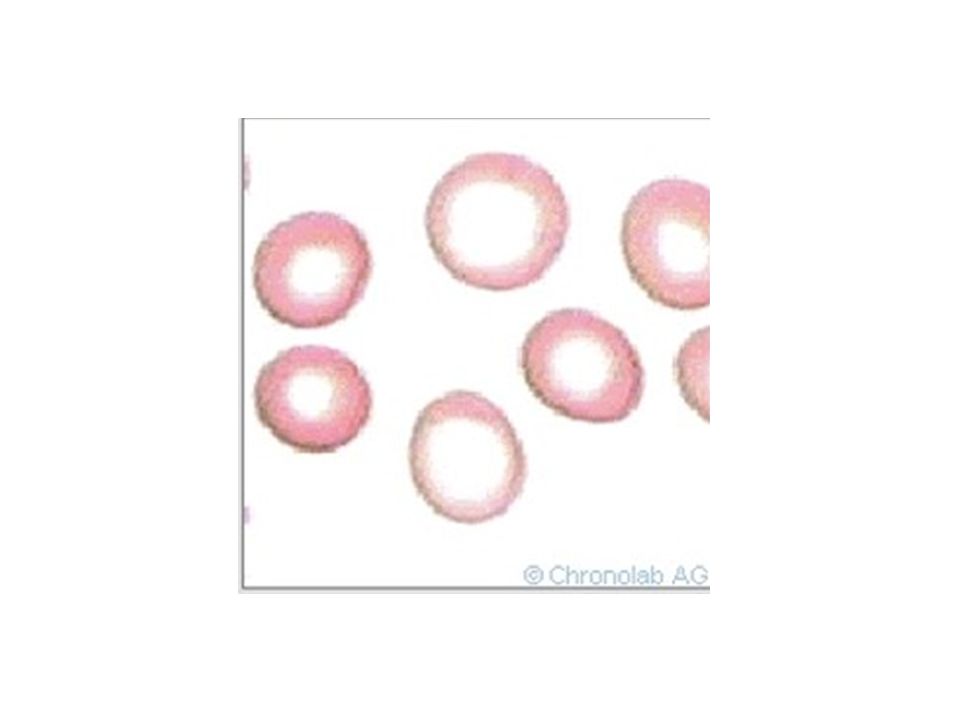
Hypochromic cells

43
Hyperchromic cells

46
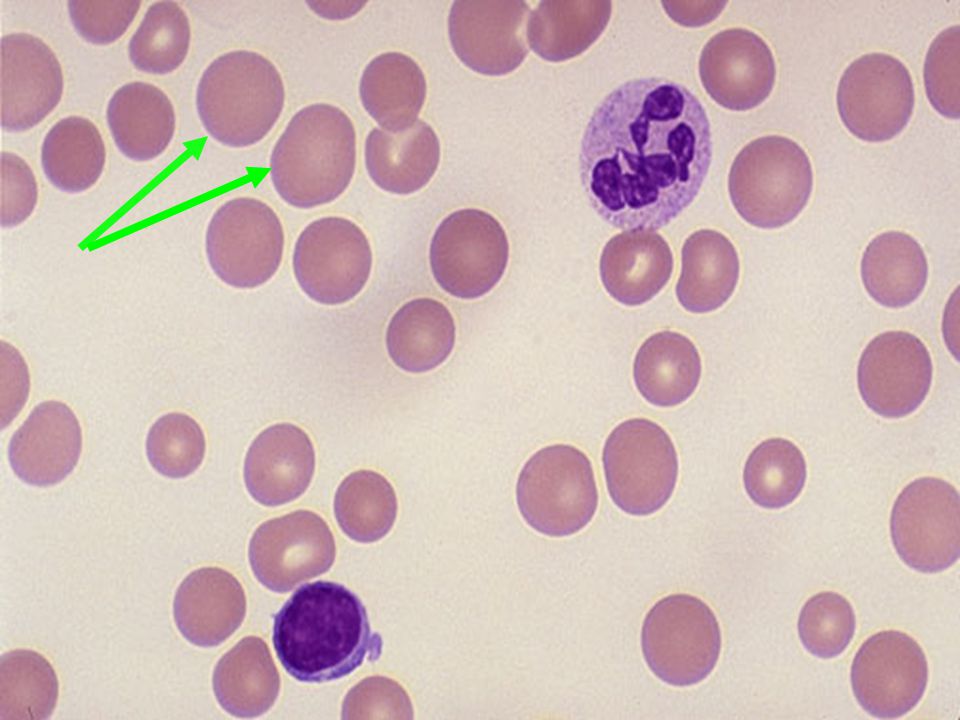
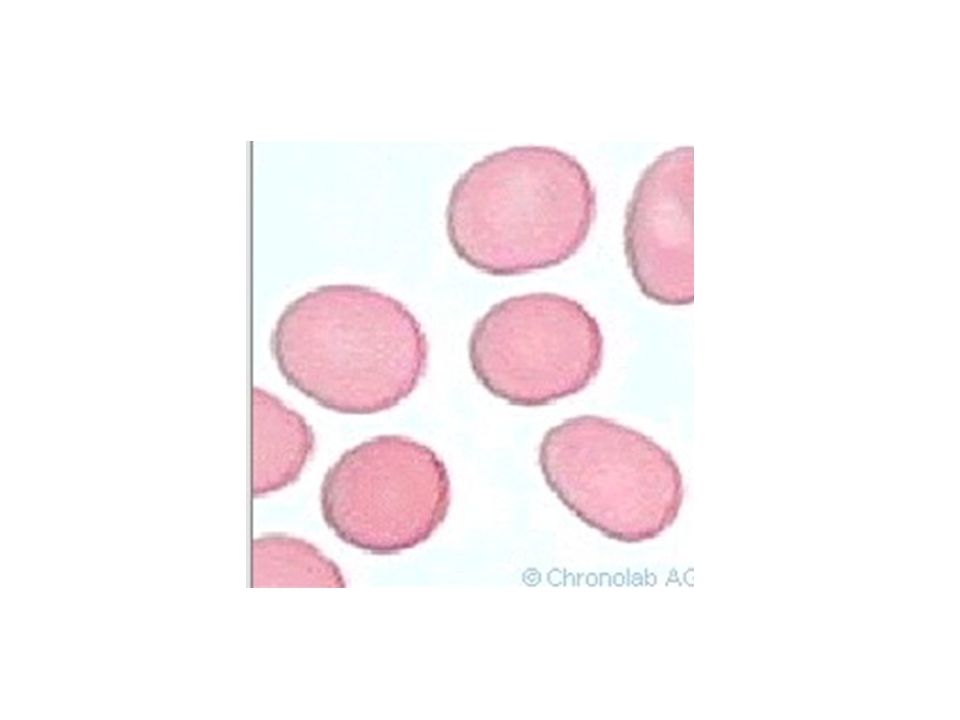
Polychromasia

47
RDW Most automated instruments now provide an RBC Distribution Width (RDW) An index of RBC size variation May be used to quantitate the amount of anisocytosis on peripheral blood smear Normal range is 11.5% to 14.5% for both men and women

48
RDW RDW is an expression of the homogeneity of the RBC population size. A large RDW says there's a wide variation in the RBC diameters within the test pool. It doesn't say the cells are large or small, rather that the population is not homogenous.

49
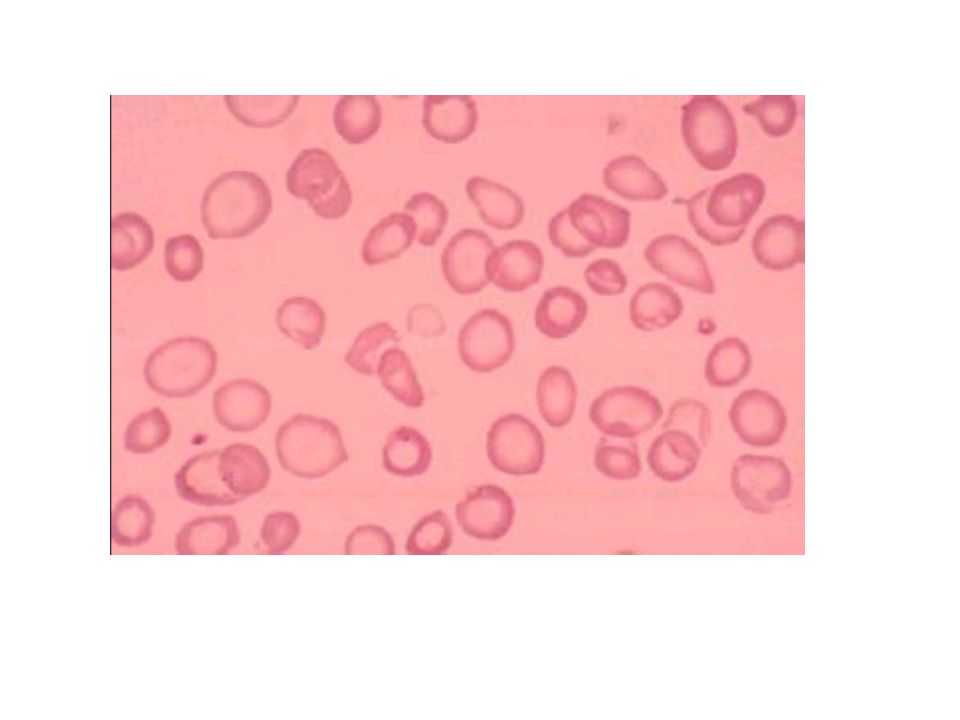
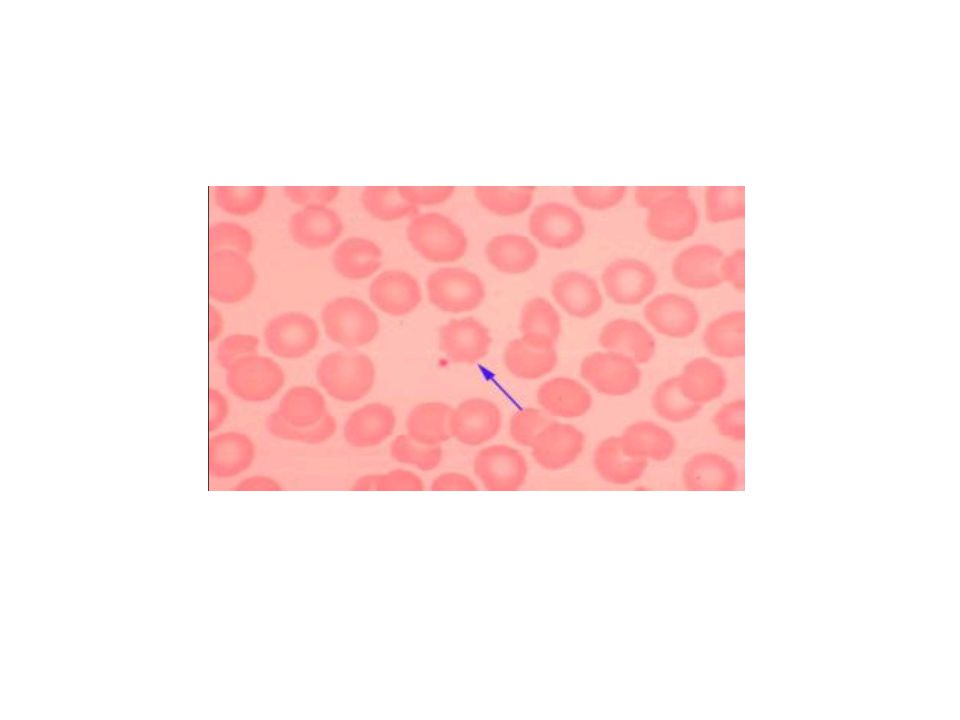
Anisocytosis Increased variation in size of the red cell population present on a blood smear. Normal, small and large cells can be seen in one field. As the severity of the anemia increases, the amount of significant anisocytosis present also increases.

50
Anisocytosis

51
Anisocytosis

52
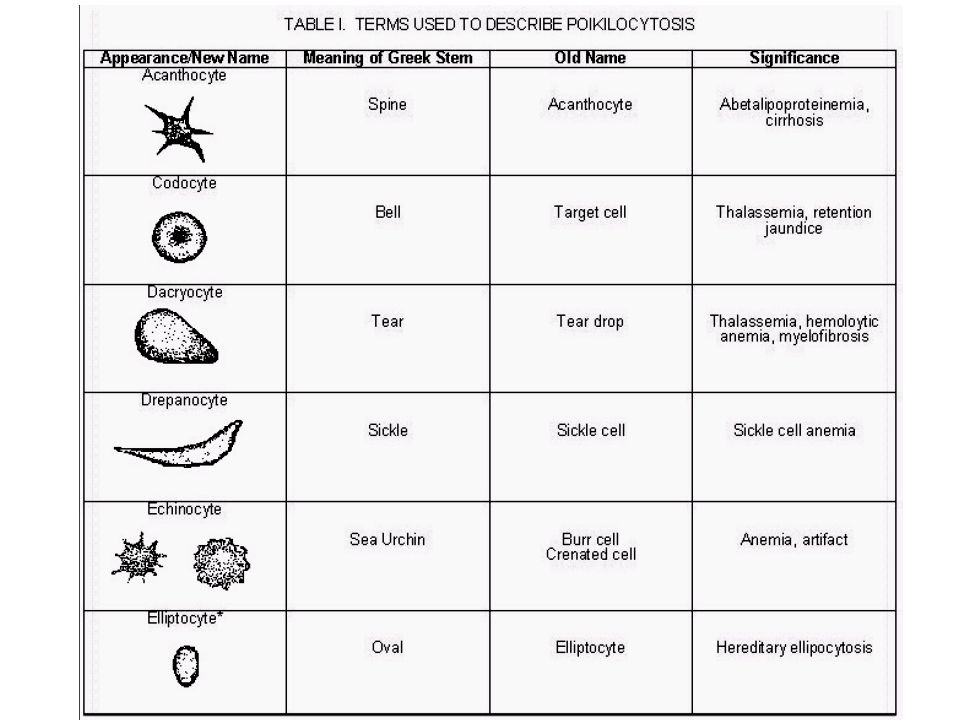
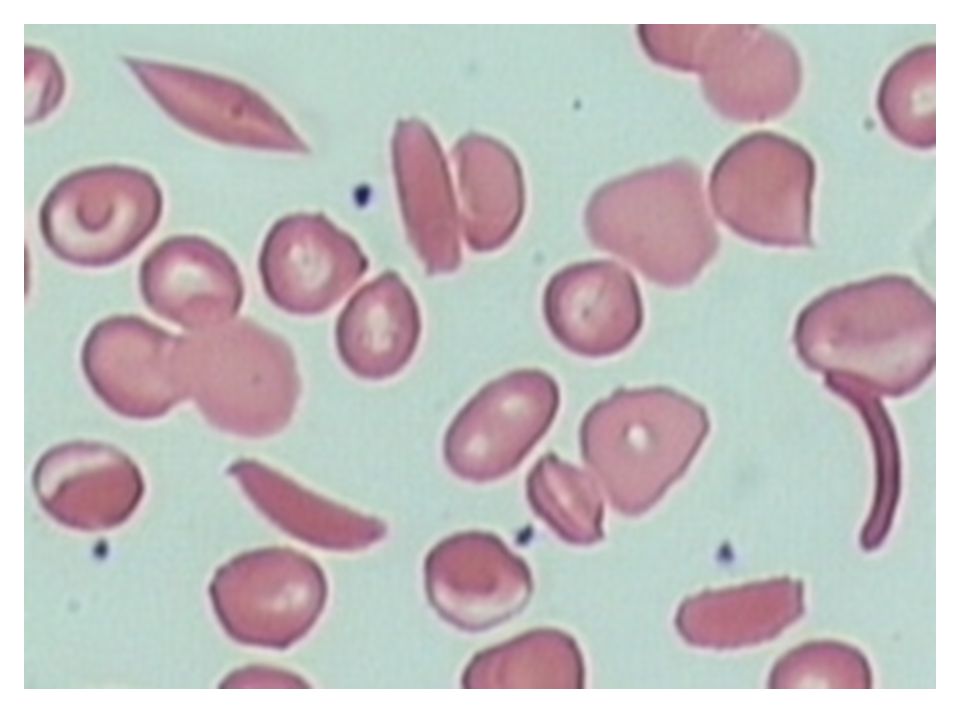
Poikilocytosis Variations in shape.

54
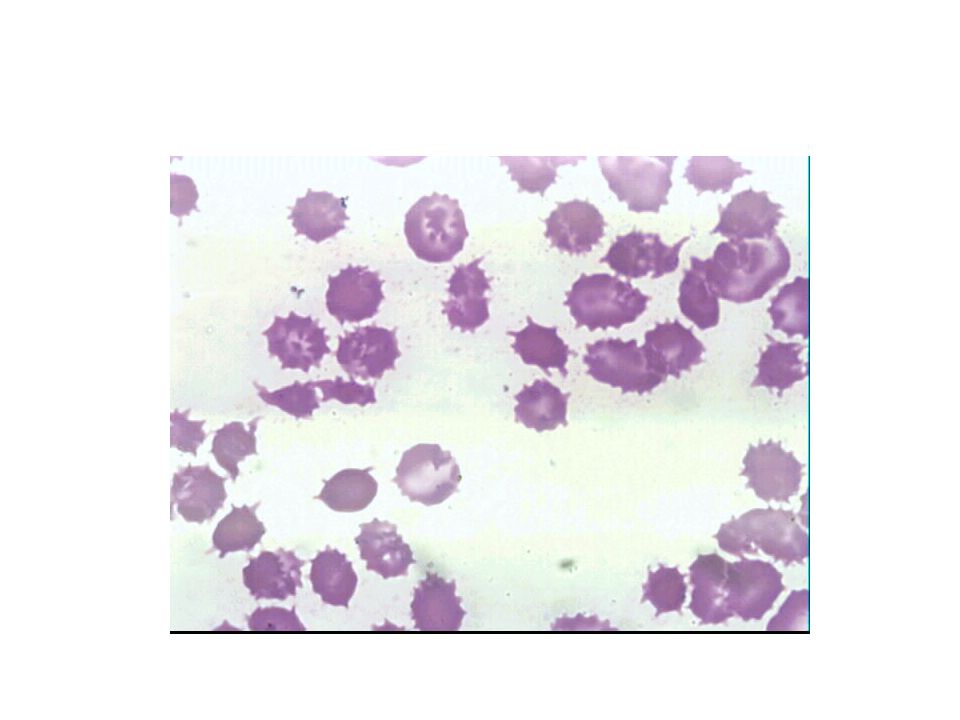
Acanthocytes 3-12 thorn-like projections irregularly spaced around the cell.

56
Codocyte Target cells are thin-walled cells showing a darkly-stained centre area of hemoglobin which has been separated from the peripheral ring of hemoglobin.

58
Dacrocyte Dacryocytes are pear-shaped or teardrop shaped cells.

59
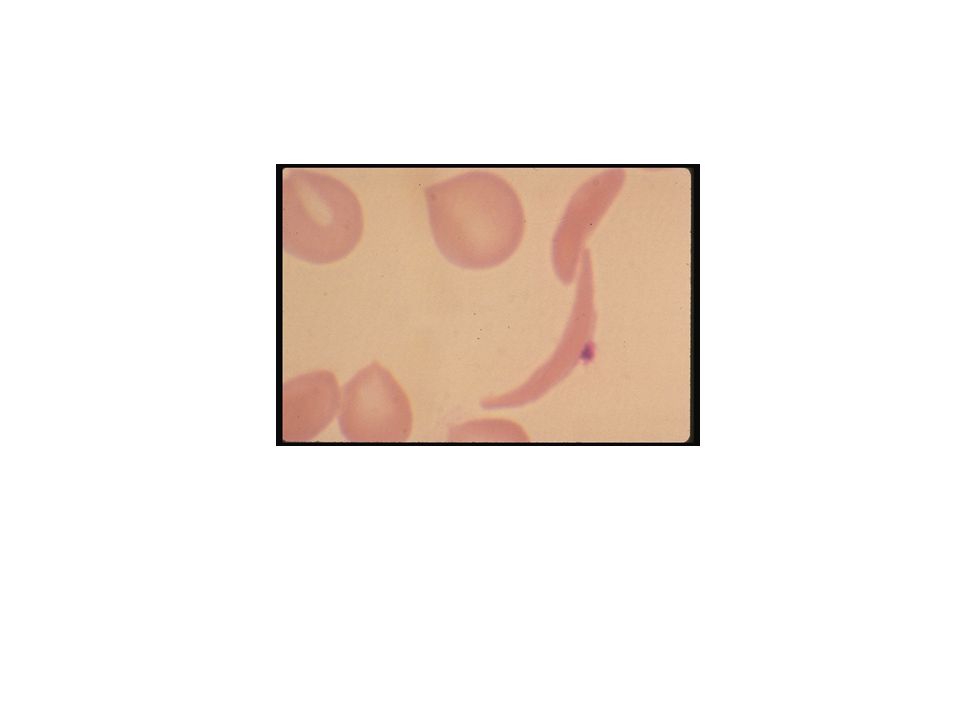
Drepanocytes Drepanocytes or sickle cells are formed as a result of the presence of hemoglobin S in the red cell.

62
Echinocyte The projections are rounded and evenly spaced around the cell. Acanthocytes have irregularly spaced thorn-like projections.

64
Elliptocytes Elliptocytes can vary in appearance from slightly oval to thin pencil-shaped forms. Less than 1% of red cells in normal blood are oval.

66
Anemias

67
Definition of Anemia Anemia is a functional inability of the blood to supply the tissue with adequate O2 for proper metabolic function. Anemia is usually associated with decreased levels of hemoglobin or a decreased RBC count. When you conclude that a patient has anemia, this is not a diagnosis but rather the expression of an underlying disorder or disease.

68
Quantitative Classification of Anemias
Quantitatively by: Hematocrit Hemoglobin Blood cell indices

69
Morphological Classification of Anemias
Morphological based on sizes and color of RBCs Normochromic Normocytic Hypochromic Microcytic Normochromic Macrocytic

70
Decreased MCV and Decreased MCHC
Microcytic/Hypochromic Anemia Iron deficiency Thalassemia Anemia of chronic disease Sideroblastic anemia Lead poisoning

71
Increased MCV, Decreased MCHC
Macrocytic/Normochromic Anemia Folate deficiency B12 deficiency

72
Thalassemias

73
Thalassemias Heritable,microcytic hypochromic anemia-with varying degrees of severity Genetic defects result in decreased or absent production of globin chain High incidence in Asia, Africa, Mideast, and Mediterranean countries

75
IRON DEFICIENCY ANEMIA

76
IRON DEFICIENCY ANEMIA
IRON METABOLISM ABSORPTION IN DUODENUM TRANSFERRIN TRANSPORTS IRON TO THE CELLS FERRITIN AND HEMOSYDERIN STORE IRON 10% of daily iron is absorbed

77
Most body iron is present in hemoglobin in circulating red cells
The macrophages of the reticuloendotelial system store iron released from hemoglobin as ferritin and hemosiderin Small loss of iron each day in urine, faeces, skin and nails and in menstruating females (1-2 mg daily)
")
78
IRON DEFICIENCY ANEMIA
ETIOLOGY: CHRONIC BLEEDING MENORRHAGIA PEPTIC ULCER STOMACH CANCER ULCERATIVE COLITIS INTESTINAL CANCER HAEMORRHOIDS DECREASED IRON INTAKE INCREASED IRON REQUIRMENT (JUVENILE AGE, PREGNANCY, LACTATION)
")
79
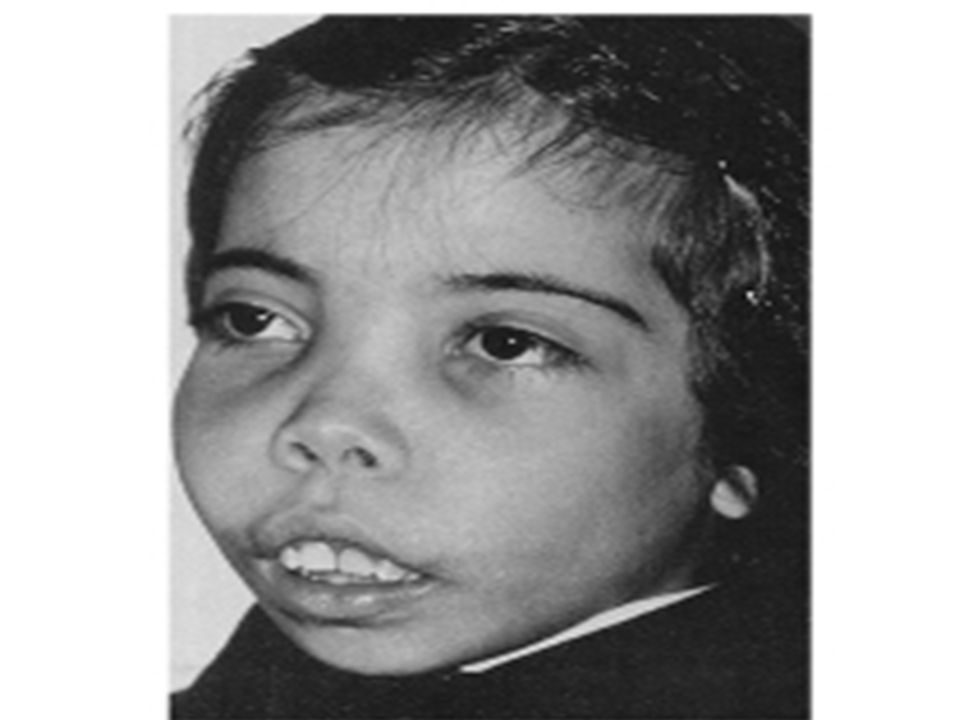
IRON DEFICIENCY ANEMIA
GENERAL ANEMIA’S SYMPTOMS: EASY FATIGABILITY DIZZENES HEADACHE IRRITABILITY PALLOR PALPITATION

80
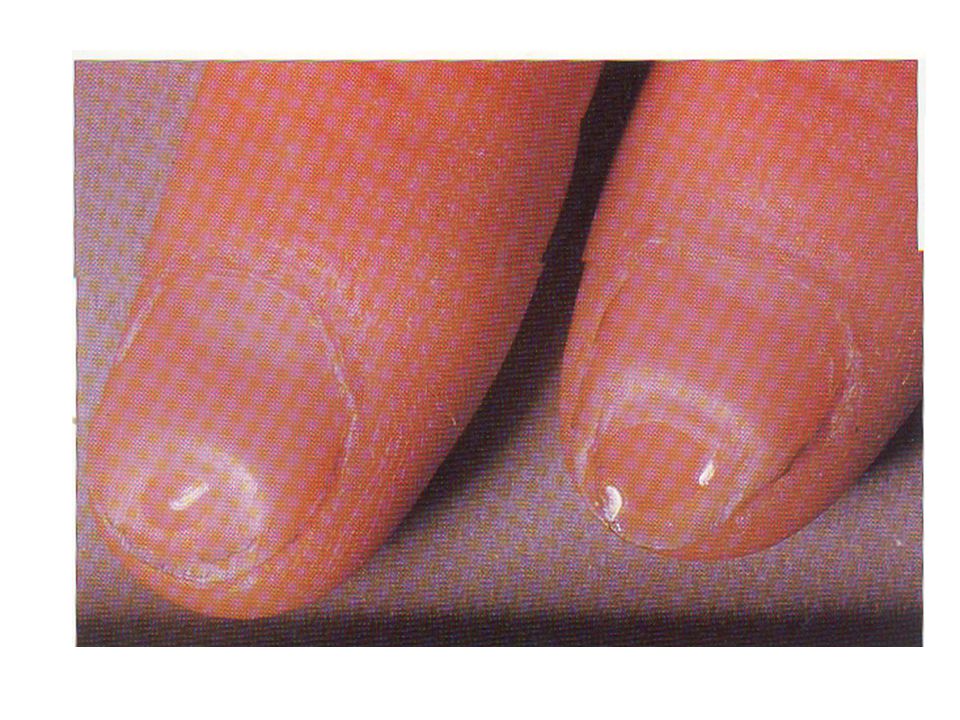
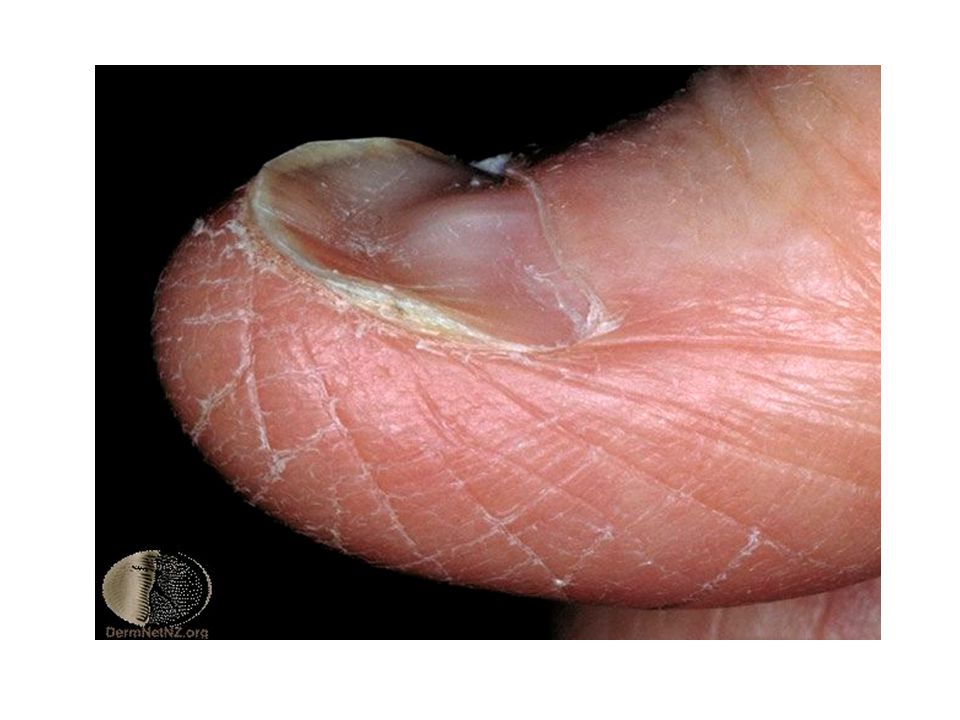
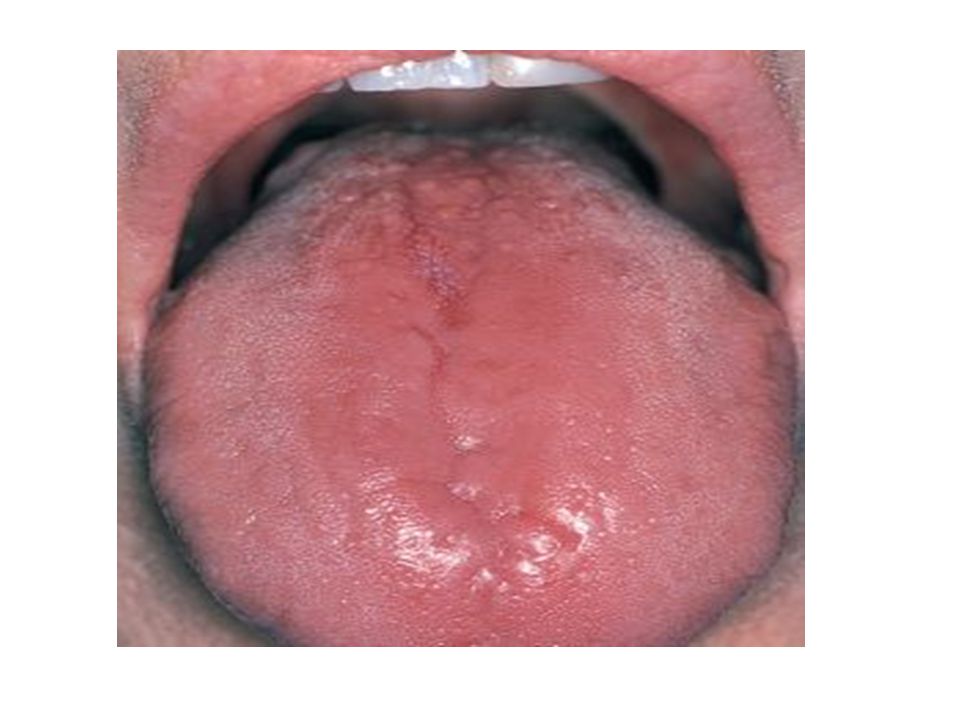
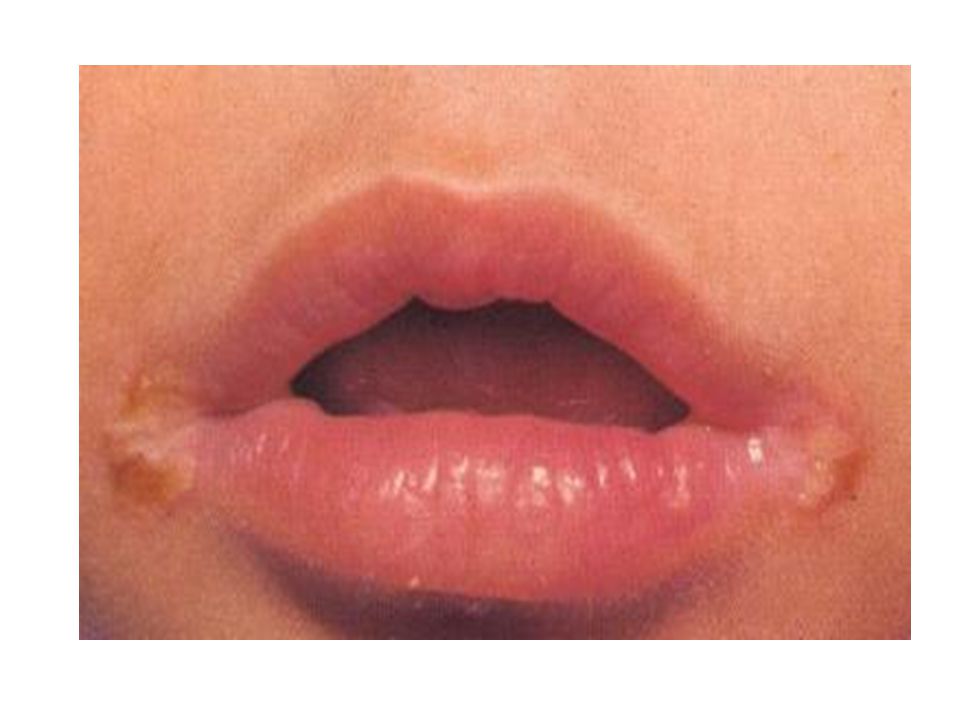
CHARACTERISTICS SYMPTOMS
GLOSSITIS, STOMATITIS DRY, PALE SKIN SPOON SHAPED NAILS, KOILONYCHIA, HAIR LOSS RAPID BIG VOLUME PULSE INCREASED PLATELET COUNT MURMER

81
IRON DEFICIENCY ANEMIA
MCV MCH MCHC

82
IRON Indices Iron concentration (Fe) Total Iron Binding Capacity
Transferrin saturation Transferrin receptor concentration Ferritin concentration

87
Iron deficiency anaemia Vs. Thalassemia
ASSIGNMENT Iron deficiency anaemia Vs. Thalassemia Compare USING MCV , MCH , MCHC

Similar presentations


. Complete Blood Count ( CBC)>")


 Course code :MLHE-201 Supervisor :Prof.Dr Magda Sultan. Date : 5/ 12 / 2013 Outcome : The student will know : The definition.>")