Download presentation
Presentation is loading. Please wait.

1
Maps Chapter 1

2
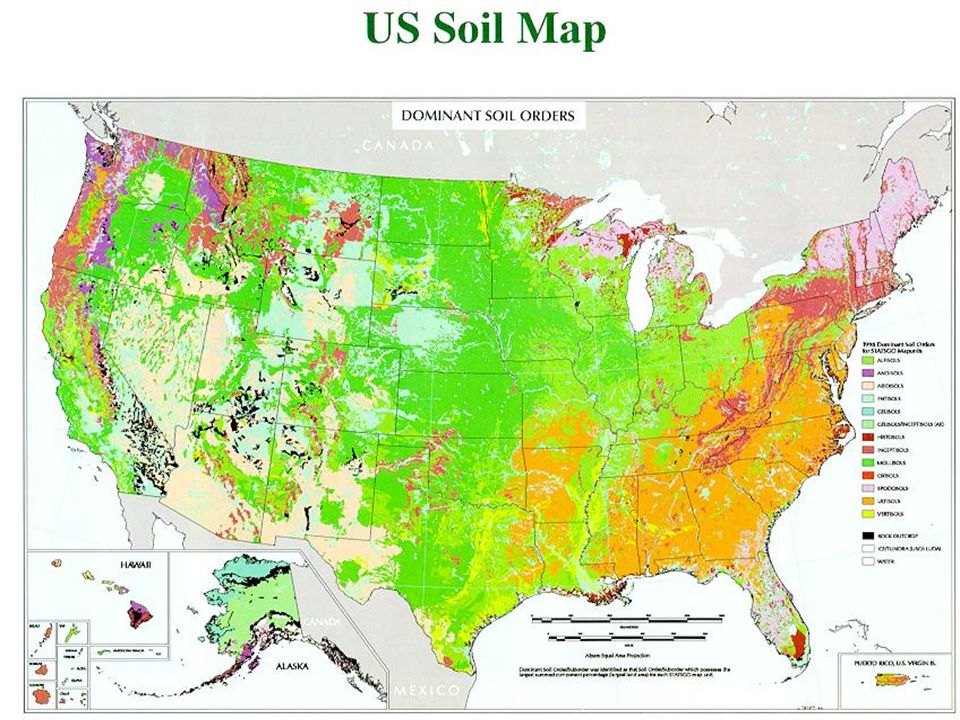
A map is a representation of the Earth’s surface
Map of Charlotte, NC

11
Map Characteristics Maps have scales Need to use a ruler

12
Can you tell me? The EXACT location of the red star on the basketball below? How could we make it easier to do this?

13
Can you tell me? The EXACT location of the red star on the Earth below? How could we make it easier to do this?

14
The Global Grid It would be impossible to describe a position on
Earth without some sort of grid system to give you an exact location. This grid system is called latitude and longitude.

15
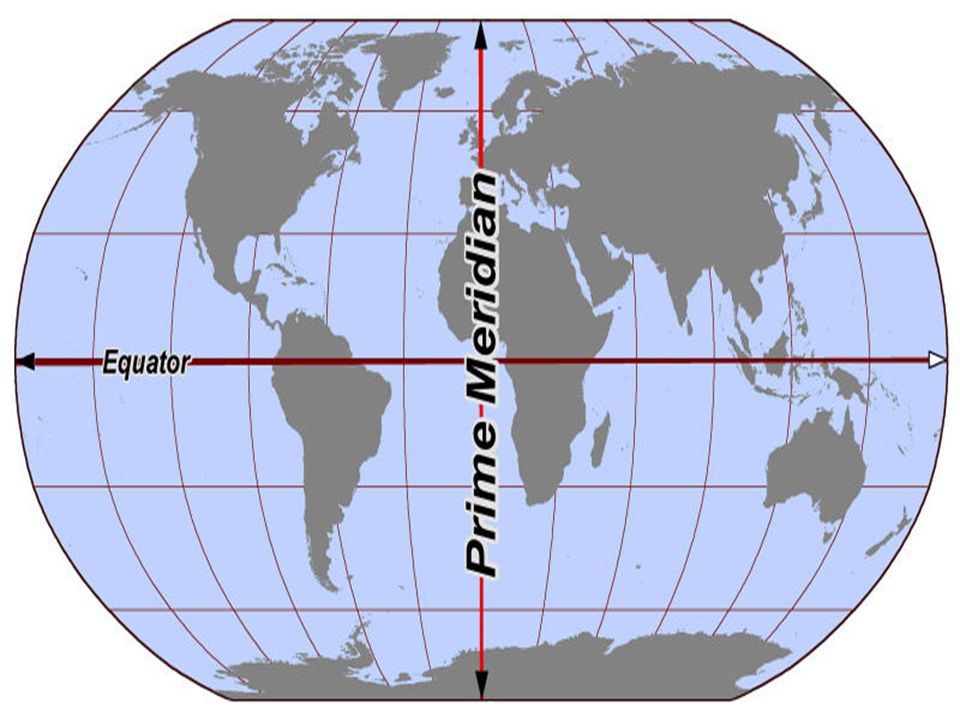
Hemispheres Hemisphere = Half of the Earth

17
Equator The equator cuts the Earth into the NORTHERN and SOUTHERN
hemispheres

18
Prime Meridian The prime meridian cuts the Earth into the EASTERN and
WESTERN hemispheres

19
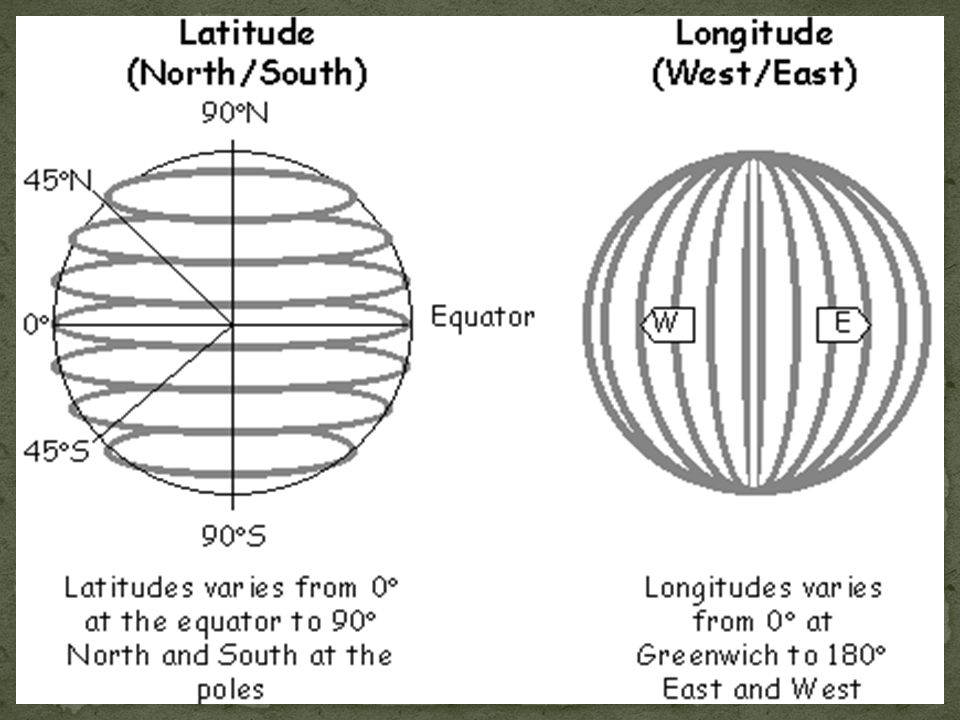
Latitude Measured from 0-90 degrees, N & S of the Equator (0 degrees)
Lines of latitude measure the distance NORTH or SOUTH of the equator Measured from 0-90 degrees, N & S of the Equator (0 degrees) There are 180 total degrees of Latitude.
 There are 180 total degrees of Latitude.")
20
Latitude = Ladder Think of latitude lines like steps on a ladder

21
O degrees

22
Latitude & Climate As your latitude INCREASES, your temperature DECREASES!! 90 90

23
The Climate Zones Lines of latitude divide the globe into 3 distinct climate zones

24
Longitude Lines of longitude measure the distance EAST or WEST of the prime meridian Measured degrees, E & W of the Prime Meridian (0 degrees)
")
26
Longitude = LONG hair Longitude lines are curved and meet at the poles.

27
Latitude vs. Longitude Latitude – HORIZONTAL lines
Longitude – VERTICAL lines

29
Youtube Clip

30
Practice Put on Your Thinking Cap

31
Practice Problems To find a location, you need BOTH the latitude and the longitude measurement!!

32
90W 75N A -_______________ B - ______________ C -_______________ D - ______________ E -_______________ F - ______________ G -_______________ H - ______________ I - _______________ J - _______________ 120W 60N 60E 60N 45W 15N 150W 0 120W 60S S 75E 15S 150E 45S 180E 30N

33
60E 30N 30W 30S 90W 0 75W 45N 25W 13N A -_______________
B - ______________ C -_______________ D - ______________ E -_______________ 30W 30S 90W 75W 45N 25W 13N

34
Topographic Maps Topographic maps show the Earth’s 3-dimensional surface They show ELEVATION and DEPRESSION by using contour lines.

35
Elevation vs. Depression
Elevation – when distance is RISING Depression – when distance is FALLING E L V A T I O N D E P R S I O N

36
Rules of Contour Lines

37
1. Every spot along a contour line is the SAME ELEVATION
1. Every spot along a contour line is the SAME ELEVATION. You could walk the entire distance around the mountain on a contour line and never gain or lose elevation.

38
What is the contour interval of this map?
2. The distance between any two contour lines ALWAYS remains the same. This is known as the CONTOUR INTERVAL What is the contour interval of this map? 20 feet

39
3. Normally every 5th contour line is darkened and labeled with its elevation. This is called an index contour.

40
Lines CLOSE together means a STEEP incline
4. Steepness of an area can be determined by the number of contour lines. Lines CLOSE together means a STEEP incline Lines far apart means a GENTLE incline

42
Which side of Fire Mountain is the steepest? (North or South)
")
43
The South side because the contour lines are closer together.

44
5. Contour lines that form a series of circles represents a HILL or MOUNTAIN

45
The top of the hill is the highest point and is higher than the closed contour.

46
The Highest point of a hill must be under what the next contour line would be.

47
If you walk from point D to point E would you be going uphill or downhill?

48
Uphill

49
Contour Map Profile

51
Matching Practice

52
6. Under normal circumstances contour lines NEVER touch or intersect each other.
* The only case this happens is with an overhanging cliff.

53
7. When showing DEPRESSION (elevation lowering), the contour line is drawn with hachure marks.
, the contour line is drawn with hachure marks.")
54
What is the elevation of point C? 0 feet C

55
What is the contour interval?

56
Answer = 20 Feet

57
What is the elevation of point A?

58
Answer = 150 Feet

59
What is the elevation of point B?

60
Answer = 110 feet

61
What is the difference in elevation between points A & C?

62
Answer = 40 Feet

63
Which mountain has crater at it’s top?

64
Fire Mountain: shown by depression contour (hachure marks).
.")
65
What is elevation of the highest contour line on this map?

66
Answer = 260 Feet

67
On mountain B, what side of the mountain has the STEEPEST slope?
East Southeast West B

68
3-Dimensional View of a Topographic Map
ature=player_detailpage#t=193s

Similar presentations


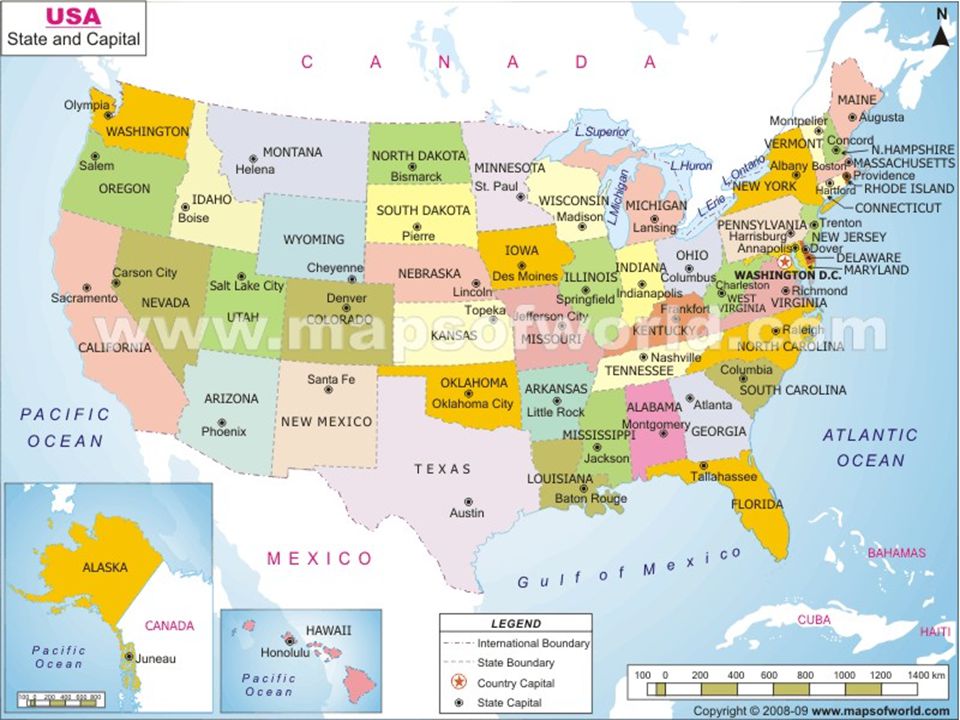


 write as many states as you can on the map of the USA.>")


 imaginary lines drawn around the earth parallel to the equator definition – the distance north or.>")
 around the earth's surface. Think of latitude like.>")
 Practical reasons such as.>")
