Download presentation
Presentation is loading. Please wait.

1
AP Human Geography Mr. Jones
Population AP Human Geography Mr. Jones

2
Demography Demography: the study of population
Why do we study population? Trends Find out what is changing Make predictions Demographics: population characteristics of a particular area

3
World Population

4
Most/Least Populated http://www.youtube.com/watch?v=EIZWX_AypNg

5
People are NOT distributed evenly across the Earth.

6
Population Concentrations
Where do people in the world live? Temperate (mid-latitude climates): not too hot or too cold, lots of vegetation (but no extremes – rainforest, tundra) Near water
: not too hot or too cold, lots of vegetation (but no extremes – rainforest, tundra) Near water.")
8
Major Population Centers
East Asia 1/4 of the world’s population is here-China with over 1.3 billion. Most Chinese live on the east coast. Other areas include Japan, Korea and Vietnam. Most people are farmers, not city dwellers.

9
Major Population Centers
South Asia 2nd major population cluster. dense pop. Along the Ganges and Indus rivers. 1.5 billion in South Asia and over 1.1 billion in India alone Bangladesh (size of Iowa) with 141 million.
 with 141 million.")
10
Major Population Centers
Europe 3rd in population with 700 million 75% to 90% living in cities. Population density varies from the highest in the Netherlands to very low in Iceland.

11
Major Population Centers
North America Megalopolis Boston to Washington, D.C. which includes New York, Philadelphia and Boston. Other major population concentrations: Chicago, Detroit, Cleveland, San Francisco, Los Angeles and San Diego. Unlike Europe, North America has large areas of sparsely populated regions.

12
Arithmetic Density the total number of people divided by the total land area highest population densities are found in Asia, Europe and Central America.

14
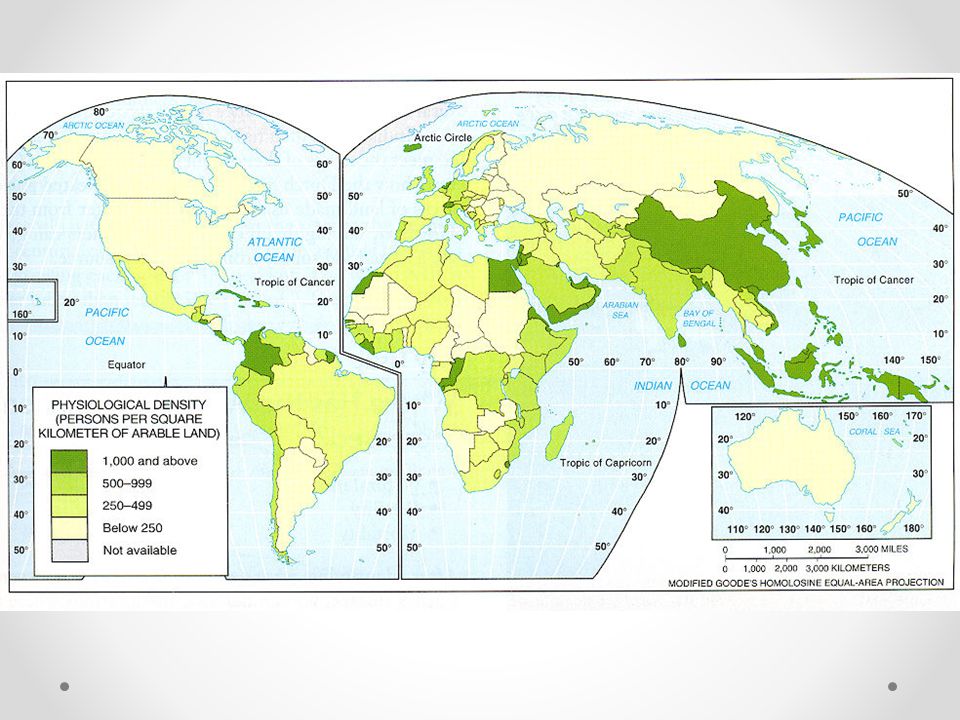
Physiological Density
the number of people per unit of arable land a better measure than arithmetic density of the relationship between population and resources can be misleading since it does not consider the productivity of the soil or the resources and expertise of the farmers

16
World Population Growth –
Rate of natural increase (does not take into account immigration and emigration).
.")
17
Today, the pace of world population growth is slowing
Today, the pace of world population growth is slowing. Where have Total Fertility Rates (TFRs) fallen below replacement level and why?
 fallen below replacement level and why")
18
Population Growth After 2 centuries of slow growth, world population began explosive growth after WW II. UN Projections are for global growth are at nearly 9 billion by 2050. The total may rise to over 11 billion by the end of the 21st century. Greatest growth in the 1990s took place in Asia, Sub-Saharan Africa.

19
After 2 centuries of slow growth, world population began explosive growth after WW II.
UN Projections are for global growth of nearly 9 billion by 2050. The total may rise to over 11 billion by the end of the 21st century. Greatest growth in the 1990s took place in Asia, Sub-Saharan Africa.

20
Crude Birth Rate: total # of births per 1000 of the population

21
Total Fertility Rate TFR is the average number of children that would be born to each woman if during her child-bearing years, she bore children at the same rate as women of those ages actually did in a given year. It is age-adjusted, thus 2 nations with identical birth rates may have quite different fertility rates and prospects for growth.

22
Total Fertility Rate

23
Replacement Rate Replacement fertility is the total fertility rate at which newborn girls would have an average of exactly one daughter over their lifetimes. That is, women have just enough female babies to replace themselves (or, equivalently, adults have just enough total babies to replace themselves).
.")
24
Total Fertility Rate (TFR) of 2.1 to 2.5 children per
TFR is the average number of children that would be born to each woman if during her child-bearing years, she bore children at the same rate as women of those ages actually did in a given year. It is age-adjusted, thus 2 nations with identical birth rates may have quite different fertility rates and prospects for growth. Total Fertility Rate (TFR) of 2.1 to 2.5 children per woman is considered “replacement level.”
 of 2.1 to 2.5 children per. woman is considered replacement level.")
25
TFR: Un Projections Years TFR 1950–1955 4.95 1955–1960 4.89
1950– 1955– 1960– 1965– 1970– 1975– 1980– 1985– 1990– 1995– 2000– 2005– 2010–

26
Crude Death Rates Aka mortality rate
# of deaths per 1000 individuals per year (thus, a mortality rate of 9.5 (out of 1000) in a population of 1,000 would mean 9.5 deaths per year in that entire population, or 0.95% out of the total) show less world wide variability than do birth rates due to widespread availability of at least minimal health care and a generally youthful population in the developing nations where death rates are frequently lower than in “old age” Europe.
 in a population of 1,000 would mean 9.5 deaths per year in that entire population, or 0.95% out of the total) show less world wide variability than do birth rates due to widespread availability of at least minimal health care and a generally youthful population in the developing nations where death rates are frequently lower than in old age Europe.")
27
Crude Death Rates show less world wide variability than do birth rates due to widespread availability of at least minimal health care and a generally youthful population in the developing nations where death rates are frequently lower than in “old age” Europe. Crude Death Rates

28
deblij_ch02_table01 deblij_ch02_table01.jpg

29
In the US 85 years and older is the fastest growing group in the US Population 2005 the “old old” topped 5 million By 2050 it is expected to be 20 million Midwest has a high percentage since the young leave for jobs elsewhere. Boston and San Francisco have gone grayer as seniors age in place.

30
85 years and older is the fastest growing group in the US Population
2005 the “old old” topped 5 million By 2050 it is expected to be 20 million Midwest has a high percentage since the young leave for jobs elsewhere. Boston and San Francisco have gone grayer as seniors age in place.

31
Infant Mortality Rates
Dramatic declines in the rates have occurred in all countries as a result of international health care delivery programs. Despite these efforts the most dramatic decreases in infant mortality have been in the urbanize, industrialized west.

32
Dramatic declines in the rates have occurred in all countries as a result of international health care delivery programs. Despite these efforts the most dramatic decreases in infant mortality have been in the urbanize, industrialized west. Infant Mortality Rate: - the number of deaths of children under the age of 1, per thousand of the general population.

33
Life Expectancy: The average number of years an individual can be expected to live, given current social, economic, and medical conditions.

34
Dependency Ratio The number of people under the age of 15 and over age 64, compared to the number of people active in the labor force.

35
Population under the age of 15 - usually shown as a percentage of the total population of a country - dependency age is 0-15

36
Mean Age http://world.bymap.org/MedianAge.html
“Train surfing” in Brazil

Similar presentations


 Total Fertility Rate (TFR) Crude Death Rate (CDR) Infant Mortality.>")


>")