Download presentation
Presentation is loading. Please wait.

1
Deterrence and the Death Penalty Llad Phillips

2
2 VI. Lecture Six: “Deterrence and the Death Penalty”, Professor Phillips Ch. 10 (P&V) "Isolating Deterrence Using the Simultaneous Equation System" References: Gary Becker, "Crime and Punishment: An Economic Approach" Journal of Political Economy, March/April 1968 (RBR)
 Isolating Deterrence Using the Simultaneous Equation System References: Gary Becker, Crime and Punishment: An Economic Approach Journal of Political Economy, March/April 1968 (RBR).")
3
Llad Phillips3 Economic Conditions and Crime n California Crime Index Turns Back Up in the New Millenium

4
Llad Phillips4

5
5

6
6 Damages: US Violence, 1993 Source: National Institute of Justice, Victim Costs and Consequences (1996)
")
7
Llad Phillips7 Increase in CA Homicides n 2002 to 2003: at least 10 more homicides u @$1,191,000, increased damages of $11.9 million, minimum n 2003: 2402 homicides u @$1,191,000, total damages of $ 2.86 billion http://caag.state.ca.us/

8
Llad Phillips8 Crime Generation Crime Control Offense Rate Per Capita Expected Cost of Punishment Schematic of the Criminal Justice System Causes ? (detention, deterrence) Expenditures Weak Link
 Expenditures Weak Link.")
9
Llad Phillips9 Questions About Crime n Does the Expected Severity of Punishment Deter Crime? u expected severity = probability of punishment * severity of punishment F e.g. in LA County: 0.005*death penalty n Why Do We Keep Building Prisons at Great Expense to Warehouse Convicts? u Doesn’t deterrence work? u Do we have to rely on detention?

10
Llad Phillips10 Controversy About the Death Penalty n Death penalty is the most severe sentence. u Does it deter crime? F Opponents of the death penalty say no. Their evidence? Critiques of studies that indicate the death penalty is a deterrent.Their evidence? Critiques of studies that indicate the death penalty is a deterrent. n Why are so few murderers who receive the death sentence executed in California? u Death sentence appeases the proponents. u Few executions appeases the opponents.

11
Llad Phillips11

12
Llad Phillips12 http://www.albany.edu/sourcebook

13
Llad Phillips13 Policy Impact of Opponents to the Death Penalty n As an instrument for crime control, deterrence has been a casualty of the argument about the death penalty. u The argument: if the death penalty does not deter murderers, then deterrence must not work as a control. n As a consequence, society relies more and more on detention for crime control. u Society builds more and more prisons.

14
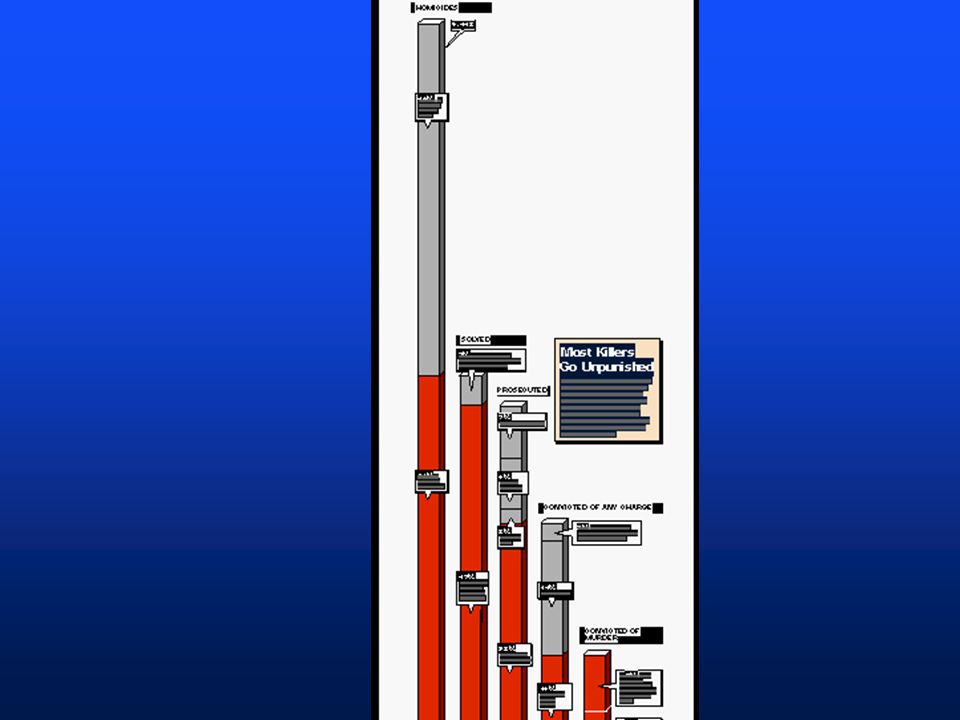
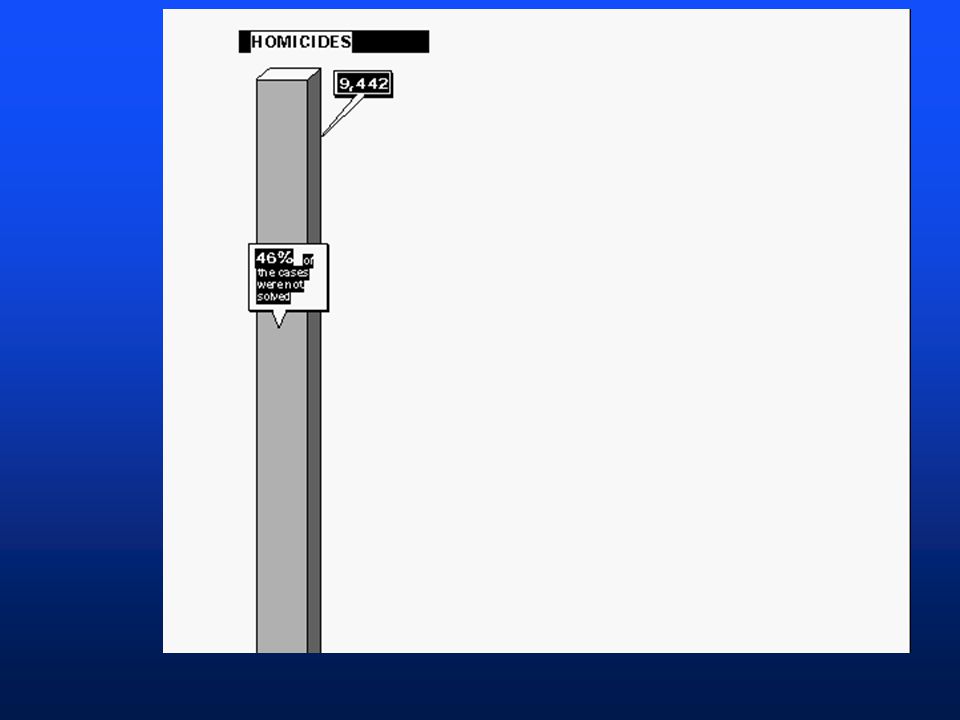
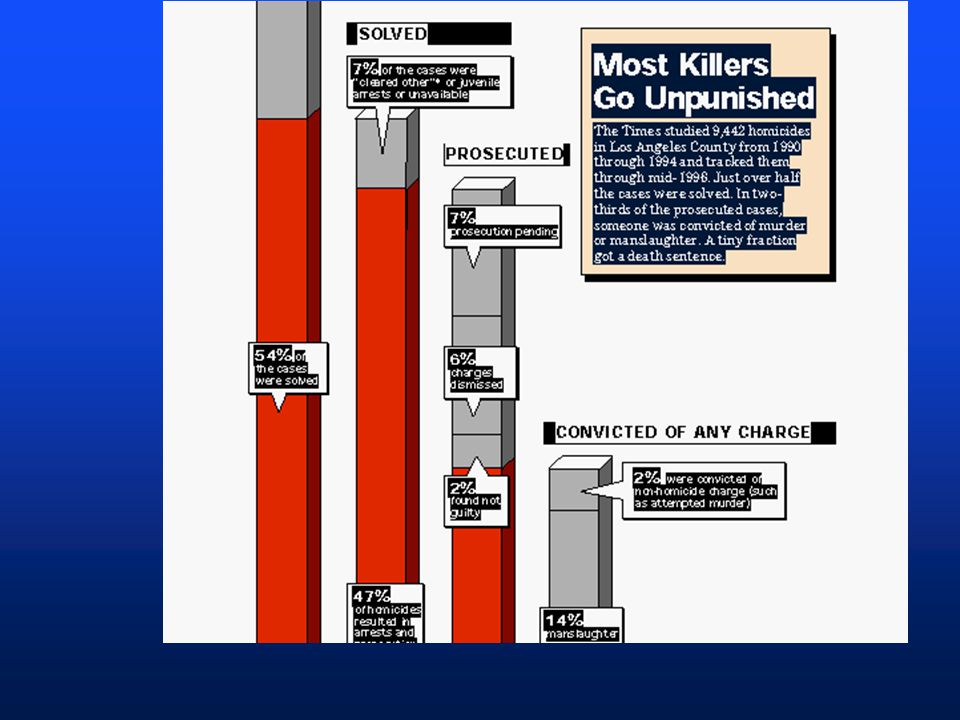
Llad Phillips14 Homicide in Los Angeles County n 1990-1994: 9442 homicides n Increasing number of gang murders u > 40 % of the total n Only 1 in 3 murders leads to punishment u gang killings are harder to solve

15
Llad Phillips15 9442 homicides in LA County 46% unsolved 54% solved 13% 87% arrest and prosecution (47%) 32% other dismissed or not guilty 68% guilty (32%) Branching Diagram
 32% other dismissed or not guilty 68% guilty (32%) Branching Diagram")
16
Llad Phillips16 Branching Diagram, Continued Guilty (32%) dismissed or not guilty Manslaughter 1st & 2nd degree murder (16%) 50% 15 years to life (7.0%) 25 years to life (5.0%) life without parole (3.5%) death sentence ( 0.5%) 3.1%
 dismissed or not guilty Manslaughter 1st & 2nd degree murder (16%) 50% 15 years to life (7.0%) 25 years to life (5.0%) life without parole (3.5%) death sentence ( 0.5%) 3.1%")
21
Llad Phillips21

22
Who has benefited the most from the decline in the homicide rate in the nineties?

23
Who is the victim, family, friend or stranger? http://caag.state.ca.us/ Homicide in California, 1998

24
Llad Phillips24 U.S.

25
Llad Phillips25 Death Sentences Commuted:US

26
Llad Phillips26 U.S.

27
Llad Phillips27 Executions in the United States

28
Llad Phillips28 Inflow Sentenced to Death Stock Prisoners on Death Row Outflow Sentences Commuted, Executions Administration of Capital Sentences in the US

29
Llad Phillips29 Prisoners on Death Row: US

30
Llad Phillips30 The Death Penalty in California n Eleven persons were executed between 1965 and 2005 n In January 2005, there were 640 convicts on death row

31
Llad Phillips31

32
Llad Phillips32

33
Llad Phillips33 California Department of Corrections: http//www.cdc.state.ca.us/

34
California Executions Since 1978 NameDate ReceivedDate ExecutedTime on Death Row Robert Alton Harris3/14/794/21/9213 years, 1 month David Edwin Mason1/27/84 8/24/93 9 years, 7 months William George Bonin3/22/82 2/23/96 13 years, 1 month Keith Daniel Williams4/13/79 5/3/96 17 years Thomas M. Thompson8/23/84 7/14/98 14 years, 1 month Kelvin Malone6/22/81 1/13/99 (Missouri) 15 years, 6 months Jaturun Siripongs5/2/83 2/9/99 15 years, 9 months Manuel Babbitt7/15/82 5/4/99 16 years, 10 months Darrell Keith Rich1/23/81 3/15/00 19 years, 1 month Robert Lee Massie5/28/79 3/27/01 21 years, 10 months Stephen Wayne Anderson7/30/81 1/29/02 20 years, 6 months
 15 years, 6 months Jaturun Siripongs5/2/83 2/9/99 15 years, 9 months Manuel Babbitt7/15/82 5/4/99 16 years, 10 months Darrell Keith Rich1/23/81 3/15/00 19 years, 1 month Robert Lee Massie5/28/79 3/27/01 21 years, 10 months Stephen Wayne Anderson7/30/81 1/29/02 20 years, 6 months.")
35
Llad Phillips35

36
Llad Phillips36

37
Llad Phillips37

38
Llad Phillips38

39
Llad Phillips39 Execution Witness Area

40
Llad Phillips40 Execution Chamber

41
Llad Phillips41 Gas Chamber

42
Llad Phillips42 Split Personality Behaviors Jack Hirshleifer: “The Expanding Domain of Economics” Choice Work and no violence Work and brawl in bars Economic Man motive: self-interest Economic Man motive: self-interest with episodes of antagonism

43
Assaulter’s Income Victim’s Income Total or Social Income Motivation for Violence: Antagonism Assaulters Iso-preference Lines High Low

44
choice Work and no violence Work and brawl in bars expect $24,000/yr Apprehended: lose 1 month in court and jail, $22,000 0.1 0.9 Not apprehended $24,000 Expected income: 0.1*$22,000 + 0.9*$24,000 = $23,800

45
Llad Phillips45 Questions About Statistical Studies of Deterrence n Do we know enough about the factors that cause crime? u Can we find variables that will control for variation in crime generation? n We have better measures for the factors that control crime than for the factors that cause crime. u Unknown variation in crime generation may mask the effects of crime control.

46
Llad Phillips46 Crime Generation Crime Control Offense Rate Per Capita Expected Cost of Punishment Schematic of the Criminal Justice System Causes ? (detention, deterrence) Expenditures Weak Link
 Expenditures Weak Link.")
47
Crime Generation 1. variation of offense rate per capita with expected cost of punishment 2. Shift in the relationship with a change in causal factors Offense rate per capita Expected cost(severity) of punishment crime generation function
 of punishment crime generation function.")
48
Crime Generation 1. variation of offense rate per capita with expected cost of punishment 2. Shift in the relationship with a change in causal factors Offense rate per capita Expected cost(severity) of punishment crime generation function High causal conditions Low causal conditions
 of punishment crime generation function High causal conditions Low causal conditions.")
49
Production Function for the Criminal Justice System (CJS) 1. Variation in expected costs of punishment with criminal justice system expenditure per capita Expected costs of punishment Criminal Justice System expenditures per capita production function

50
per capita expenditures on CJS offense rate per capita expected cost of punishment Crime Generation Four-Way Diagram: Crime Generation & Crime Control

51
per capita expenditures on CJS offense rate per capita expected cost of punishment Crime Generation Four-Way Diagram: Crime Generation & Crime Control per capita expenditures on CJS Production Function

52
per capita expenditures on CJS offense rate per capita expected cost of punishment Crime Generation Four-Way Diagram: Crime Generation & Crime Control per capita expenditures on CJS Production Function square 45 0

53
per capita expenditures on CJS offense rate per capita expected cost of punishment Crime Generation Four-Way Diagram: Crime Generation & Crime Control per capita expenditures on CJS Production Function square 45 0 1 1

54
per capita expenditures on CJS offense rate per capita expected cost of punishment Crime Generation Four-Way Diagram: Crime Generation & Crime Control per capita expenditures on CJS Production Function square 45 0 1 1

55
per capita expenditures on CJS offense rate per capita expected cost of punishment Crime Generation Four-Way Diagram: Crime Generation & Crime Control per capita expenditures on CJS Production Function square 45 0 1 1

56
per capita expenditures on CJS offense rate per capita expected cost of punishment Crime Generation Four-Way Diagram: Crime Generation & Crime Control per capita expenditures on CJS Production Function square 45 0 1 1

57
per capita expenditures on CJS offense rate per capita expected cost of punishment Crime Generation Four-Way Diagram: Crime Generation & Crime Control per capita expenditures on CJS Production Function square 45 0 1 1 2 2

58
per capita expenditures on CJS offense rate per capita expected cost of punishment Crime Generation Four-Way Diagram: Crime Generation & Crime Control per capita expenditures on CJS Production Function square 45 0 1 1 2 2 3

59
per capita expenditures on CJS offense rate per capita Four-Way Diagram: Crime Generation & Crime Control 1 2 3

60
Source: Report to the Nation on Crime and Justice

61
per capita expenditures on CJS offense rate per capita expected cost of punishment Crime Generation Four-Way Diagram: Crime Generation & Crime Control per capita expenditures on CJS Production Function square 45 0 1 1 2 2 3

62
Llad Phillips62 Summary n The death penalty stirs strong emotions. n To attack the death penalty, opponents have attacked the concept of deterrence. n Proponents of deterrence have lost the argument to proponents of detention. u Weakness: not understanding causes of crime. n Detention is the principal instrument of crime control policy today in the US.

64
Llad Phillips64 Prisoners Sentenced to Death:US

65
Llad Phillips65 Executions in the US

66
Llad Phillips66

Similar presentations


 F Practical:>")
