Download presentation
Presentation is loading. Please wait.

1
California Criminal Justice 1960-2006 1

2
2 The Phenomenon, P. 2 Flat

3
CA Criminal Justice System 3

4
The Sixties Offenses Per Capita grew at 8% per year CDC populations grew slowly at 1% per year 4

5
The Seventies Nixon and Kissenger bomb Cambodia Feb. 25, 1970 Bank of America burns In Isla Vista Offenses Per Capita grew at 2% per year, CDC populations fell -3.9% per year 5

6
The Eighties The War on Crime Plus the War on Drugs Nixon 1973 State of the Union: “Next week I will propose a revision of the entire Federal Criminal Code, modernizing it and strengthening it, to close the loopholes and tailor our laws to present day needs. When I say "modernize," incidentally, I do not mean to be soft on crime; I mean exactly the opposite. Mandatory minimum drug sentences: 1986 Federal Sentencing Guidelines, 1987 “Just say no” Offenses Per Capita fell at -1.5% per year, CDC populations grew at 13% per year 6

7
The Nineties Offenses per capita fell at –7.6% per year CDC Populations grew at 4.5% per year 7

8
CA Criminal Justice System 8% 2%-1.5%-7.6% 1%-3.9% 13% 4.5% 8

9
Folk Sayings “A day late and a dollar short” “A day late and a dollar short” How about “two decades late and out to lunch”? How about “two decades late and out to lunch”? 9

10
Corrections Advanced 2 Decades 10

11
What was the trigger in the 60’s? Two Possibilities: Two Possibilities: #1: Advancement of the White Middle Class & the stagnation of the Black Middle Class #1: Advancement of the White Middle Class & the stagnation of the Black Middle Class #2: The War on Drugs created a criminal class, just as prohibition did in the twenties #2: The War on Drugs created a criminal class, just as prohibition did in the twenties 11

12
World War Two & the GI Bill 16.1 million men served in WWII, 1,054,000 Black men served in a mostly segregated armed services 16.1 million men served in WWII, 1,054,000 Black men served in a mostly segregated armed services 2.2 primarily white men received higher education benefits, as well as housing benefits 2.2 primarily white men received higher education benefits, as well as housing benefits By 1947, about ½ of college students were vets By 1947, about ½ of college students were vets Reference: Edward Humes, Over Here: How the G I Bill Transformed the American Dream (2006) Harcourt Reference: Edward Humes, Over Here: How the G I Bill Transformed the American Dream (2006) Harcourt 12
 Harcourt Reference: Edward Humes, Over Here: How the G I Bill Transformed the American Dream (2006) Harcourt 12")
13
Prohibition: 1920-1933 Twice as many speakeasies in New York as there had been saloons 13

14
The Drunkards Progress, lithograph by Currier & Ives 14

15
Coast Guard & Rum Runners Indian Lake Boat Co., Lima OH The Mendota and the Edna British Schooner Katherine and Motorboat off NJ Only about 5% of booze was intercepted 15

16
The Godfather The Godfather 16

17
Review: Part II 17

18
Summary: Part I CA & US Offenses and Prisoners have similar growth patterns CA & US Offenses and Prisoners have similar growth patterns Offenses per capita grew rapidly in the sixties, slowly in the seventies, fell modestly in the eighties and dropped in the nineties Offenses per capita grew rapidly in the sixties, slowly in the seventies, fell modestly in the eighties and dropped in the nineties Prisoners per capita did not start growing until the eighties, so can not explain the slower growth of offenses in the seventies Prisoners per capita did not start growing until the eighties, so can not explain the slower growth of offenses in the seventies Growth of crime in 60’s may be due to leaving blacks largely out of GI Bill Growth of crime in 60’s may be due to leaving blacks largely out of GI Bill 18

19
http://www.drugwarfacts.org/crime.pdf 19

20
ditto 20

21
CA Criminal Justice System 8% 2% -1.5%-7.6% 1% -3.9% 13% 4.5% Note: Offenses Per Capita are rising in 60’s & less fast in 70’s while prisoners & parolees are falling so detention is not Causing the slowdown! 21

22
When offenses started to rise in the 60’s the first response was to increase cops on the street, i.e. labor. It takes longer to increase capital, i.e. build prisons OF = f(CR, SV, SE, MC) OF = f(CR, SV, SE, MC) CR = g(OF, L, K) CR = g(OF, L, K) 22
 OF = f(CR, SV, SE, MC) CR = g(OF, L, K) CR = g(OF, L, K) 22.")
23
The Role of Gangs Homicide as a window on gangs Homicide as a window on gangs 23

24
US 24

25
25

26
Questions Why did crime go up so quickly in the 60’s? Why did crime go up so quickly in the 60’s? Why did growth taper off in the 70’s? Why did growth taper off in the 70’s? Not detention Not detention Maybe deterrence Maybe deterrence Maybe improving causal conditions Maybe improving causal conditions Why did crime fall in the 90’s Why did crime fall in the 90’s 26

27
Homicide Clearance Ratios 27

28
Homicide in Los Angeles County 1990-1994: 9442 homicides 1990-1994: 9442 homicides Increasing number of gang murders Increasing number of gang murders > 40 % of the total > 40 % of the total Only 1 in 3 murders leads to punishment Only 1 in 3 murders leads to punishment gang killings are harder to solve gang killings are harder to solve

29
29

30
Summary US drug policy has created a gang problem and a homicide problem by creating an illegal occupation for young people US drug policy has created a gang problem and a homicide problem by creating an illegal occupation for young people This corresponds to our country’s earlier experience where 13 years of prohibition(1920-1933) funded the Mafia This corresponds to our country’s earlier experience where 13 years of prohibition(1920-1933) funded the Mafia It pays to fight for drug turf just like it paid to fight for control of speakeasies, smuggling, and protection rackets It pays to fight for drug turf just like it paid to fight for control of speakeasies, smuggling, and protection rackets 30
 funded the Mafia This corresponds to our country’s earlier experience where 13 years of prohibition( ) funded the Mafia It pays to fight for drug turf just like it paid to fight for control of speakeasies, smuggling, and protection rackets It pays to fight for drug turf just like it paid to fight for control of speakeasies, smuggling, and protection rackets 30")
31
31 Subtracting 40% of Homicides that are Gang related

32
Damages: US Violence, 1993 Source: National Institute of Justice, Victim Costs and Consequences (1996) 2007: 16929 homicides in US. If we saved 40% Of these, we would save 6772 lives worth $8 Billion in 1993 $. As Milton Friedman noted, US Drug policy is not just mis-guided, it is immoral. It funds gangs and it kills citizens.

33
Review: Part III Four data sets: Four data sets: CA prisoners 1851-1945: consistent with a Kondratiev wave (Lecture: strategies to estimate deterrence) CA prisoners 1851-1945: consistent with a Kondratiev wave (Lecture: strategies to estimate deterrence) US homicide rates per 100,000 1900-2007: consistent with a Kondratiev wave (Lecture: strategies to estimate deterrence) US homicide rates per 100,000 1900-2007: consistent with a Kondratiev wave (Lecture: strategies to estimate deterrence) CA Index offense rate per capita, 1952-2007, increases with the misery rate and decreases with prisoners per capita (Lecture: strategies to estimate deterrence) CA Index offense rate per capita, 1952-2007, increases with the misery rate and decreases with prisoners per capita (Lecture: strategies to estimate deterrence) 33
 CA prisoners : consistent with a Kondratiev wave (Lecture: strategies to estimate deterrence) US homicide rates per 100, : consistent with a Kondratiev wave (Lecture: strategies to estimate deterrence) US homicide rates per 100, : consistent with a Kondratiev wave (Lecture: strategies to estimate deterrence) CA Index offense rate per capita, , increases with the misery rate and decreases with prisoners per capita (Lecture: strategies to estimate deterrence) CA Index offense rate per capita, , increases with the misery rate and decreases with prisoners per capita (Lecture: strategies to estimate deterrence) 33")
34
Review: Part III (Cont.) Expenditures per capita by state in US and UCR Index Offenses per capita, 2002 (Lecture: Crimein California) Expenditures per capita by state in US and UCR Index Offenses per capita, 2002 (Lecture: Crimein California) Findings: Investment in education, moral compliance, and fewer children in poverty significantly reduces crime Findings: Investment in education, moral compliance, and fewer children in poverty significantly reduces crime Higher income per capita significantle reduces crime Higher income per capita significantle reduces crime 34
 Expenditures per capita by state in US and UCR Index Offenses per capita, 2002 (Lecture: Crimein California) Expenditures per capita by state in US and UCR Index Offenses per capita, 2002 (Lecture: Crimein California) Findings: Investment in education, moral compliance, and fewer children in poverty significantly reduces crime Findings: Investment in education, moral compliance, and fewer children in poverty significantly reduces crime Higher income per capita significantle reduces crime Higher income per capita significantle reduces crime 34")
35
35 Expenditures Per Capita UCR Offenses Per Capita CCTIncome Education Moral Compliance Less poverty

36
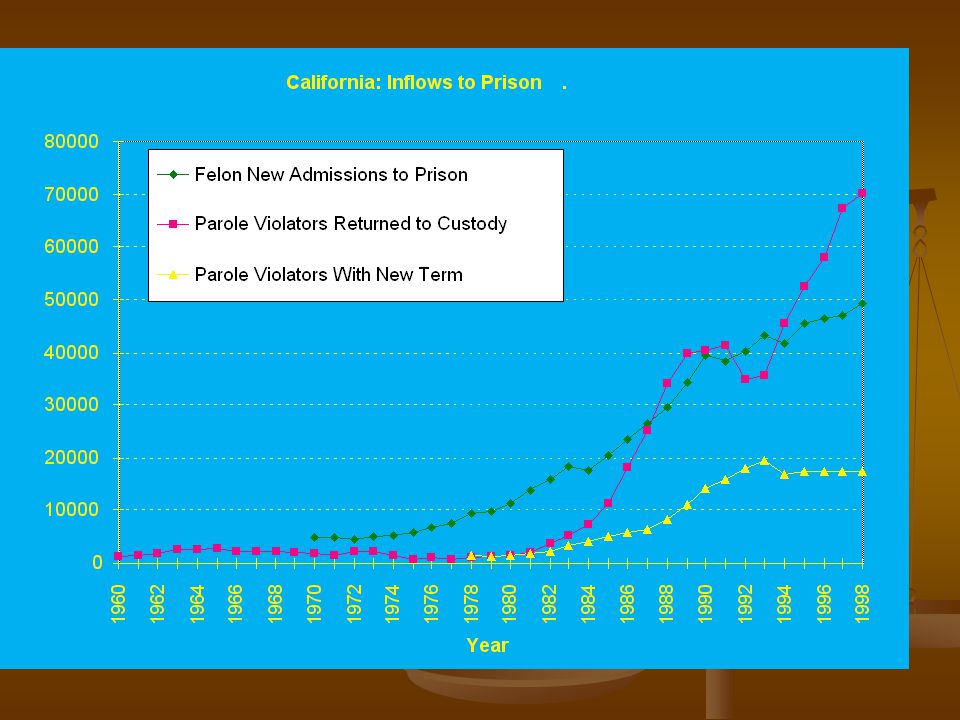
Review: Part IV Inefficiency in CA corrections Inefficiency in CA corrections Corrections is not in equilibrium, i.e. discharges from parole are less than new admissions to prison from court (inflow) Corrections is not in equilibrium, i.e. discharges from parole are less than new admissions to prison from court (inflow) Parole violaters returned to prison with a new term, PVWNT, and parole violaters returned to custody, mean people spend much longer in prison than is optimal if parole were effective Parole violaters returned to prison with a new term, PVWNT, and parole violaters returned to custody, mean people spend much longer in prison than is optimal if parole were effective 36
 Corrections is not in equilibrium, i.e. discharges from parole are less than new admissions to prison from court (inflow) Parole violaters returned to prison with a new term, PVWNT, and parole violaters returned to custody, mean people spend much longer in prison than is optimal if parole were effective Parole violaters returned to prison with a new term, PVWNT, and parole violaters returned to custody, mean people spend much longer in prison than is optimal if parole were effective 36.")
38
California Department of Corrections 1996 Prisoners 145,565 Parolees 100,935 Felon New Admits 46,487 Releases to Parole 111,532 Discharged and Died 27,691 57,984 Parole Violators Returned to Custody Parole Violators With a New Term 17,525 Parolees At Large 18,034 Discharged and Died 3,984 Absconded 29,376

39
39 Prison New Admits Parole discharges PVWNT Inefficient Corrections System

40
40 Prison New Admits Parole discharges Efficient Corrections System

41
41

42
42

Similar presentations


 F Practical:>")


