Download presentation
Presentation is loading. Please wait.

2
1 The Economics of Crime and Justice

3
2

4
3 The News w Gangs w Drugs

5
4

6
5

7
6

8
7 Tu Feb 7, 07

9
8

10
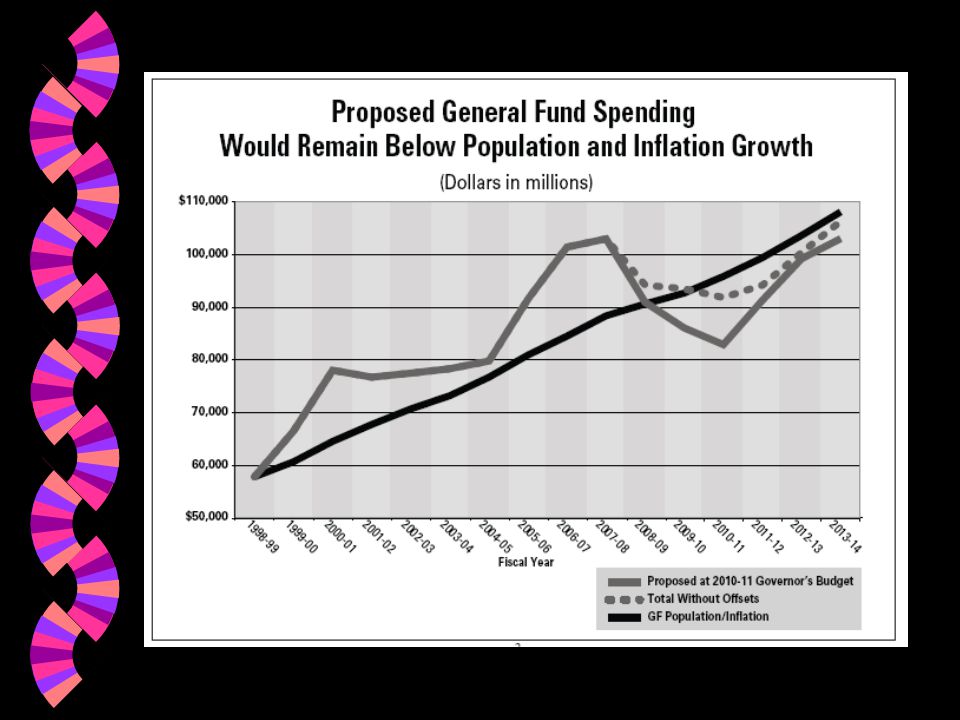
California Government ANA Matasantos

11
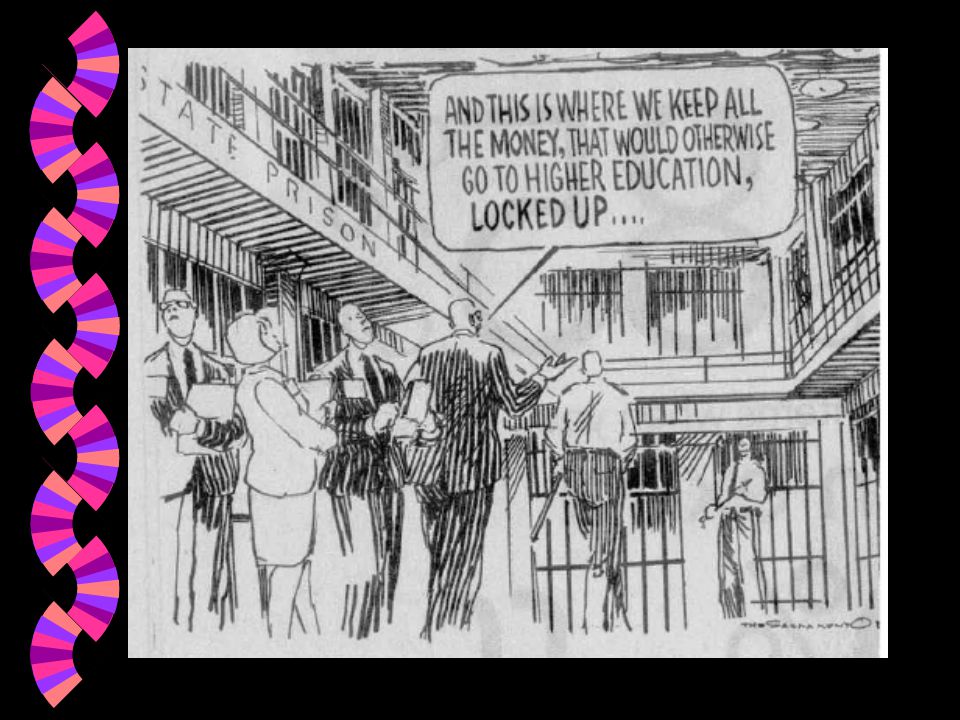
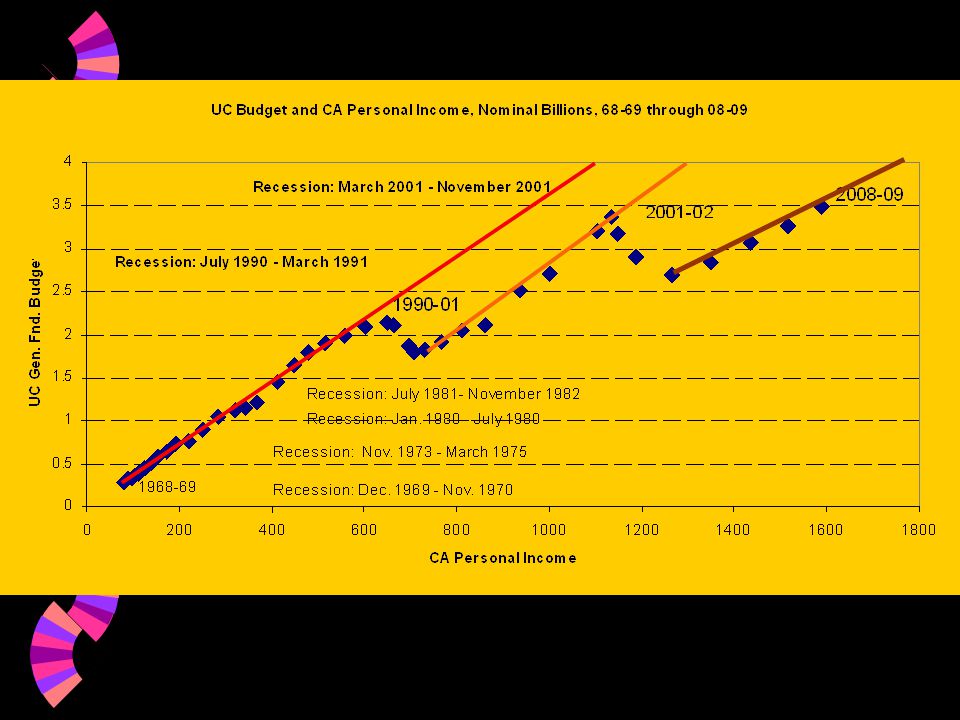
UC Budget From CA General Fund 1968-69 2000-01

12
UC Budget from CA General Fund Arnie Davis

19
18

22
21 1968-69 2010-11

24
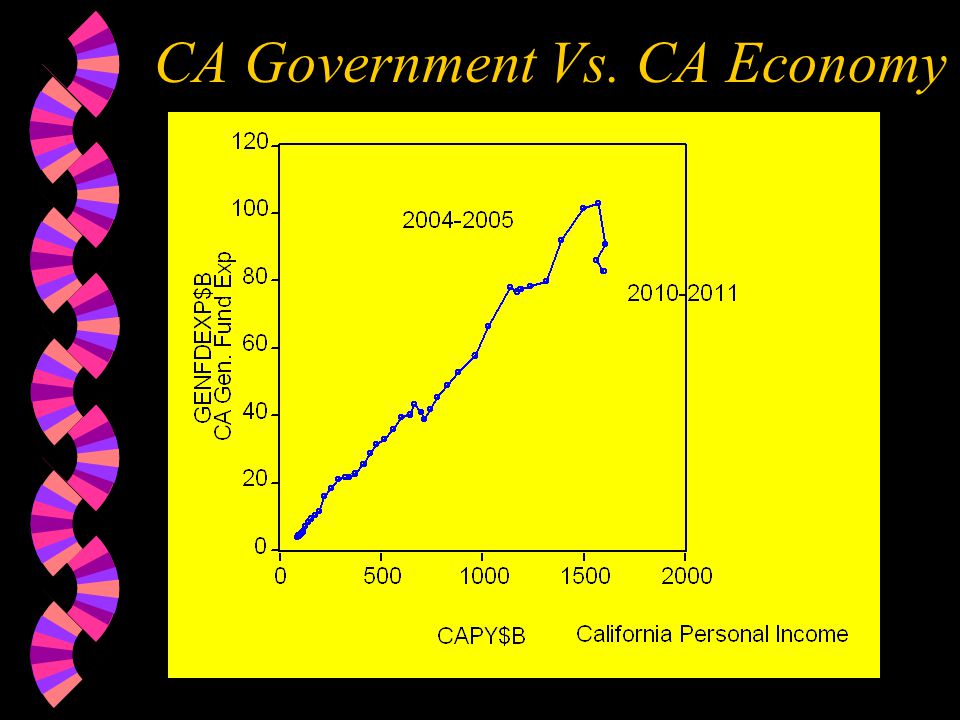
CA Government Vs. CA Economy

27
26 Outline w UCR Offenses Per Capita by State w The Meth Epidemic w Crime in California

28
UCR Offenses Per Capita By State w Crime Generation: OF = f(CR,SV, SE, MC) w OFPC = (PRPC, SE,MC), i.e offenses per capita varies with prisoners per capita, causal variables and moral compliance w SE: causal variables Human capital: % of students above basic grade 4 reading, deaths per 100,000 from heart disease,% of children below poverty w MC moral compliance % catholic, % weekly church attendance 27
 w OFPC = (PRPC, SE,MC), i.e offenses per capita varies with prisoners per capita, causal variables and moral compliance w SE: causal variables Human capital: % of students above basic grade 4 reading, deaths per 100,000 from heart disease,% of children below poverty w MC moral compliance % catholic, % weekly church attendance 27")
29
28 No control Bad Health (low human capital) decreases crime
 decreases crime")
30
29

31
30 No Control Education Reduces crime Moral compliance ditto Less Poverty ditto Health insignificant

32
31 Expenditures Per Capita UCR Offenses Per Capita CCT Income Education Moral Compliance Less poverty

33
32 Front Line: The Meth Epidemic w http://www.pbs.org Assignment for class http://www.pbs.org w 1.5 million addicts in the US Worldwide more addicts than for horse and coke, combined w Different than heroin and cocaine No natural supply Synthetic 9 factories in the world manufacture pseudoephedrin w Could focus on Supply Limit availability of pseudoephedrin Roadblock: pharmaceutical lobby

34
33 50 % of children In Oregon are there Because of meth- Addicted parents

35
34

36
35 Prison Building since 80’s: Some Ideas w Death Penalty Controversy in the 70’s Was death penalty effective? Was death penalty moral? w Ignoring incentives Expected cost of punishment deters everybody Detention only controls those you catch w The law of unforeseen consequences Relying on detention means the gulag w The power of ideas The “Constancy of Imprisonment” hypothesis The “Serious Offender”

37
36 Four Periods: #1 1930-1983 except WWII, constancy # 2 WWII #3 1984-1998, expansion #4 1999-

38
37 Crime in California w Causality and Control w Corrections: Dynamics and Economics w Correctional Bureaucracy

39
1952-2004
40
39 Use the California Experience w Crime rates Have Fallen. Why Haven’t Imprisonment rates? w Apply the conceptual tools developed prior to the midterm Criminal justice system schematic crime control technology

41
Crime Generation Crime Control Offense Rate Per Capita Expected Cost of Punishment Schematic of the Criminal Justice System: Coordinating CJS Causes ?!! (detention, deterrence) Expenditures Weak Link “The Driving Force”
 Expenditures Weak Link The Driving Force .")
42
41 What are the facts? w Expenditures per capita on the CA criminal justice system

43
42

44
43

45
44 What are the facts? w Expenditures per capita on the CA criminal justice system Expenditures per capita in real $ are rising steadily The big ticket items are enforcement and corrections w Offenses per capita

46
45 Trends In Crime in California Source: Crime and Delinquency in California, 2002 http://caag.state.ca.us/ Social Welfare Lecture (#1 LP) Growth level 19801992 1952
 Growth level")
47
46 Crime in California 2007

48
47 Homicide in California 2007

49
48 What are the facts? w Offense rates per capita rose rapidly until 1980 w Leveled off in the 1980’s w Declined in the nineties w Are relatively stable in this decade

50
49

51
50 Can we identify the causes? w The factors that cause crime might have been getting better in the latter 90’s

52
51 Crime Generation Crime Control Offense Rate Per Capita Expected Cost of Punishment Schematic of the Criminal Justice System; Death Penalty Causes ? (detention, deterrence) Expenditures Weak Link Variable, up & down Steady increase
 Expenditures Weak Link Variable, up & down Steady increase.")
53
52 Crime Generation Crime Control Offense Rate Per Capita Expected Cost of Punishment Schematic of the Criminal Justice System; Jobs and Crime Causes ?:Economic Conditions (detention, deterrence) Expenditures Weak Link
 Expenditures Weak Link")
54
53

55
54

56
55 Note: w The misery index bottoms out in 1998 and the crime rate bottoms out in 1999 w There is visual evidence that there may be a connection

57
Jobs and Crime

58
57 2002 1952 1980 1954 Jobs and Crime Lec #2 LP

59
Jobs and Crime

60
59 What are the facts? w Control variables Imprisonment as a measure of detention and deterrence

61
Crime Generation Crime Control Offense Rate Per Capita Expected Cost of Punishment Schematic of the Criminal Justice System: Coordinating CJS Causes ?!! (detention, deterrence) Expenditures Weak Link “The Driving Force”
 Expenditures Weak Link The Driving Force .")
62
61

63
62 The number of prisoners per capita is leveling off w Is this why the crime rate is turning up?

64
63

65
64 Note w When prisoners per capita was flat, offenses per capita was growing w When prisoners per capita started growing, offenses per capita leveled off and then declined

66
65

67
66 What is Affecting Crime Rates? w Economic Conditions? w Imprisonment Rates? w Both?

68
67 Model Schematic Crime Generation: California Index Offenses Per Capita Causality: California Misery Index Crime Control: California Prisoners Per Capita

69
68 CA Crime Index Per Capita (t) = 0.037 + 0.00036*Misery Index (t) – 3.60*Prisoners Per Capita (t) + e(t) where e(t) = 0.95*e(t-1)
 = *Misery Index (t) – 3.60*Prisoners Per Capita (t) + e(t) where e(t) = 0.95*e(t-1)")
70
69 Ln CA Crime Index Per Capita (t) = -5.35 + 0.17*ln Misery Index (t) -0.23 ln Prisoners Per capita (t) +e(t) where e(t) = 0.93 e(t-1)
 = *ln Misery Index (t) ln Prisoners Per capita (t) +e(t) where e(t) = 0.93 e(t-1)")
71
70 California Forecasts w Using the Fitted Model to Forecast Year CA Crime Index Per Capita 120050.018812 220060.018247 320070.017193 420080.018947 520090.019276

72
71

73
72

74
73

75
Institutional Population Projections 74 2008

76
75

77
76 California Department of Corrections: Institutional Population http://www.cdc.state.ca.us/reports/populatn.htm

78
77 Crime in California w Causality and Control wCwCorrections: Dynamics and Economics

79
78 Prison Dynamics and Economics w Admissions * mean years served = prisoners

80
79 Relationships Between Stocks and Flows: Coordinating CJS w In equilibrium: Inflow = Outflow w The outflow is proportional to the stock Outflow = k * Stock constant of proportionality, k, equals one divided by mean time served –Admits * mean years served = stock of prisoners

81
80 The Stock of Prisoners InflowOutflow Stock of Prisoners New Admissions from Court Released to Parole Coordinating CJS

82
81 45 degrees Constraint: Admits per year*Average years served = Prisoners Average Years Served Admits per Year Coordinating CJS

83
82 California Department of Corrections: Total Felon Admissions http://www.cdc.state.ca.us/reports/populatn.htm

84
83

85
84 Prison Realities w We can not build prisons fast enough to increase capacity soon enough w The public wants more convicts sent to prison w But prisons are full w So, what happens?

86
85 Consequence w Release violent offenders w Innocent children are kidnapped, raped and murdered: example-Polly Klass

87
86 Consequence w Polly’s father campaigns for three strikes law

88
87 Consequence w More convicts are sent to prison

89
88

90
89 Capital constraint: Coordinating CJS w admits per capita per year * average years served = prisoners per capita w Prisoners per capita is limited by prison capacity w If you increase admits per capita per year, then average years served decreases until prison capacity catches up

91
90 Prison Dynamics and Economics wAwAdmissions * mean years served = prisoners Dynamics wPwProduction Possibility Frontier Economics

92
91 Abstraction (Model) of the Criminal Justice System Enforcement Prosecution Defense Courts State Prisons New Admits Mean Years Served
 of the Criminal Justice System Enforcement Prosecution Defense Courts State Prisons New Admits Mean Years Served")
93
92 Admits per Year per capita average years served Tradeoff Between Criminal Justice System Outputs tan = admits per year per capita/average years served

94
93 Resource constraint w expenditure per capita on CJS = expenditure per capita on enforcement, prosecution, and adjudication plus expenditure per capita on corrections w admits per year per capita depends on expenditures per capita on enforcement, etc. w average years served depends on expenditures per capita on corrections

95
Admits per Capita Expenditures per capita on Enforcement Average Years Served Expenditures per capita on Corrections production function production function Expenditures per capita on Corrections Expenditures per capita on Enforcement Total Expenditures per capita on Criminal Justice System

96
Total Expenditure per capita on CJScapita on CJS Expenditures per capita, Corrections Expenditures per capita, Enforcement Admits per capita Average Years Served Production Function

97
96 Abstraction (Model) of the Criminal Justice System Enforcement Prosecution Defense Courts State Prisons New Admits Mean Years Served
 of the Criminal Justice System Enforcement Prosecution Defense Courts State Prisons New Admits Mean Years Served")
98
Total Expenditure per capita on CJScapita on CJS Expenditures per capita, Corrections Expenditures per capita, Enforcement Admits per capita Average Years Served Production Function

99
98 Admits per Year per capita, AD average years served, S A Shifting Mix In Criminal Justice System Outputs tan = admits per year per capita/average years served Facts 1. spend more 2. Admit more 3. shorter time served Prison Capacity Constraint

100
1952 1986 1994 1975
101
100 Crime in California w Causality and Control wCwCorrections: Dynamics and Economics wCwCorrectional Bureaucracy

102
101 California Corrections Bureaucracy w Prisoner and Parole Populations Stocks w Felon New Admissions From Court Inflow to Prison w Prisoners Released to Parole Outflow from Prison/Inflow to Parole w Parole Violators Outflow from Parole w Discharges from Parole and Deaths Outflow from Parole

103
California Department of Corrections 1996 Prisoners 145,565 Parolees 100,935 Felon New Admits 46,487 Releases to Parole 111,532 Discharged and Died 27,691 57,984 Parole Violators Returned to Custody Parole Violators With a New Term 17,525 Parolees At Large 18,034 Discharged and Died 3,984 Absconded 29,376

104
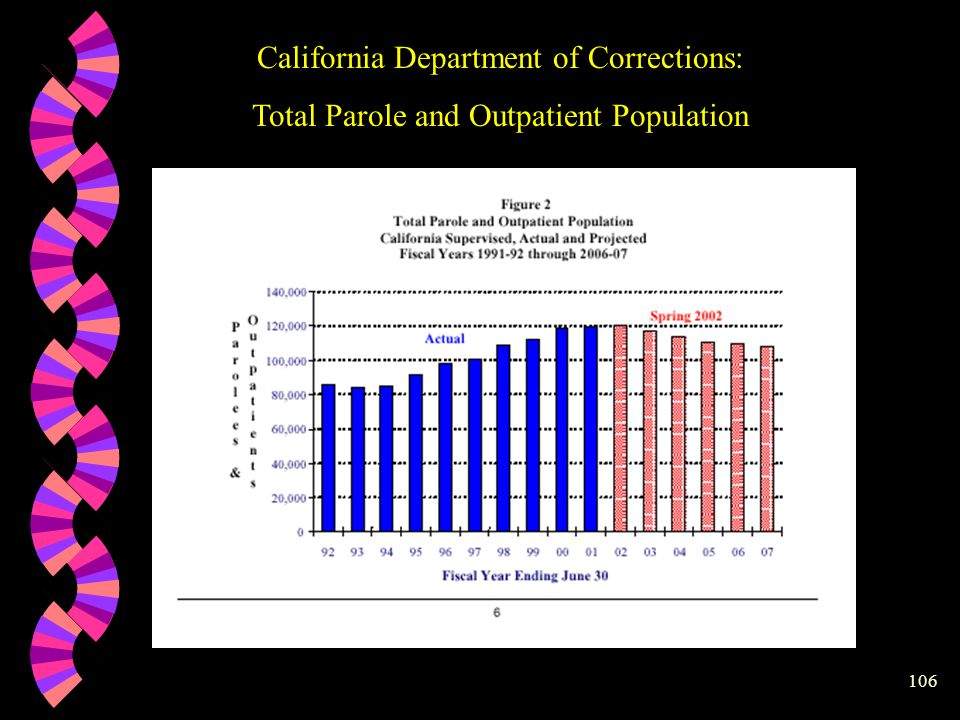
103 Correctional Trends in California: Custodial Populations w Prisoners Per Capita Institutional Population Felons Civil Narcotics Addicts w Parolees Per Capita Parole and Outpatient Population Supervised in California

105
104

107
106 California Department of Corrections: Total Parole and Outpatient Population

109
108 Correctional Trends in California: Inflows to Prison w Felon New Admissions from Court w Parole Violators Returned to Custody w Parole Violators With a New Term

111
110 “Charlie on the MTA” w http://www.google.com http://www.google.com Song: “Charlie on the MTA” w www.youtube.com/watch?v=HXgo2GTKPEg www.youtube.com/watch?v=HXgo2GTKPEg w http://www.youtube.com/watch?v=3VMSGrY- IlU http://www.youtube.com/watch?v=3VMSGrY- IlU w www.youtube.com/watch?v=HXgo2GTKPEg www.youtube.com/watch?v=HXgo2GTKPEg

112
111

113
California Department of Corrections 1996 Prisoners 145,565 Parolees 100,935 Felon New Admits 46,487 Releases to Parole 111,532 Discharged and Died 27,691 57,984 Parole Violators Returned to Custody Parole Violators With a New Term 17,525 Parolees At Large 18,034 Discharged and Died 3,984 Absconded 29,376

114
113 Two Policy Issues w Composition of New Admissions from Court w Large Volume of Parole Violators Returned to Prison

115
114

116
115

117
116

118
117 CA Department of Corrections Projections

119
118 CA Department of Corrections Projections

120
119

121
120 CA Crime Rate Forecast 2006, 2007

122
121

123
122

124
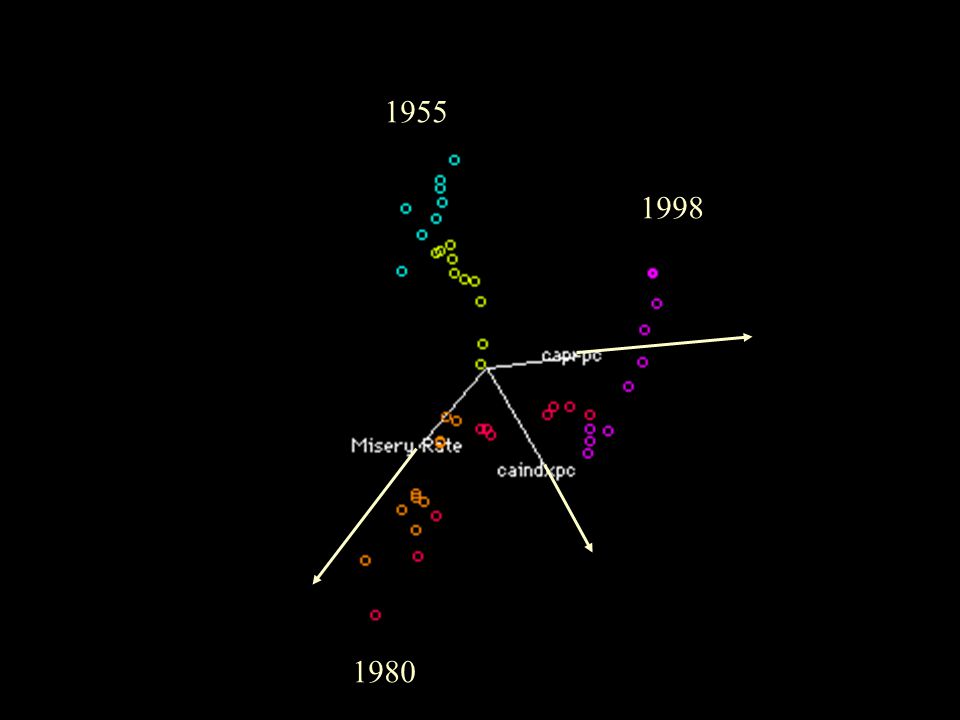
1955 1998 1980
125
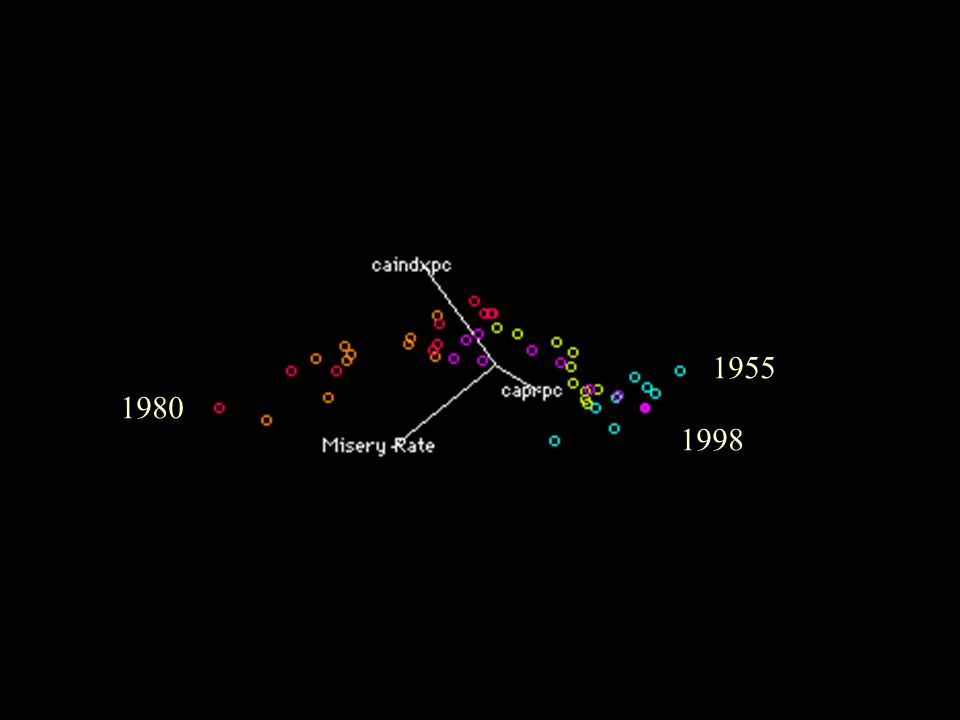
1955 1998 1980
126
1955 1980 1998

127
126

129
128 Forecasting Prisoners Per Capita w Model Schematic Close the loop: 2-way causality

130
129 Causal Model Forecasts: OF Unemployment rate inflation rate, prisoners per capita * Forecasts from Economic Forecasts, 2001-, www.dof.ca.gov # Forecasts from California Department of Corrections

131
130

132
131

133
132 Model Schematic Crime Generation: California Index Offenses Per Capita Causality: California Misery Index Causality: Time Trend Crime Control: California Prisoners Per Capita

134
133 Model Schematic Crime Generation: California Index Offenses Per Capita Causality: California Misery Index Crime Control: California Prisoners Per Capita

135
134

136
135

137
136 Brain scan study At UCLA Effect on The body

138
137

139
138

Similar presentations


 F Practical:>")


 Isolating Deterrence.>")