Download presentation
Presentation is loading. Please wait.

1
1 The Economics of Crime and Justice Johnny Cash at Folsom Prison, 1968

2
2 Topics Prisons in America Prisons in America Correctional Bureaucracy in CA Correctional Bureaucracy in CA The Serious Offender/Career Criminal The Serious Offender/Career Criminal Terrorism: A Preview Terrorism: A Preview

3
3 Bureaucracy: Readings Albert Hirshman, Exit, Voice and Loyalty Albert Hirshman, Exit, Voice and Loyalty exit: voting with your feet voice: political action Anthony Downs, Inside Bureaucracy Anthony Downs, Inside Bureaucracy survival of the bureaucrat

4
4

5
5 Prisons in America Are we the land of the free and the home of the brave? Are we the land of the free and the home of the brave? Are we the gulag? Are we the gulag? Or both? Or both?

6
6 Likelihood of Going to Prison in a Lifetime 1/4 1/6 1/23 1/10 For Newborn Prevalence of Imprisonment in the U. S. Population, 1974-01 Source:

7
7 Imprisonment Rates Per 100/000 http://virlib.ncjrs.org/Corrections.asp

8
8

9
9

10
10 12 % Current/Total 25% 1.3 million in prison; 4.3 million out but formerly in

11
11

12
12

13
13

14
14 2.7% of Adults have been in prison, one time or another

15
15 And the % is projected to rise

16
16 If born in 2001, chances or ever going to prison 6.6%

17
17 If born a black male in 2001, lifetime chance is 32.2%, 1/3

18
18 Growth rates in State and Federal Prisoners, 1995-2002 Prisoners in 2002 Source

19
19 Comparative International Rates of Incarceration 1980

20
20 The U.S. Incarceration Rate is Higher than for Russia, and South Africa; 7 times Italy and 8 times France

21
21 CA Criminal Justice: examples Albert Hirschman, Exit, Voice, and Loyalty Exit: choosing to live in a gated community Exit: choosing to live in a gated community Voice: lobbying for per se laws for DUI Voice: lobbying for per se laws for DUI Voice: lobbying for victims’ rights bills and ballot initiatives Voice: lobbying for victims’ rights bills and ballot initiatives

22
22 No Czar for CA CJS Offenses per Capita $ Expenditures Per Capita Crime Control Technology Control Costs + Damages to Victims optimum High Cost Inefficiency

23
23 No Czar for CJS Offenses increase, public demands safety Offenses increase, public demands safety Elected officials can increase police faster than they can build prisons Elected officials can increase police faster than they can build prisons Arrests rise, courts clog Arrests rise, courts clog prison capacity rises prison capacity rises number of parolees rises number of parolees rises

26
26 Corrections Function Probation Departments Probation Departments Jails Jails city and county Youth Authority Youth Authority California State Department of Corrections California State Department of Corrections prisons

27
State Department of Corrections as a Proportion of California Corrections. 0% 20% 40% 60% 80% 100% 73-7475-7677-7879-8081-8283-8485-8687-8889-9091-92 Fiscal Year Share Cities and Counties, CYA Dept. of Corrections

28
28 Slide 38

29
29 California Corrections Bureaucracy Prisoner and Parole Populations Prisoner and Parole Populations Stocks Felon New Admissions From Court Felon New Admissions From Court Inflow to Prison Prisoners Released to Parole Prisoners Released to Parole Outflow from Prison/Inflow to Parole Parole Violators Parole Violators Outflow from Parole Discharges from Parole and Deaths Discharges from Parole and Deaths Outflow from Parole

30
California Department of Corrections 1996 Prisoners 145,565 Parolees 100,935 Felon New Admits 46,487 Releases to Parole 111,532 Discharged and Died 27,691 57,984 Parole Violators Returned to Custody Parole Violators With a New Term 17,525 Parolees At Large 18,034 Discharged and Died 3,984 Absconded 29,376

31
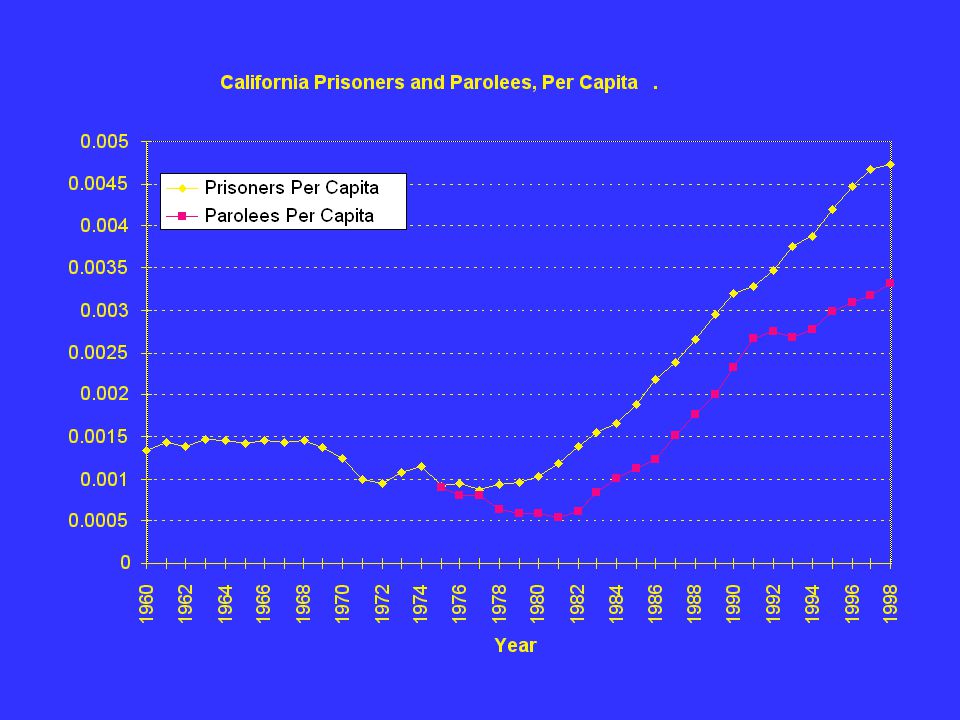
31 Correctional Trends in California: Custodial Populations Prisoners Per Capita Prisoners Per Capita Institutional Population Felons Civil Narcotics Addicts Parolees Per Capita Parolees Per Capita Parole and Outpatient Population Supervised in California

33
33 California Department of Corrections: Total Parole and Outpatient Population

35
35 Correctional Trends in California: Inflows to Prison Felon New Admissions from Court Felon New Admissions from Court Parole Violators Returned to Custody Parole Violators Returned to Custody Parole Violators With a New Term Parole Violators With a New Term

37
37 Two Policy Issues Composition of New Admissions from Court Composition of New Admissions from Court Large Volume of Parole Violators Returned to Prison Large Volume of Parole Violators Returned to Prison

38
38

39
39

40
40

41
41 SERIOUSNESS SURVEY (and months served in prison) RATE THE SERIOUSNESS OF EACH OF THE FOLLOWING BEHAVIORS ON A SCALE FROM ZERO( LEAST SERIOUS) TO TEN( MOST SERIOUS): MEAN 1. HOMICIDE _9.7__36 2. MASS POISONING ( e.g. TYLENOL) _8.3__ 3. FORCIBLE RAPE _9.4__66 4. ARSON: SET FIRE TO A GARAGE _7.8__ 5. SELLING HEROIN _6.2__ 6. AUTO THEFT _5.7__17 7. EMBEZZLEMENT OF $1,000 _4.6__ 8. PROSTITUTE IN A HOUSE OF PROSTITUTION _3.5__ 9. POSSESSION OF MARIJUANA _2.3__13 10. SNIFFING GLUE _2.0__
 _8.3__ 3. FORCIBLE RAPE _9.4__66 4. ARSON: SET FIRE TO A GARAGE _7.8__ 5. SELLING HEROIN _6.2__ 6. AUTO THEFT _5.7__17 7. EMBEZZLEMENT OF $1,000 _4.6__ 8. PROSTITUTE IN A HOUSE OF PROSTITUTION _3.5__ 9. POSSESSION OF MARIJUANA _2.3__ SNIFFING GLUE _2.0__.")
42
42 At Least Two Inefficiencies Using scarce prison space for less serious drug offenders Using scarce prison space for less serious drug offenders using scarce prison space for recycled parolees returned to custody ( drug test violators) using scarce prison space for recycled parolees returned to custody ( drug test violators) Consequence: composition of prisoners rises for drug offenders and falls for violent offenders Consequence: composition of prisoners rises for drug offenders and falls for violent offenders
 using scarce prison space for recycled parolees returned to custody ( drug test violators) Consequence: composition of prisoners rises for drug offenders and falls for violent offenders Consequence: composition of prisoners rises for drug offenders and falls for violent offenders")
43
43

44
44 Citizen Reaction to Release of Violent Offenders Voice: Three Strikes Law Voice: Three Strikes Law Polly Klass abduction and murder by a released violent offender

45
45

46
46 Part II. The Serious Offender (the power of ideas) Theoretical Justification for Detention Policy Theoretical Justification for Detention Policy
 Theoretical Justification for Detention Policy Theoretical Justification for Detention Policy.")
47
47 Part II The Serious Offender The Serious Offender a few serious criminals account for most crimes if free, each serious offender would commit crimes at the rate of per year if there are N serious offenders, they would commit *N offenses per year, if free if there are PR serious offenders in prison, then we save *PR offenses per year the net observed offenses per year is: OF = *N - *PR = (N -AD*S)
")
48
48 Population Serious Offenders, N Prisoners, PR

49
49 Population Serious Offenders, N Prisoners, PR If the Serious Offender Population grows faster than the Prison Population then crime gets worse

50
50 Population Serious Offenders, N Prisoners, PR If the Prison Population grows faster than the Serious Offender Population then crime gets better

51
51 Thinking About the Serious Offender Visually: subpopulations Visually: subpopulations Stocks and Flows Stocks and Flows Transitions Transitions

52
52 Mean Time Served: One Year Relations Between Stocks and Flows InflowOutflow Stock, Dec 31 100 Prisoners Jan 1, year one 100 Admits Jan 1, year two 100 releases In equilibrium: inflow = outflow Jan 1, year two 100 Admits Jan 1, year three 100 releases outflow is proportional to the stock: 100 = 1* 100

53
53 Mean Time Served: Two Years Relations Between Stocks and Flows InflowOutflow Stock Jan 1, year one 100 Admits Jan 1, year two 0 releases Jan 1, year two 100 Admits Dec 31, year one 100 prisoners Dec 31, year two 200 prisoners Jan 1, year three 100 releases Jan 1, year three 100 Admits In equilibrium: inflow = outflow outflow is proportional to the stock: 100 = 1/2* 200

54
P. 96, Lecture 6 Notes.

55
55 Illustrative Example Suppose for a career criminal, time committing crime = time behind bars, Suppose for a career criminal, time committing crime = time behind bars, 1/( q J) = s s is time behind bars, e.g 2 years and is offenses per year, e. g. 30 per year q is probability of being arrested and convicted per offense, J is the probability of imprisonment if convicted, e.g. 2/3 then q = 1/40 per offense, and q = 3/4 per year and q J, the probability of arrest, conviction and imprisonment is 1/2

56
P. 96, Lecture 6 Notes. 1/2

57
57

58
58

59
59 128-A8 120-127A-11 113-119B+10 106-112B11 97-105B-13 88-96C+12 76-87C5 64-75C-8 52-63D+1 40-51D0 -39D-1 0F3

60
60 Terrorism in the USA Home grown Home grown Foreign imports Foreign imports Remedies Remedies

61
61 Learning from History Skyjacking in the USA Skyjacking in the USA first in the USA was 1961

62
62 Learning from Economics Thwarting embezzlement Thwarting embezzlement inspection, I. E. audit

63
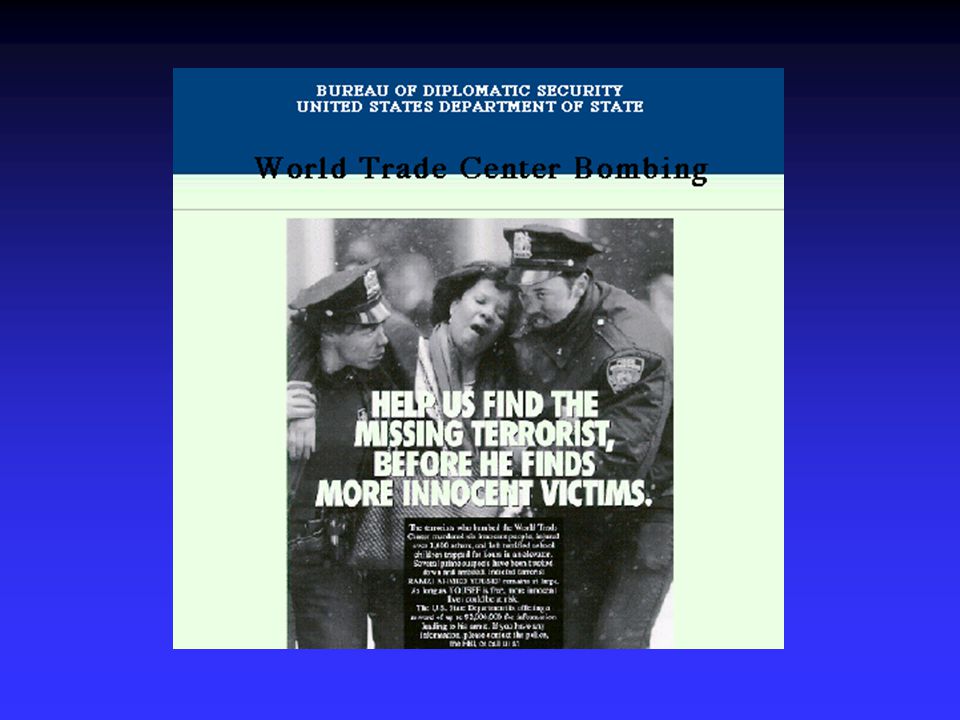
Recent History of US Terrorism Post 9-11 Post 9-11 Cabinet position for Homeland Security Pre 9-11 Pre 9-11 Bombings Bombings World Trade Center, New York Murtaugh Federal Building, Oklahoma City Black Churches Skyjackings Skyjackings

64
64

65
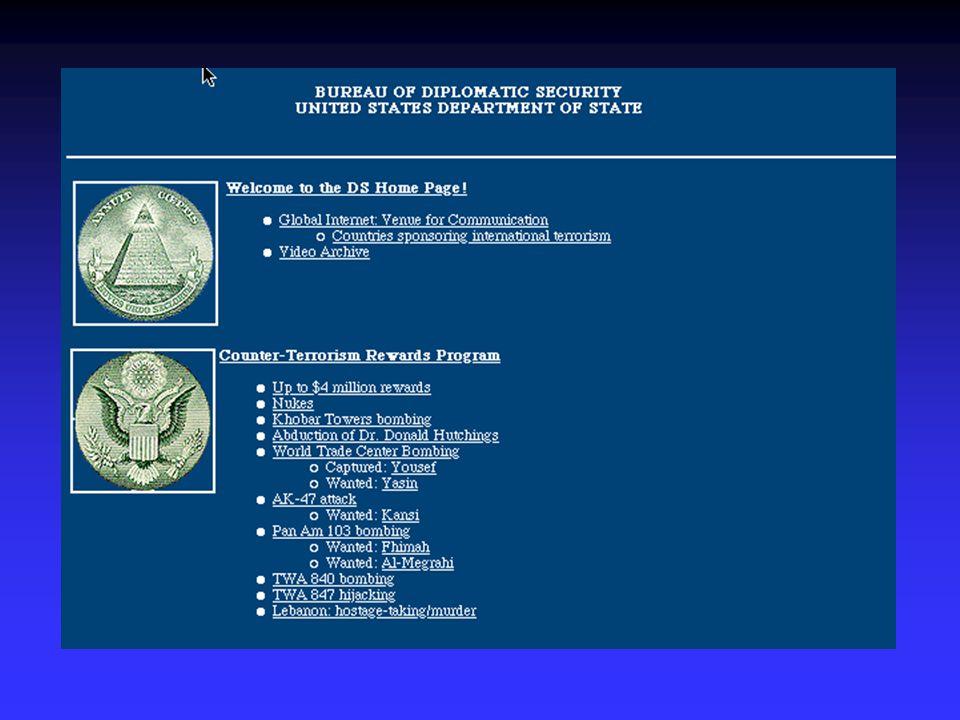
65 http://www.state.gov Office of the Coordinator for Counter-Terrorism Patterns of Global Terrorism

66
66

67
67

68
68

69
69

72
Reward: $2,000,000

73
73

74
74

76
76 ARA: InterAmerica AF: Africa EAP: East Asia and the Pacific EUR: Europe NESA: Near East and South Asia

77
77

78
78 Americas

79
79

80
80 Europe

81
81

82
82 Skyjackings The first skyjacking was a Peruvian carrier in February 1931 The first skyjacking was a Peruvian carrier in February 1931 The first skyjacking of a US carrier was a National Airlines flight destined for Key West Florida on May 1, 1961 The first skyjacking of a US carrier was a National Airlines flight destined for Key West Florida on May 1, 1961

Similar presentations