Download presentation
Presentation is loading. Please wait.

1
Ground Motion Prediction Equations for Eastern North America Gail M. Atkinson, UWO David M. Boore, USGS (BSSA, 2006)
.")
2
Atkinson and Boore 2006 ENA relations Based on stochastic finite-fault model (of Motazedian and Atkinson, 2005) Key source parameter is stress drop – determined from compilation of instrumental and historical data Attenuation model based on empirical trilinear model of Atkinson, 2004 for ENA
 Key source parameter is stress drop – determined from compilation of instrumental and historical data Attenuation model based on empirical trilinear model of Atkinson, 2004 for ENA")
3
Stochastic finite fault model (Silva; Beresnev and Atkinson; Motazedian and Atkinson, 2005) Key features: - Subsources are Brune point sources - long-period controlled by moment, short-period controlled by stress - Results independent of subfault size
 Key features: - Subsources are Brune point sources - long-period controlled by moment, short-period controlled by stress - Results independent of subfault size")
4
Parameters needed to apply stochastic finite- fault model All parameters needed for stochastic point source model: stress drop, attenuation with distance, site amplifications, physical properties Geometry of source (can assume fault plane based on empirical relations such as Wells and Coppersmith on fault length and width vs. M, in this case assumed to be 1/3 of western fault area for a given M) Direction of rupture propagation (assume random) Slip distribution on fault (assume random)
 Direction of rupture propagation (assume random) Slip distribution on fault (assume random).")
5
High-frequency spectral level depends on stress drop (as in point-source model)
")
6
ENA Model Parameters and their aleatory variability (AB06) Parameter Distribution type MedianStandard Deviation MinimumMaximum Fault DipNormal50.20.10.90. Log stressNormal2.140.31 Pulsing%Random10.90. KappaRandom0.0020.01 b1 (R<70)Random-1.3 -1.5-1.1 b2 (70-140)Random+0.2 -0.5+0.9 DepthNormal13.10.2.30. Fault length factor Random0.20.8 Fault width factor Random0.41.0
Random b2 (70-140)Random DepthNormal Fault length factor Random Fault width factor Random")
8
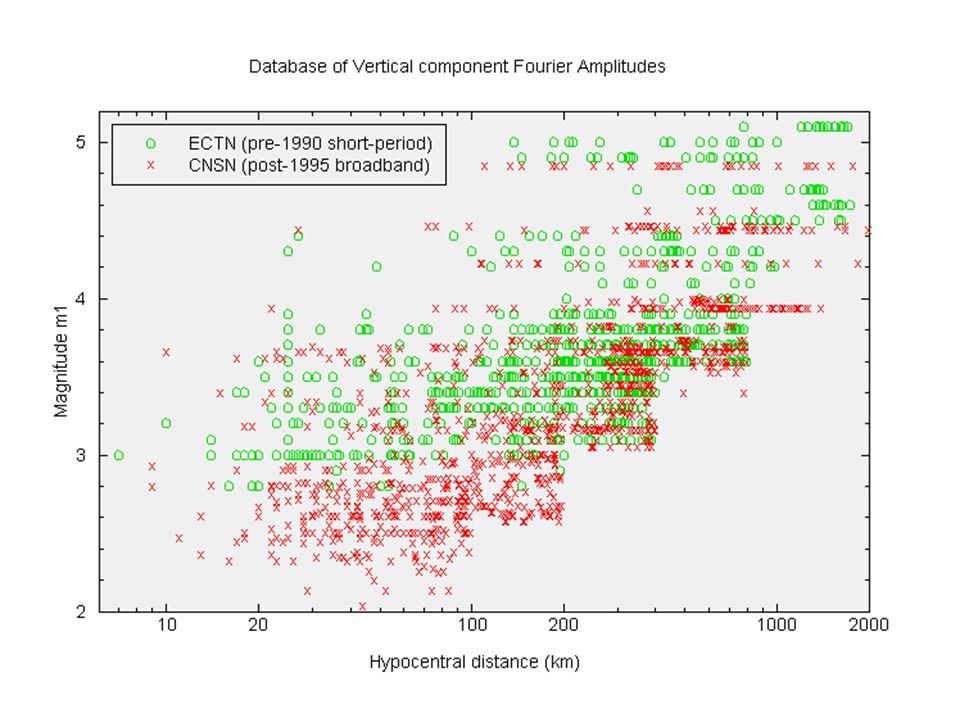
Illustration of typical decay of spectral amplitudes for m1=3.75. Line is trilinear shape fitted to the data. Transition distances are r01=70 km, ro2 = 140 km. Slopes of geometric attenuation: -1.3, +0.2, -0.5

9
Amplitudes decay faster than 1/R at R<70 km. This has important implications for ENA ground motion relations.

10
ENA stress drops, based on high- frequency spectral level. Mean = 140 bars.

11
AB06 simulations: Log values of horiz, component 5% PSA at frequencies 0.5, 1, 5 Hz, and PGA, for ENA rock sites. Dots show PSA from simulations, including aleatory uncertainty, for M 5 (light) and M 8 (dark). Solid lines show predicted amplitudes from regression equations developed from simulated database, for M5, 6, 7, 8
 and M 8 (dark). Solid lines show predicted amplitudes from regression equations developed from simulated database, for M5, 6, 7, 8.")
12
AB06 rock simulations (dark grey=mid- point M, light grey=+/- 0.5M); equations (black) ; data (M-0.5 green, M+0.5 red)
; equations (black) ; data (M-0.5 green, M+0.5 red)")
14
Comparison of AB06 eqns to M4.9 2005 Riviere du Loup data

15
Comparison of AB06 eqns to several M4.5 events

16
Comparison of equations to data for M5.8 and M7.6 Saguenay and Bhuj events – note high PGA for Saguenay, well above AB06 predictions for M5.8

17
Comparison of ground- motion equations of this study (solid red lines) for M 5.5 and 7.5, with previous predictions (Atkinson and Boore, 1995, black), and mean and standard deviation of alternative EPRI (2004) predictions (blue), all for hard-rock site conditions in ENA.
 for M 5.5 and 7.5, with previous predictions (Atkinson and Boore, 1995, black), and mean and standard deviation of alternative EPRI (2004) predictions (blue), all for hard-rock site conditions in ENA.")
18
Main epistemic uncertainty is in stress drop – our preferred average value is 140 bars, but alternative interpretations of data could be higher (200 bars?). We include factors to adjust the predictions for higher or lower stress drops.

19
AB06 ground-motion equations are given for 2 site conditions Base condition for development and comparison to ENA data is hard-rock (vs30>2000 m/s) We also perform the same set of simulations for B/C boundary site conditions, for an assumed B/C profile (from Frankel et al., 1996) Separate sets of equation coefficients for each set of simulations
 We also perform the same set of simulations for B/C boundary site conditions, for an assumed B/C profile (from Frankel et al., 1996) Separate sets of equation coefficients for each set of simulations")
20
AB06 predictions for BC for ENA vs. BA07 active regions - note plotting error in AB06 (rock vs. B/C)
.")
21
Conclusions New ground motion relations for ENA, based on a stochastic finite fault model Results in good agreement with ENA ground motion data Factors given to adjust to all site conditions, based on empirical non-linear amplification studies in California Factors given to adjust for alternative stress drop values

22
Significant Issues Limited M > 4 ground motion database Vertical vs. horizontal ground motion Stress drop of ENA source spectrum Near-source geometrical attenuation Kappa of NEHRP B-C site profile

Similar presentations


 USING COMPONENT ATTENUATION MODELLING TECHNIQUE By DR. SAROSH.H. LODI.>")


>")


 –Ground Motion Parameters: Horizontal components (Ave Horiz, FN, and FP) PGA, PGV, PGD Pseudo.>")


