Download presentation
Presentation is loading. Please wait.

1
Need for an accurate Reno velocity model to understand amplification in the Reno Basin Aasha Pancha

2
Reno Area Basin ANSS stations: installed1989 - 2003

3
Reno Area Basin Abbott and Louie (2000)
")
4
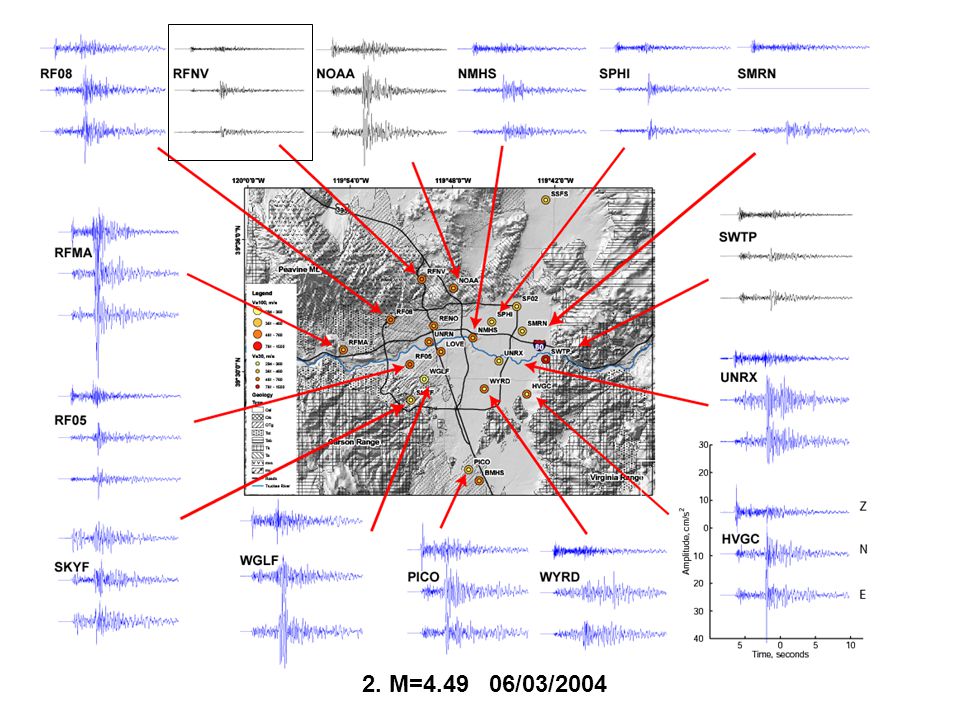
1. M=4.4 12/02/2000 2. M=4.49 06/03/2004

5
1. M=4.4 12/02/2000

6
Reno Area Basin Abbott and Louie (2000)
")
7
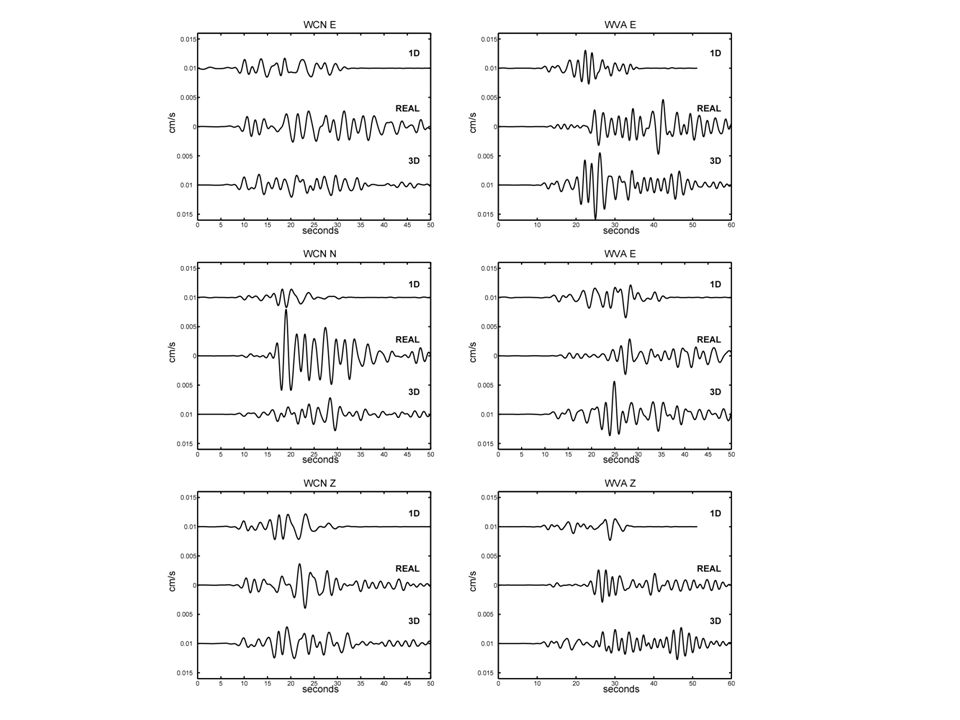
1D synthetic Green's functions, computed in a layered elastic solid using the generalized reflection and transmission coefficients (Luco and Apsel, 1983; Zeng & Anderson, 1995). E3D – fourth order, 3D staggered grid elastic finite difference code (Larsen & Schultz [5]; Larsen & Grieger [6]). 0.2 to 0.6 Hz frequency band. Compare these simulations with the observed data
. 0.2 to 0.6 Hz frequency band. Compare these simulations with the observed data.")
8
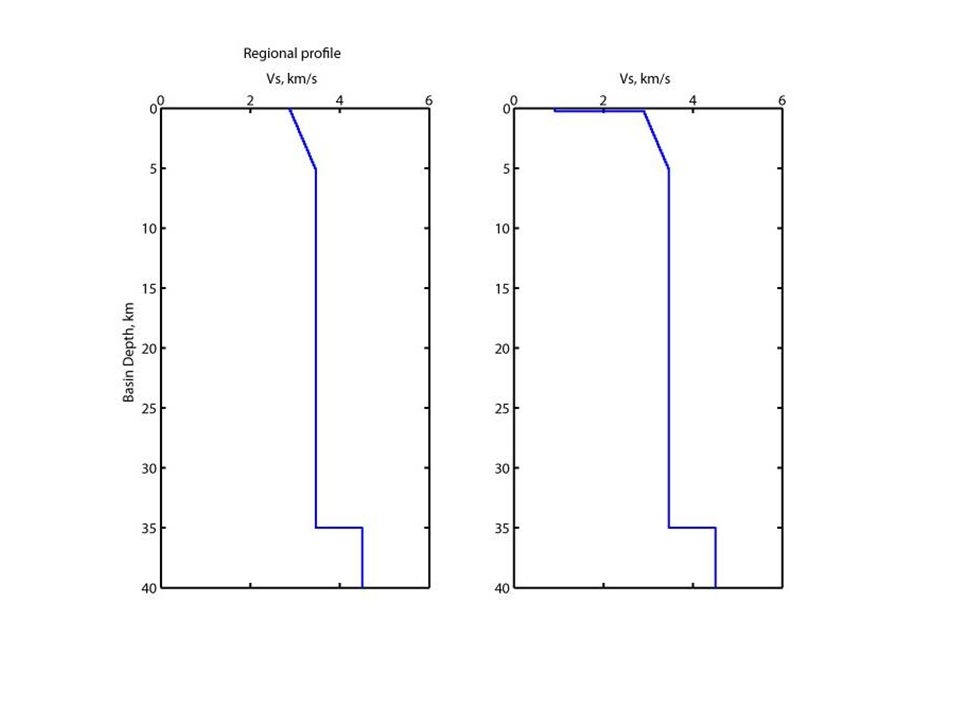
Velocity Model = MA 0.25 km grid

10
RFNV RFMA SKYF

11
SKYF RFMA SF02 RFNV

12
1. M=4.4 12/02/2000 2. M=4.49 06/03/2004

14
Earthquake Locations

16
Spatial Variation

17
Insignificant correlation with basin depth Correlation is significant at the 68% confidence level.

18
Basin Depth vs Travel Time Residuals Correlation is significant at the 98% confidence level.

19
Travel time residuals vs Fourier spectral amplification Correlation is significant at the 90% confidence level.

20
Correlation with Vs30 and Vs100 Vs100 (98%) Vs30 (94%)
 Vs30 (94%)")
21
Earthquake Locations

22
Azimuthal dependence

23
X X X X X X

24
Blue = soil to rock (SR) horizontal spectral ratios. Red = soil to rock (SRv) spectral ratios of the vertical components of motion. Black = horizontal to vertical spectral ratios (HVSR) for individual stations. The black dashed = ratio the SR and SRv mean response spectra.
 spectral ratios of the vertical components of motion. Black = horizontal to vertical spectral ratios (HVSR) for individual stations. The black dashed = ratio the SR and SRv mean response spectra..")
27
RF10/RFNZ E N Z

28
SF02 E N Z

29
RF11/RFMA E N Z

30
RF07/SKYF E N Z

31
Summary Good agreement is observed between the amplitudes of the data, and that of the 3D simulation. E3D matches the durations in the data and may anticipate some of the later arrivals. The 1D code does not. 3D basin effects are important and a 3D model is required to model ground motion within the Reno area basin. Need for refinement on the velocity and basin structural model.

32
ID Parameters Mo = 5.17E+22 dyne-cm Calculated: Area = 0.894 km Rise time = 0.69 seconds Slip = 6.3 cm E3D Parameters Grid spacing = 0.25 km 77 by 99 km down to depth of 40 km Rise time 0.7 seconds Gaussian STF to = 0.5 seconds Depth 11 km dt = 0.015, t=4800 72 seconds

33
1. M=4.4 12/02/2000 0.2 to 0.6 Hz

34
Reno Area Basin Abbott and Louie (2000)ANSS stations:1989-2003
ANSS stations:")
36
Correlation with Vs30 and Vs100 Vs100 (98%) Vs30 (94%)
 Vs30 (94%)")
37
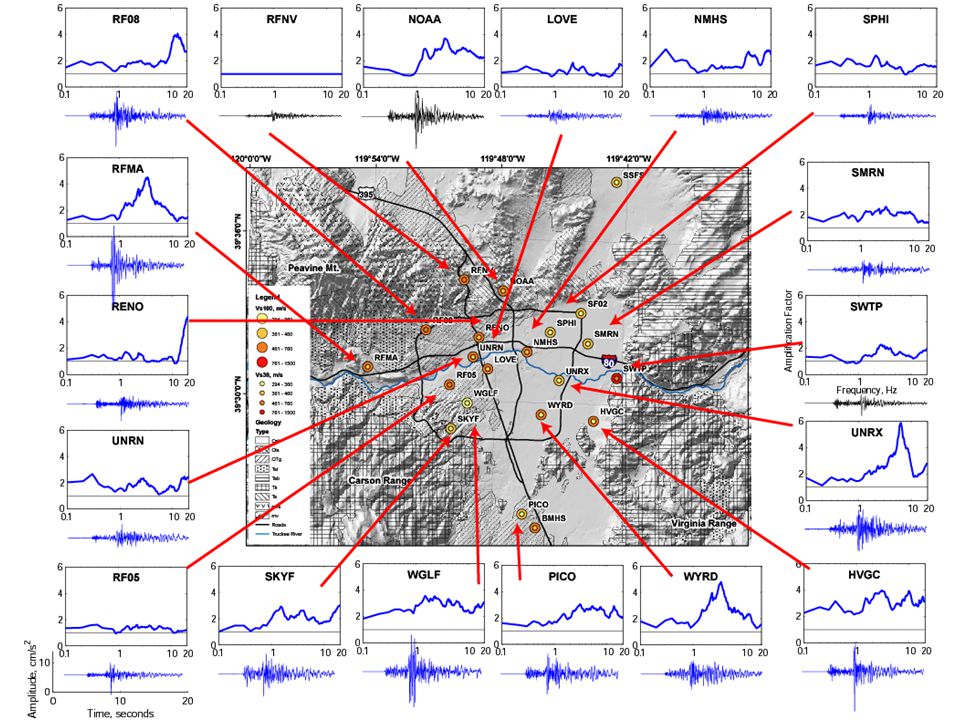
Spectral Amplification

40
NGA models Campbell and Bozorognia (thin dashed line); Choi and Youngs (thin line); Boore and Atkinson (dashed-dot line)
; Choi and Youngs (thin line); Boore and Atkinson (dashed-dot line)")
Similar presentations


 USING COMPONENT ATTENUATION MODELLING TECHNIQUE By DR. SAROSH.H. LODI.>")


>")


>")


