Download presentation
Presentation is loading. Please wait.

1
Creating Actionable Data for Schools, Part I, Plus August 26 and 29, 2011 Dr. Yuwadee Wongbundhit Curriculum and Instruction

2
Topics

3
You... 3

4
4

5
5 http://osi.dadeschools.net/actiondata

6
Monitoring Tool for FCAT 2.0 Content Assessed Benchmark By Reporting Category http://Curriculum.dadeschools.net Reading Grade 3 Grade 4 Grade 5 Mathematics Grade 3 Grade 4 Grade 5 Science Grade 5 Click on a subject/grade button below to go to that specific sheet. Monitoring Tool for FCAT 2.0 Content Assessed Grades 3-5

7
Move or Copy Worksheet Right click on worksheet tab Select “Move or Copy Under To Book: Select the designated file Select (Move to End) Select Create a copy Click OK
 Select Create a copy Click OK")
8
Overview of FCAT 2.0 Scores Link to Understanding FCAT 2.0 Reports, Spring 2011 8

9
Sample of FCAT 2.0 Reading, Grade 4 Report 9 123456789123456789

10
2011 FCAT 2.0 Scores 10

11
FCAT 1999 FCAT 2001 FCAT 2002 FCAT 2010 FCAT 2.0 2011 Base scale of FCAT 1996 SSS Base scale of FCAT 2.0 2007 NGSSS FCAT 2.0 Equivalent Scores FCAT 2.0 2012 2011 FCAT 2.0 Scores 11 New FCAT 2.0 Scale – 2012: In January 2012, the new achievement-level cut scores for the FCAT 2.0 will be created for the FCAT 2.0 in reading (G3-10) and mathematics (G3-8). New FCAT 2.0 Scale – 2012: In January 2012, the new achievement-level cut scores for the FCAT 2.0 will be created for the FCAT 2.0 in reading (G3-10) and mathematics (G3-8).
 and mathematics (G3-8)..")
12
Equipercentile Linking Example The black and green lines represent scores on two different assessments The lines show how the raw score relates to the percentile rank A “black” score of 260 and a “green” score of 340 are both at the 50th percentile rank and are “equivalent” 12

13
Reading Content Scores 2011 FCAT 2.0 Scores (Reading) Raw Score Equivalent DSS (86 to 3008) Equivalent Achievement Level (1 to 5) Equivalent Scale Score (100 - 500) V: Vocabulary RA: Reading Application LA: Literary Analysis IR: Informational Text/Research Process V: Vocabulary RA: Reading Application LA: Literary Analysis IR: Informational Text/Research Process 13
 Raw Score Equivalent DSS (86 to 3008) Equivalent Achievement Level (1 to 5) Equivalent Scale Score ( ) V: Vocabulary RA: Reading Application LA: Literary Analysis IR: Informational Text/Research Process V: Vocabulary RA: Reading Application LA: Literary Analysis IR: Informational Text/Research Process 13")
14
Science Content Scores 2011 FCAT 2.0 Scores (Science) Raw Score Equivalent Achievement Level (1 to 5) Equivalent Scale Score (100 - 500) ES: Earth and Space Science LS: Life Science NS: Nature of Science PS: Physical Science ES: Earth and Space Science LS: Life Science NS: Nature of Science PS: Physical Science 14
 Raw Score Equivalent Achievement Level (1 to 5) Equivalent Scale Score ( ) ES: Earth and Space Science LS: Life Science NS: Nature of Science PS: Physical Science ES: Earth and Space Science LS: Life Science NS: Nature of Science PS: Physical Science 14")
15
Scale Score vs. Developmental Scale Score 100500 G4 100500 G10 863008 Developmental Scale Scores 100500 G3 Scale Score Grade 3 Grade 10

16
GradeAch. Level 1Ach. Level 2Ach. Level 3Ach. Level 4Ach. Level 5 3 100-258259-283284-331332-393394-500 4 100-274275-298299-338339-385386-500 5 100-255256-285286-330331-383384-500 6 100-264265-295296-338339-386387-500 7 100-266267-299300-343344-388389-500 8 100-270271-309310-349350-393394-500 9 100-284285-321322-353354-381382-500 10 100-286287-326327-354355-371372-500 Achievement Levels for the FCAT Reading Equivalent Scale Score

17
GradeAch. Level 1Ach. Level 2Ach. Level 3Ach. Level 4Ach. Level 5 3 100-258 (158) 259-283 (24) 284-331 (47) 332-393 (61) 394-500 (106) 4 100-274 (174) 275-298 (23) 299-338 (39) 339-385 (46) 386-500 (114) 5 100-255 (155) 256-285 (29) 286-330 (44) 331-383 (53) 384-500 (116) 6 100-264 (164) 265-295 (30) 296-338 (42) 339-386 (47) 387-500 (113) 7 100-266 (166) 267-299 (32) 300-343 (43) 344-388 (44) 389-500 (111) 8 100-270 (170) 271-309 (38) 310-349 (39) 350-393 (43) 394-500 (106) 9 100-284 (184) 285-321 (36) 322-353 (31) 354-381 (27) 382-500 (118) 10 100-286 (186) 287-326 (39) 327-354 (27) 355-371 (16) 372-500 (128) Achievement Levels for the FCAT Reading Equivalent Scale Score
 (24) (47) (61) (106) (174) (23) (39) (46) (114) (155) (29) (44) (53) (116) (164) (30) (42) (47) (113) (166) (32) (43) (44) (111) (170) (38) (39) (43) (106) (184) (36) (31) (27) (118) (186) (39) (27) (16) (128) Achievement Levels for the FCAT Reading Equivalent Scale Score.")
18
Grade Ach. Level 1 Ach. Level 2 Ach. Level 3 Ach. Level 4 Ach. Level 5 3 86-10451046-11971198-14881489-18651866-2514 4 295-13141315-14551456-16891690-19641965-2638 5 474-13411342-15091510-17611762-20582059-2713 6 539-14491450-16211622-18591860-21252126-2758 7 671-15411542-17141715-19441945-21802181-2767 8 886-16951696-18811882-20722073-22812282-2790 9 772-17711772-19711972-21452146-22972298-2943 10 844-18511852-20672068-22182219-23102311-3008 Achievement Levels for the FCAT Reading Equivalent DSS

19
Grade Ach. Level 1 Ach. Level 2 Ach. Level 3 Ach. Level 4 Ach. Level 5 3 86-1045 (959) 1046-1197 (151) 1198-1488 (290) 1489-1865 (376) 1866-2514 (648) 4 295-1314 (1019) 1315-1455 (140) 1456-1689 (233) 1690-1964 (274) 1965-2638 (673) 5 474-1341 (867) 1342-1509 (167) 1510-1761 (251) 1762-2058 (296) 2059-2713 (654) 6 539-1449 (910) 1450-1621 (171) 1622-1859 (237) 1860-2125 (265) 2126-2758 (632) 7 671-1541 (870) 1542-1714 (172) 1715-1944 (229) 1945-2180 (235) 2181-2767 (586) 8 886-1695 (809) 1696-1881 (185) 1882-2072 (190) 2073-2281 (208) 2282-2790 (508) 9 772-1771 (999) 1772-1971 (199) 1972-214 (173) 2146-2297 (151) 2298-2943 (645) 10 844-1851 (1007) 1852-2067 (215) 2068-2218 (150) 2219-2310 (91) 2311-3008 (697) Achievement Levels for the FCAT Reading Equivalent DSS
 (151) (290) (376) (648) (1019) (140) (233) (274) (673) (867) (167) (251) (296) (654) (910) (171) (237) (265) (632) (870) (172) (229) (235) (586) (809) (185) (190) (208) (508) (999) (199) (173) (151) (645) (1007) (215) (150) (91) (697) Achievement Levels for the FCAT Reading Equivalent DSS.")
20
Grade Ach. Level 1 Ach. Level 2 Ach. Level 3 Ach. Level 4 Ach. Level 5 3 86-1045 (959) 1046-1197 (152) 1198-1488 (290) 1489-1865 (376) 1866-2514 (648) 2006 Raw Scores 0-17 (0% - 38%) 18 – 23 (40% - 51%) 24 – 34 (53% - 76%) 35 – 43 (78% - 96%) 44 – 45 (98% - 100%) 4 295-1314 (1019) 1315-1455 (140) 1456-1689 (233) 1690-1964 (274) 1965-2638 (673) 2005 Raw Scores 0-23 (0% - 45%) 24 – 29 (47% - 57%) 30 – 38 (59% - 75%) 39 – 45 (76% - 88%) 46 – 51 (90% - 100%) 5 474-1341 (867) 1342-1509 (167) 1510-1761 (251) 1762-2058 (296) 2059-2713 (654) 2007 Raw Scores 0-15 (0% - 33%) 16 – 21 (36% - 47%) 22 – 31 (49% - 69%) 32 – 39 (71% - 87%) 40 – 45 (89% - 100%)
 (152) (290) (376) (648) 2006 Raw Scores 0-17 (0% - 38%) 18 – 23 (40% - 51%) 24 – 34 (53% - 76%) 35 – 43 (78% - 96%) 44 – 45 (98% - 100%) (1019) (140) (233) (274) (673) 2005 Raw Scores 0-23 (0% - 45%) 24 – 29 (47% - 57%) 30 – 38 (59% - 75%) 39 – 45 (76% - 88%) 46 – 51 (90% - 100%) (867) (167) (251) (296) (654) 2007 Raw Scores 0-15 (0% - 33%) 16 – 21 (36% - 47%) 22 – 31 (49% - 69%) 32 – 39 (71% - 87%) 40 – 45 (89% - 100%).")
21
Grade Ach. Level 1 Ach. Level 2 Ach. Level 3 Ach. Level 4 Ach. Level 5 6 539-1449 (910) 1450-1621 (171) 1622-1859 (237) 1860-2125 (265) 2126-2758 (632) 2007 Raw Scores 0-16 (0% - 36%) 17 – 23 (38% - 51%) 24 – 33 (53% - 73%) 34 – 40 (76% - 89%) 41 – 45 (91% - 100%) 7 671-1541 (870) 1542-1714 (172) 1715-1944 (229) 1945-2180 (235) 2181-2767 (586) 2006 Raw Scores 0-19 (0% - 42%) 20 – 28 (44% - 62%) 29 – 37 (64% - 82%) 38 – 42 (84% - 93%) 43 – 45 (96% - 100%) 8 886-1695 (809) 1696-1881 (185) 1882-2072 (190) 2073-2281 (208) 2282-2790 (508) 2005 Raw Scores 0-24 (0% - 47%) 25 – 33 (49% - 65%) 34 – 40 (67% - 78%) 41 – 46 (80% - 90%) 47 – 51 (92% - 100%) *Approximate Number of Correct Answers/Points Needed for Each Achievement Level
 (171) (237) (265) (632) 2007 Raw Scores 0-16 (0% - 36%) 17 – 23 (38% - 51%) 24 – 33 (53% - 73%) 34 – 40 (76% - 89%) 41 – 45 (91% - 100%) (870) (172) (229) (235) (586) 2006 Raw Scores 0-19 (0% - 42%) 20 – 28 (44% - 62%) 29 – 37 (64% - 82%) 38 – 42 (84% - 93%) 43 – 45 (96% - 100%) (809) (185) (190) (208) (508) 2005 Raw Scores 0-24 (0% - 47%) 25 – 33 (49% - 65%) 34 – 40 (67% - 78%) 41 – 46 (80% - 90%) 47 – 51 (92% - 100%) *Approximate Number of Correct Answers/Points Needed for Each Achievement Level.")
22
Grade Ach. Level 1 Ach. Level 2 Ach. Level 3 Ach. Level 4 Ach. Level 5 9 772-1771 (999) 1772-1971 (199) 1972-214 (173) 2146-2297 (151) 2298-2943 (645) 2006 Raw Scores 0-20 (0% - 44%) 21 – 30 (47% - 67%) 31 – 37 (69% - 82%) 38 – 41 (84% - 91%) 42 – 45 (93% - 100%) 10 844-1851 (1007) 1852-2067 (215) 2068-2218 (150) 2219-2310 (91) 2311-3008 (697) 2004 Raw Scores (First- time) 0-29 (0% - 57%) 30 – 37 (59% - 73%) 38 – 40 (75% - 78%) 41 – 44 (80% - 86%) 45 – 51 (88% - 100%) *Approximate Number of Correct Answers/Points Needed for Each Achievement Level
 (199) (173) (151) (645) 2006 Raw Scores 0-20 (0% - 44%) 21 – 30 (47% - 67%) 31 – 37 (69% - 82%) 38 – 41 (84% - 91%) 42 – 45 (93% - 100%) (1007) (215) (150) (91) (697) 2004 Raw Scores (First- time) 0-29 (0% - 57%) 30 – 37 (59% - 73%) 38 – 40 (75% - 78%) 41 – 44 (80% - 86%) 45 – 51 (88% - 100%) *Approximate Number of Correct Answers/Points Needed for Each Achievement Level.")
23
GradeAch. Level 1Ach. Level 2Ach. Level 3Ach. Level 4Ach. Level 5 3375-10781079-12681269-15081509-17491750-2225 2006 Raw Scores 0-14 (0% - 35%) 15 – 20 (38% - 50%) 21 – 29 (53% - 73%) 30 – 36 (75% - 90%) 37 – 40 (93% - 100%) 4581-12761277-14431444-16571658-18621863-2330 2005 Raw Scores 0-14 (0% - 35%) 15 – 20 (38% - 50%) 21 – 30 (53% - 75%) 31 – 36 (78% - 90%) 37 – 40 (93% - 100%) 5569-14511452-16311632-17681769-19561957-2456 3-2007 Raw Scores 0-15 (0% - 25%) 16 – 25 (27% - 42%) 26 – 35 (43% - 58%) 36 – 47 (60% - 78%) 48 – 60 (80% - 100%) Math DSS, Achievement Level, and Raw Scores* *Approximate Number of Correct Answers/Points Needed for Each Achievement Level
 15 – 20 (38% - 50%) 21 – 29 (53% - 73%) 30 – 36 (75% - 90%) 37 – 40 (93% - 100%) Raw Scores 0-14 (0% - 35%) 15 – 20 (38% - 50%) 21 – 30 (53% - 75%) 31 – 36 (78% - 90%) 37 – 40 (93% - 100%) Raw Scores 0-15 (0% - 25%) 16 – 25 (27% - 42%) 26 – 35 (43% - 58%) 36 – 47 (60% - 78%) 48 – 60 (80% - 100%) Math DSS, Achievement Level, and Raw Scores* *Approximate Number of Correct Answers/Points Needed for Each Achievement Level.")
24
GradeAch. Level 1Ach. Level 2Ach. Level 3Ach. Level 4Ach. Level 5 6 770-15531554-16911692-18591860-20182019-2492 2007 Raw Scores 0 - 13 (0% - 29%) 14 – 20 (32% - 45%) 21 – 28 (48% - 64%) 29 – 36 (66% - 82%) 37 – 44 (84% - 100%) 7 958-16601661-17851786-19381939-20792080-2572 2006 Raw Scores 0-14 (0% - 32%) 15 – 20 (34% - 45%) 21 – 31 (48% - 70%) 32 – 39 (73% - 89%) 40 – 44 (91% - 100%) 8 1025-17321733-18501851-19971998-20912092-2605 2005 Raw Scores 0-15 (0% - 25%) 16 – 24 (27% - 40%) 25 – 37 (42% - 62%) 38 – 46 (63% - 77%) 47 – 60 (78% - 100%) Math DSS, Achievement Level, and Raw Scores* *Approximate Number of Correct Answers/Points Needed for Each Achievement Level
 14 – 20 (32% - 45%) 21 – 28 (48% - 64%) 29 – 36 (66% - 82%) 37 – 44 (84% - 100%) Raw Scores 0-14 (0% - 32%) 15 – 20 (34% - 45%) 21 – 31 (48% - 70%) 32 – 39 (73% - 89%) 40 – 44 (91% - 100%) Raw Scores 0-15 (0% - 25%) 16 – 24 (27% - 40%) 25 – 37 (42% - 62%) 38 – 46 (63% - 77%) 47 – 60 (78% - 100%) Math DSS, Achievement Level, and Raw Scores* *Approximate Number of Correct Answers/Points Needed for Each Achievement Level.")
25
GradeAch. Level 1Ach. Level 2Ach. Level 3Ach. Level 4Ach. Level 5 9 1238-17811782-19001901-20222023-21412142-2596 2006 Raw Scores 0-11 (0% - 25%) 12 – 18 (27% - 41%) 19 – 28 (43% - 64%) 29 – 37 (66% - 84%) 38 – 44 (86% - 100%) 10 1068-18311832-19461947-20492050-21922193-2709 2004 Raw Scores 0-15 (0% - 25%) 16 – 24 (27% - 40%) 25 – 34 (42% - 57%) 35 – 49 (58% - 82%) 50 – 60 (83% - 100%) 10 1068-18311832-19461947-20492050-21922193-2709 2006 Summer Raw Scores 0-14 (0% - 24%) 15 – 22 (26% - 38%) 23 – 32 (40% - 55%) 33 – 47 (57% - 81%) 48 – 58 (83% - 100%) Math DSS, Achievement Level, and Raw Scores* *Approximate Number of Correct Answers/Points Needed for Each Achievement Level
 12 – 18 (27% - 41%) 19 – 28 (43% - 64%) 29 – 37 (66% - 84%) 38 – 44 (86% - 100%) Raw Scores 0-15 (0% - 25%) 16 – 24 (27% - 40%) 25 – 34 (42% - 57%) 35 – 49 (58% - 82%) 50 – 60 (83% - 100%) Summer Raw Scores 0-14 (0% - 24%) 15 – 22 (26% - 38%) 23 – 32 (40% - 55%) 33 – 47 (57% - 81%) 48 – 58 (83% - 100%) Math DSS, Achievement Level, and Raw Scores* *Approximate Number of Correct Answers/Points Needed for Each Achievement Level.")
26
Overview of Algebra 1 EOC Report 26

27
Raw Score EOC-Scale Scores (20 to 80) Achievement Level (1 to 5) Algebra Content Scores Algebra 1 EOC Scores
 Achievement Level (1 to 5) Algebra Content Scores Algebra 1 EOC Scores")
28
Algebra End-of-Course Reporting Category

29
29 Test Form EOC-Scale Score Statewide Comparison Points Earned by Content Area 1 1 2 2 3 3

30
T Scores 30 Average Score

31
2011 Algebra EOC Scale Distribution - Statewide 31 210,004 Students tested Average Scale Score is 49.43; Average Raw Score is 21 out of 52(41% Correct)
")
32
2011 District Algebra EOC Results of % of Students at Statewide Comparison by Thirds 32 Number of Students Tested StateM-DCPS789101112 210,00428,066*2,0486,18018,286940299263 * Does not include small numbers of students in Grade 6 and Adult Education Programs.

33
2011 Statewide Algebra EOC: Average % Correct by Grade Level 33 Number of Students Tested by Grade 6789101112 5612861564051142351890052302238

34
School Level Data Sources 34

35
35 Updated School Performance Report on C & I Website http://curriculum.dadeschools.net/schoolperformancereports.asp

36
What is the difference?

37
Raw Score Distribution: Grade 3 Math of Fall IA, 2010-11 Average Score is 17.7 or Average % Correct of 59 Average Score is 17.7 or Average % Correct of 59 67% of Students 36% of Students P at 70% Cutoff Proficient at 50% Cutoff

38
Grade 4

39
39 http://Curriculum.dadeschools.net NGSSS Benchmark Monitoring Tools

41
Assess the current and future needs of students. Decide what to change. Engage in continuous school improvement. Identify root causes of problems. Determine if goals are being met. Provide differentiated instruction for students.

43
State Tests Mar./April State Tests Mar./April School Year Interim Assessment1 Oct./Nov. Interim Assessment2 Jan./Feb. Baseline Assessment Aug./Sept. Continuous Instructional Improvement System Status

44
The District’s Pacing Guides and Instructional Focus Calendars are aligned with the timing and content of the District Interim Assessment, working together to provide both guidelines for instruction and tools for monitoring student progress throughout the year. District-wide Instructional Focus

45
Create meaningful data for administrators, coaches, and teachers…. Continuous Instructional Improvement System

46
What did you see? 1. Who is the targeted students? 2. What is the overall performance of the targeted group? 3. What is the content category of concerns?

47
Tips for Analyzing Data

48
“disaggregated” “longitudinal” “cross-tabulated” … for digging beneath the averages! Do you have … … data?

49
It would be very easy to get “analysis paralysis” by spending time pulling data together but not spending time using the data.

50
Which students? School Grade AYP Include only students who are in your school for a full academic year (Oct. FTE and Feb. FTE) and who are NOT the first year LEP students. School Grade Include only students who are in your school for a full academic year Criteria for meeting high standards only, include students who are: Standard curriculum ESE: Speech impaired (F) Gifted (L) Hospital homebound (M) ELL who have been in an ESOL program for more than two years FCAT unedited: Include all students tested AYP FCAT, ALL TESTED
 and who are NOT the first year LEP students. School Grade Include only students who are in your school for a full academic year Criteria for meeting high standards only, include students who are: Standard curriculum ESE: Speech impaired (F) Gifted (L) Hospital homebound (M) ELL who have been in an ESOL program for more than two years FCAT unedited: Include all students tested AYP FCAT, ALL TESTED.")
51
2007-2011 FCAT and Content Cluster Report Writing School Grade Science Reading Math AYP

52
2010-2011 District Baseline Assessment Results School Name Reading - Grade 5 Level of Proficiency at 70% or above 2010 AYP Met** Total # of Students % of Students Tested Overall [44]Vocabulary [7]Reading Application [24] Literary Analysis Fiction/Nonfiction [8] Informational Text/ Research Process [5] Average Score % Proficient Average Score % Proficient Average Score % Proficient Average Score % Proficient Average Score % Proficient All students NO 4998% (48)19.98% (4)4.427% (14)11.110% (5)2.98% (4)2.424% (11) FCAT Level 1 1794% (16)12.70% (0)2.214% (2)6.90% (0)1.90% (0)1.66% (1) FCAT Level 2 6100% (6)20.50% (0)4.544% (2)12.417% (1)2.20% (0)2.517% (1) FCAT Level 3 18100% (18)24.917% (4)4.449% (7)14.117% (4)4.511% (2)4.144% (8) FCAT Level 4 5100% (5)29.620% (1)4.840% (2)16.220% (1)5.640% (2)4.020% (1) FCAT Level 5 NA White NA Black NO 44100% (44)19.97% (4)4.526% (11)11.19% (4)2.99% (4)2.524% (10) Hispanic NA 684% (5)19.820% (1)4.240% (2)11.220% (1)4.40% (0)2.020% (1) Asian NA Am. Indian NA ED NO 47100% (47)19.79% (4)4.426% (12)11.011% (5)2.96% (4)2.421% (10) ELL NA 0 SWD NO 14100% (14)11.40% (0)1.80% (0)6.50% (0)1.60% (0)1.50% (0)
![District Baseline Assessment Results School Name Reading - Grade 5 Level of Proficiency at 70% or above 2010 AYP Met** Total # of Students % of Students Tested Overall [44]Vocabulary [7]Reading Application [24] Literary Analysis Fiction/Nonfiction [8] Informational Text/ Research Process [5] Average Score % Proficient Average Score % Proficient Average Score % Proficient Average Score % Proficient Average Score % Proficient All students NO 4998% (48)19.98% (4)4.427% (14)11.110% (5)2.98% (4)2.424% (11) FCAT Level % (16)12.70% (0)2.214% (2)6.90% (0)1.90% (0)1.66% (1) FCAT Level % (6)20.50% (0)4.544% (2)12.417% (1)2.20% (0)2.517% (1) FCAT Level % (18)24.917% (4)4.449% (7)14.117% (4)4.511% (2)4.144% (8) FCAT Level % (5)29.620% (1)4.840% (2)16.220% (1)5.640% (2)4.020% (1) FCAT Level 5 NA White NA Black NO 44100% (44)19.97% (4)4.526% (11)11.19% (4)2.99% (4)2.524% (10) Hispanic NA 684% (5)19.820% (1)4.240% (2)11.220% (1)4.40% (0)2.020% (1) Asian NA Am.](http://images.slideplayer.com/16/4961289/slides/slide_52.jpg "Indian NA ED NO 47100% (47)19.79% (4)4.426% (12)11.011% (5)2.96% (4)2.421% (10) ELL NA 0 SWD NO 14100% (14)11.40% (0)1.80% (0)6.50% (0)1.60% (0)1.50% (0).")
53
Selection of School Report http://curriculum.dadeschools.net/schoolperformancereports.asp Reading School Performance Reports Benchmark List Description Grade 6 Grade 7 Grade 8 Mathematics School Performance Reports Benchmark List Description Grade 6 Grade 7 Grade 8 Science N/A School Performance Reports Benchmark List Description N/A Grade 8 Step 2. Click on a subject/grade button below to go to that specific sheet. Step 1. Select a school from the drop down list below. School and Subject Selection 53 List of Schools

54
School Accountability

55
School Grading Point Criteria EDISON PARK ELEMENTARY* WILLIAM J. BRYAN ELEMENTARY* FLORIDA CITY ELEMENTARY* WILLIAM H. TURNER TECHNICAL ARTS*

56
56 Group Participation Met (Tested 95%) Proficiency Met ReadingMathReadingMath TOTAL1111 WHITE2222 BLACK3333 HISP.4444 ASIAN5555 Am. Ind.6666 ED7777 ELL8888 SWD9999 AYP Point Criteria 39 Components Criteria (NA, No, Yes) AYP Point Criteria 39 Components Criteria (NA, No, Yes)
 AYP Point Criteria 39 Components Criteria (NA, No, Yes).")
57
Year %Proficiency Targets ReadingMath 2008-096568 2009-107274 2010-117980 2011-1286 2012-1393 2013-14100

62
Content Cluster Analysis Benchmark Analysis Item Analysis Identified Students

63
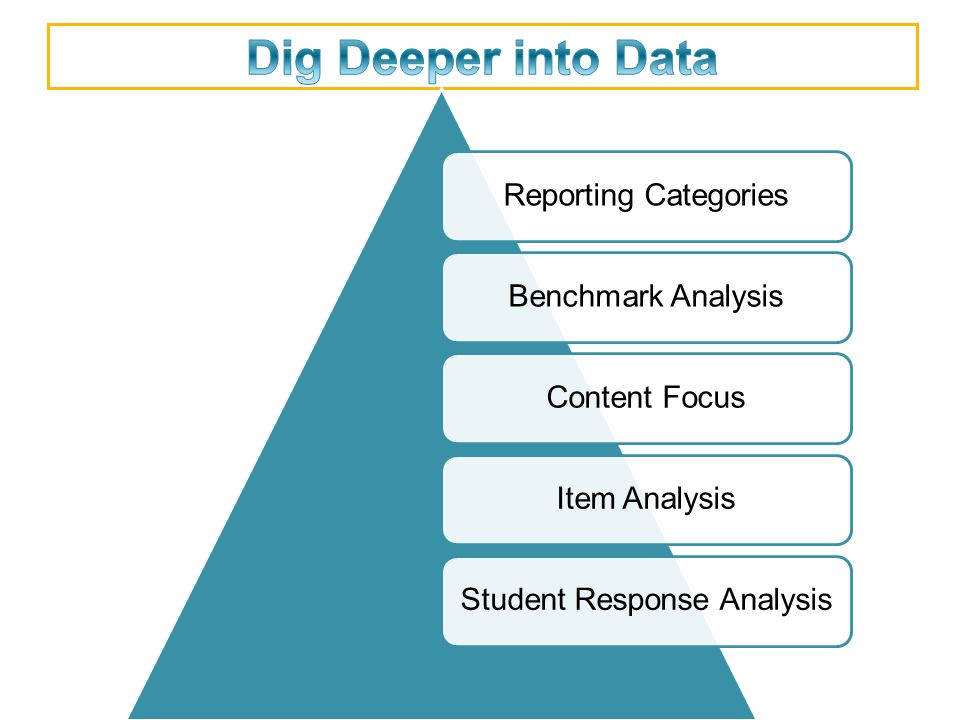
Digging into Data Content Categories Analysis Benchmark Analysis Item Analysis Identified Students Content Focus

64
Edusoft Reports

65
Protocols for Baseline/Interim Assessment

66
2010-2012 Ideal Data File 66

67
Student Database 67

68
Student Data Sources 68 PMRN – Progress Monitoring Reporting Network

69
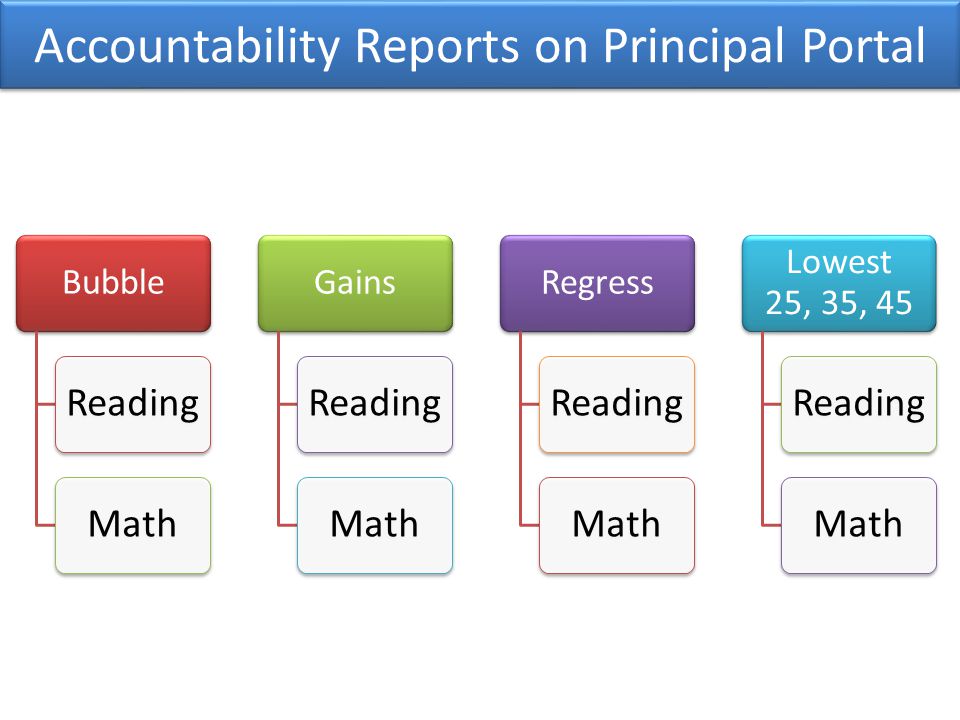
69 Accountability Reports on Principal Portal

71
Accountability Report Data Elements No.Variable Name 1Student_ID 2Name 3Gain 4Bubble 5Regress 6Sur2_Schl (October FTE) 7Sur3_Schl (February FTE) 8Rank (Based on DSS) 9Most_Recent_FCAT_Grade 10Most_Recent_FCAT_Level 11Most_Recent_FCAT_Scale_Score No.Variable Name 12Most_Recent_FCAT_DSS_Score 13Prior_FCAT_Grade 14Prior_FCAT_Level 15Prior_FCAT_Scale_Score 16Prior_FCAT_DSS_Score 17AYP_Ethnic 18LEP_code 19LF___2_YR 20LEP_Entry_Date 21SPED_EXCP 22Lunch_Code
 7Sur3_Schl (February FTE) 8Rank (Based on DSS) 9Most_Recent_FCAT_Grade 10Most_Recent_FCAT_Level 11Most_Recent_FCAT_Scale_Score No.Variable Name 12Most_Recent_FCAT_DSS_Score 13Prior_FCAT_Grade 14Prior_FCAT_Level 15Prior_FCAT_Scale_Score 16Prior_FCAT_DSS_Score 17AYP_Ethnic 18LEP_code 19LF___2_YR 20LEP_Entry_Date 21SPED_EXCP 22Lunch_Code")
72
Other Reports on Principal Portal

73
73 Accountability Reports on Principal Portal

75
Improve achievement Levels Maintain high standards Demonstrate more than one year’s growth (using the developmental scale score gains) when remaining in achievement level 1 or 2 for both years. 5 4 3 2 1 12345 2010 Achievement Level 2011 Achievement Level

76
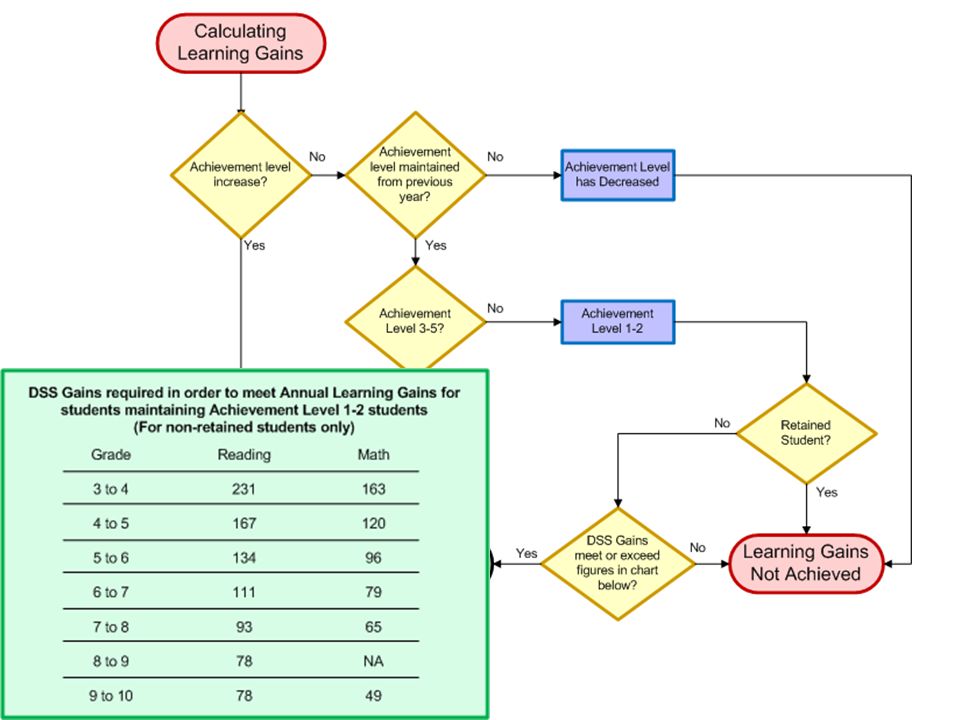
GradeReadingMath 3 to 4 231163 4 to 5 167120 5 to 6 13496 6 to 7 11179 7 to 8 9365 8 to 9 78NA 9 to 10 7849 Annual Learning Gains for FCAT Achievement Levels 1 and 2 (Do not use for retained students) and Reading
 and Reading")
77
Mathematics FCAT Worksheet Student Student Grade Achievement Level Developmental Scale Scores (DSS) 2010-11 Meeting High Standards for School Grade 2010-11 Making Annual Learning Gains 2010-11 Meeting AYP Standards 2009-102010-112009-102010-112009-102010-11Change Yes/No 1 67221661167615 2 6743191919267 3 671112651502237 4 671312951853558 5 771113821502120 6 67321717174831 7 671112691382113 8 77221676174872 9 67441902193937 10 67111256958-298 11 672316871930243 12 673317511870119 13 7 2 1676NA 14 6721163516449 15 673 1786 NA
 Meeting High Standards for School Grade Making Annual Learning Gains Meeting AYP Standards Change Yes/No NA NA")
78
Mathematics FCAT Worksheet - Answer Student Student Grade Achievement Level Developmental Scale Scores (DSS) 2010-11 Meeting High Standards for School Grade 2010-11 Making Annual Learning Gains 2010-11 Meeting AYP Standards 2009-102010-112009-102010-112009-102010-11Change Yes/No 1 67221661167615 No 2 6743191919267 YesNoYes 3 671112651502237 NoYesNo 4 671312951853558 Yes 5 771113821502120 No 6 67321717174831 No 7 671112691382113 NoYesNo 8 77221676174872 No 9 67441902193937 Yes 10 67111256958-298 No 11 672316871930243 Yes 12 673317511870119 Yes 13 7 2 1676NA NoNANo 14 6721163516449 No 15 673 1786 NA
 Meeting High Standards for School Grade Making Annual Learning Gains Meeting AYP Standards Change Yes/No No YesNoYes NoYesNo Yes No No NoYesNo No Yes No Yes Yes NA NoNANo No NA")
82
Accountability Report Data Elements No.Variable Name 1Student_ID 2Name 3Gain 4Bubble 5Regress 6Sur2_Schl (October FTE) 7Sur3_Schl (February FTE) 8Rank (Based on DSS) 9Most_Recent_FCAT_Grade 10Most_Recent_FCAT_Level 11Most_Recent_FCAT_Scale_Score No.Variable Name 12Most_Recent_FCAT_DSS_Score 13Prior_FCAT_Grade 14Prior_FCAT_Level 15Prior_FCAT_Scale_Score 16Prior_FCAT_DSS_Score 17AYP_Ethnic 18LEP_code 19LF___2_YR 20LEP_Entry_Date 21SPED_EXCP 22Lunch_Code
 7Sur3_Schl (February FTE) 8Rank (Based on DSS) 9Most_Recent_FCAT_Grade 10Most_Recent_FCAT_Level 11Most_Recent_FCAT_Scale_Score No.Variable Name 12Most_Recent_FCAT_DSS_Score 13Prior_FCAT_Grade 14Prior_FCAT_Level 15Prior_FCAT_Scale_Score 16Prior_FCAT_DSS_Score 17AYP_Ethnic 18LEP_code 19LF___2_YR 20LEP_Entry_Date 21SPED_EXCP 22Lunch_Code")
83
Export Accountability Report

84
Principal Accountability Report SchoolGradeView Report Export Data Print

85
Using Pivot Table to Answer These Questions 1

86
Guiding Questions to Inform the Problem-Solving Process

87
Insert Pivot Table for Data Analysis (folder) 1.Click on Cell A2 2.On main menu, select “Insert” 3.Click on “Pivot Table” then select “Pivot Table” 4.Create Pivot Table will appear. 5.Check Table/Range to make sure it is correct. Then click OK. 6.Pivot Table appear with Pivot Table Field List.

88
Continued 1. Click A3 and select “Options” under “PivotTable Tools”. 2. Next click on “Options” under. PivotTable Name. Next, select “Options” under “PivotTable Tools”. 1. Click A3 and select “Options” under “PivotTable Tools”. 2. Next click on “Options” under. PivotTable Name. Next, select “Options” under “PivotTable Tools”. 3. Select “Display” Tab 4. Check on Classic Pivot Table layout 3. Select “Display” Tab 4. Check on Classic Pivot Table layout

89
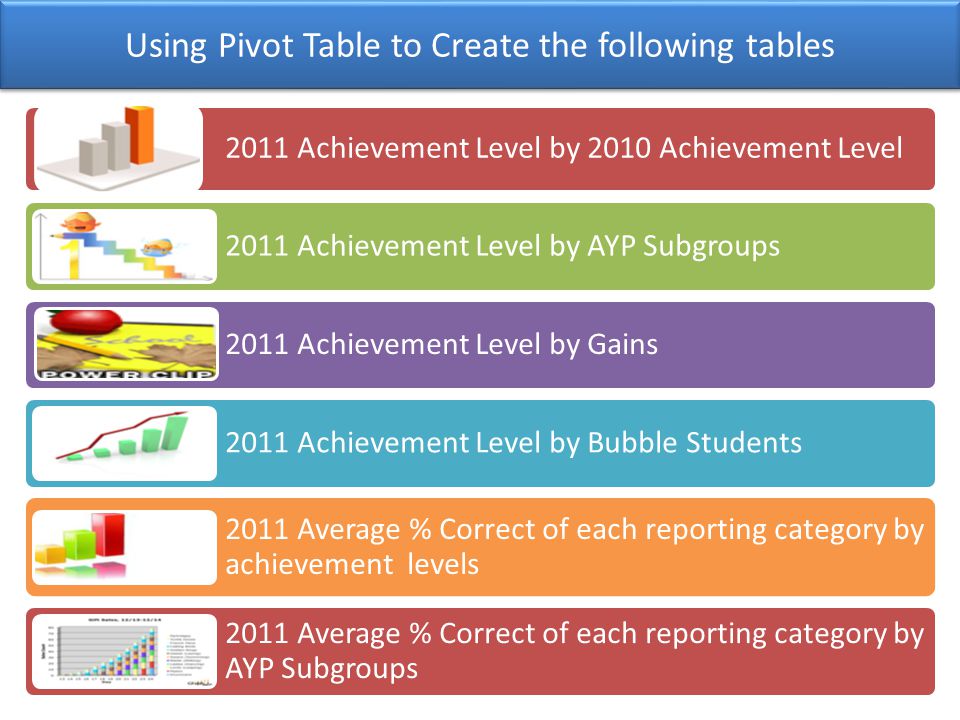
Using Pivot Table to Create the following tables

91
Enable Macro for Excel

92
Student Performance Indicators (SPI) 92
 92")
93
SPI School Data Elements 1.CLASS_SCHOOL 2.STUDENT_NAME 3.STUDENT_ID 4.STUDENT_STATUS_CODE 5.GENDER 6.STUDENT_ETHNICITY 7.STUDENT_GRADE 8.STUDENT_HOMEROOM 9.LEP_Entry_Date 10.LUNCH_CODE 11.Birthdate 12.ESE_INFO 13.LEP_INFO 14.FCAT_CURR_GROUP 15.FCAT_TEST_YEAR 16.FCAT_TEST_MONTH 17.FCAT_GRADE 18.FCAT_NRT_MATH_SCALE 19.FCAT_NRT_MATH_PERCENT 20.FCAT_NRT_MATH_STANINE 21.FCAT_NRT_READ_SCALE 22.FCAT_NRT_READ_PERCENT 23.FCAT_NRT_READ_STANINE 24.FCAT_SSS_MATH_SCORE 1.CLASS_SCHOOL 2.STUDENT_NAME 3.STUDENT_ID 4.STUDENT_STATUS_CODE 5.GENDER 6.STUDENT_ETHNICITY 7.STUDENT_GRADE 8.STUDENT_HOMEROOM 9.LEP_Entry_Date 10.LUNCH_CODE 11.Birthdate 12.ESE_INFO 13.LEP_INFO 14.FCAT_CURR_GROUP 15.FCAT_TEST_YEAR 16.FCAT_TEST_MONTH 17.FCAT_GRADE 18.FCAT_NRT_MATH_SCALE 19.FCAT_NRT_MATH_PERCENT 20.FCAT_NRT_MATH_STANINE 21.FCAT_NRT_READ_SCALE 22.FCAT_NRT_READ_PERCENT 23.FCAT_NRT_READ_STANINE 24.FCAT_SSS_MATH_SCORE 25.FCAT_SSS_MATH_LEVEL 26.FCAT_SSS_MATH_DEVELOP 27.FCAT_SSS_MATH_NS (Content 1) 28.FCAT_SSS_MATH_M (Content 2) 29.FCAT_SSS_MATH_GS (Content 3) 30.FCAT_SSS_MATH_AT (Content 4) 31.FCAT_SSS_MATH_DA 32.FCAT_SSS_READ_SCORE 33.FCAT_SSS_READ_LEVEL 34.FCAT_SSS_READ_DEVELOP 35.FCAT_SSS_READ_WP (Content 1) 36.FCAT_SSS_READ_MIP (Content 2) 37.FCAT_SSS_READ_C (Content 3) 38.FCAT_SSS_READ_RR (Content 4) 39.FCAT_SSS_SCI_SCORE 40.FCAT_SSS_SCI_LEVEL 41.FCAT_SSS_SCI_PC 42.FCAT_SSS_SCI_ES 43.FCAT_SSS_SCI_LE 44.FCAT_SSS_SCI_ST 45.FCAT_SSS_WRITE_PT 46.FCAT_SSS_WRITE_SCORE 47.FCAT_READ_PASS_FAIL 48.FCAT_MATH_PASS_FAIL 25.FCAT_SSS_MATH_LEVEL 26.FCAT_SSS_MATH_DEVELOP 27.FCAT_SSS_MATH_NS (Content 1) 28.FCAT_SSS_MATH_M (Content 2) 29.FCAT_SSS_MATH_GS (Content 3) 30.FCAT_SSS_MATH_AT (Content 4) 31.FCAT_SSS_MATH_DA 32.FCAT_SSS_READ_SCORE 33.FCAT_SSS_READ_LEVEL 34.FCAT_SSS_READ_DEVELOP 35.FCAT_SSS_READ_WP (Content 1) 36.FCAT_SSS_READ_MIP (Content 2) 37.FCAT_SSS_READ_C (Content 3) 38.FCAT_SSS_READ_RR (Content 4) 39.FCAT_SSS_SCI_SCORE 40.FCAT_SSS_SCI_LEVEL 41.FCAT_SSS_SCI_PC 42.FCAT_SSS_SCI_ES 43.FCAT_SSS_SCI_LE 44.FCAT_SSS_SCI_ST 45.FCAT_SSS_WRITE_PT 46.FCAT_SSS_WRITE_SCORE 47.FCAT_READ_PASS_FAIL 48.FCAT_MATH_PASS_FAIL
 28.FCAT_SSS_MATH_M (Content 2) 29.FCAT_SSS_MATH_GS (Content 3) 30.FCAT_SSS_MATH_AT (Content 4) 31.FCAT_SSS_MATH_DA 32.FCAT_SSS_READ_SCORE 33.FCAT_SSS_READ_LEVEL 34.FCAT_SSS_READ_DEVELOP 35.FCAT_SSS_READ_WP (Content 1) 36.FCAT_SSS_READ_MIP (Content 2) 37.FCAT_SSS_READ_C (Content 3) 38.FCAT_SSS_READ_RR (Content 4) 39.FCAT_SSS_SCI_SCORE 40.FCAT_SSS_SCI_LEVEL 41.FCAT_SSS_SCI_PC 42.FCAT_SSS_SCI_ES 43.FCAT_SSS_SCI_LE 44.FCAT_SSS_SCI_ST 45.FCAT_SSS_WRITE_PT 46.FCAT_SSS_WRITE_SCORE 47.FCAT_READ_PASS_FAIL 48.FCAT_MATH_PASS_FAIL 25.FCAT_SSS_MATH_LEVEL 26.FCAT_SSS_MATH_DEVELOP 27.FCAT_SSS_MATH_NS (Content 1) 28.FCAT_SSS_MATH_M (Content 2) 29.FCAT_SSS_MATH_GS (Content 3) 30.FCAT_SSS_MATH_AT (Content 4) 31.FCAT_SSS_MATH_DA 32.FCAT_SSS_READ_SCORE 33.FCAT_SSS_READ_LEVEL 34.FCAT_SSS_READ_DEVELOP 35.FCAT_SSS_READ_WP (Content 1) 36.FCAT_SSS_READ_MIP (Content 2) 37.FCAT_SSS_READ_C (Content 3) 38.FCAT_SSS_READ_RR (Content 4) 39.FCAT_SSS_SCI_SCORE 40.FCAT_SSS_SCI_LEVEL 41.FCAT_SSS_SCI_PC 42.FCAT_SSS_SCI_ES 43.FCAT_SSS_SCI_LE 44.FCAT_SSS_SCI_ST 45.FCAT_SSS_WRITE_PT 46.FCAT_SSS_WRITE_SCORE 47.FCAT_READ_PASS_FAIL 48.FCAT_MATH_PASS_FAIL")
94
VLOOKUP FUNCTION =VLOOKUP(LOOKUP_VALUE, TABLE_ARRAY, COLUMN INDEX NUMBER, FALSE) Lookup_Value: What value are you searching for? Excel will look for a match to this value in the leftmost column of the lookup table Table_Array: Where do you want to search? Use absolute references to “lock” the range by pressing F4 key Col_index_num Which column contains the search result? Count over from the first column to figure out what this number should be, starting with 1. FALSE To force Excel to lookup value be exact match =VLOOKUP($A2,’Interim Assessment!$A$3:$R$103,3,FALSE) Open Excel Practice file
 Open Excel Practice file.")
95
VLOOKUP FUNCTION =VLOOKUP(LOOKUP_VALUE, TABLE_ARRAY, COLUMN INDEX NUMBER, FALSE)
")
96
Vlookup Function S3 =vlookup($a3,'2010 Interim'!$A$5:$H$118,4,false) T3 =vlookup($a3,'2010 Interim'!$A$5:$H$118,6,false) U3 =vlookup($a3,'2010 Interim'!$A$5:$H$118,8,false)
 T3 =vlookup($a3, 2010 Interim !$A$5:$H$118,6,false) U3 =vlookup($a3, 2010 Interim !$A$5:$H$118,8,false)")
97
Using Macro to Format and Merge the Data Files into One 97 Reading Data Math Data Reading Content Focus Reading Content Focus Math Content Focus Math Content Focus Reading and Math Data Combined Reading and Math Data Combined Pivot Tables http://osi.dadeschools.net/actiondata

98
98 File Download Manager Demographic Class Academic ESE ESOL Testing Download File

99
99 File Download Manager

100
Students to be Tested in 2011-12 Algebra 1 1200310 - Algebra 1 1200320 - Algebra 1 Hon. 1200380 - Algebra 1B 1209810 - Pre-AICE Mathematics 1 1200390 - IB Middle Years Program – Algebra 1 Hon. Geometry 1206310 - Geometry 1206320 - Geometry Hon. 1206810 - IB Middle Years Program Geometry Hon. 1209820 - Pre-AICE Mathematics 2 Biology 2000310 - Biology 1 2000320 - Biology 1 Hon. 2000322 - Pre-AICE Biology 2000430 - Biology Technology 2000800 - Biology 1 PreIB 2000850 - IB Middle Years Program Biology Hon. 2002440 - Integrated Science 3 2002450 - Integrated Science 3 Hon.

101
Independent Assignment Select one school, one grade, one subject area of your choice. Download the template from the website. Complete the template with data of the selected school. On the “Pivot Table Blank”, fill the blank pivot table with data. Save the file as PD Sequence-Last Name-Work Location, example: 0672-Wongbundhit-9629 PD Sequence: 0672 for 8/26; 0673 for 8/29 Send the file to ywongbundhit@dadeschools.netywongbundhit@dadeschools.net

102
102

Similar presentations


>")
 We will lead the nation in improving student achievement. Kathy Cox, State Superintendent of Schools.>")
 and State and Federal Accountability Elementary and Middle School Principals November 5, 2009.>")
 Interpretive Products.>")


 Board Presentation March 25, 2008.>")


 and ACCESS for ELLs® Data to Make Instructional Decisions for English Learners.>")


 ODMS PD SIP.>")