Download presentation
Presentation is loading. Please wait.

1
Integrating Edusoft Data into the SIP Mid-year Application

2
Objectives Participants will be able to: Identify subgroups not making satisfactory progress on identified Annual Measureable Objectives (AMO); Generate specific reports using Edusoft Report Builder; and Export Excel files to focus on student performance data to improve instruction.
; Generate specific reports using Edusoft Report Builder; and Export Excel files to focus on student performance data to improve instruction.")
3
You doWe doI do Norms for Today

4
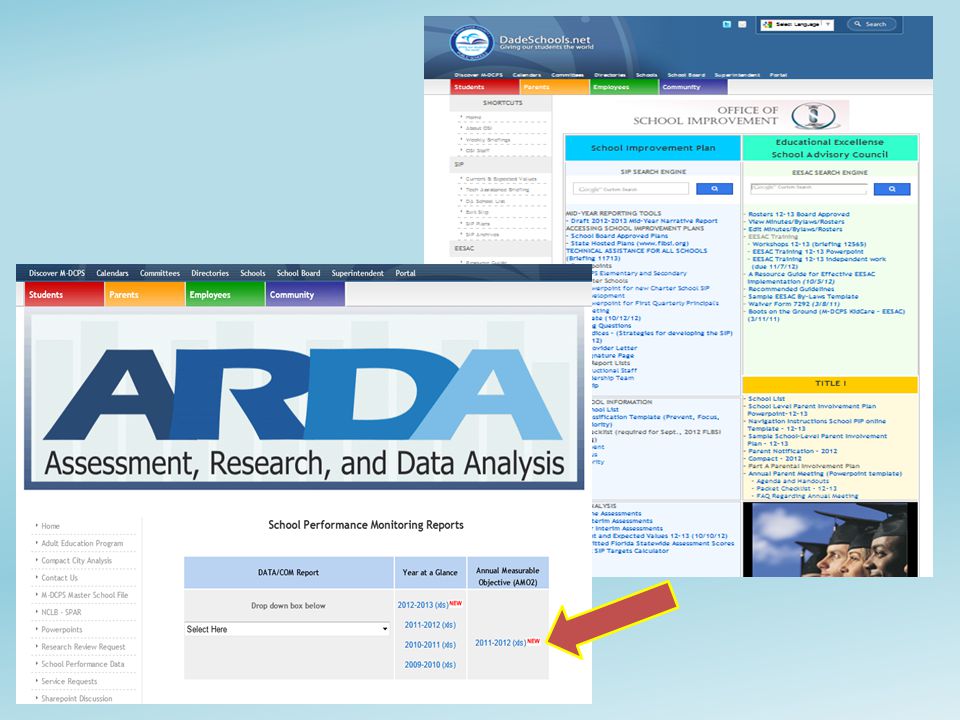
Subgroups and AMO Your Annual Measureable Goal is determined by the state and provided to you at http://osi.dadeschools.net – then click “Current and Expected Values 12-13” in the bottom section of “DATA Analysis.” http://osi.dadeschools.net By clicking on 2011-2012 in the Annual Measurable Objective (AMO2) column, you will be able to access this information.
 column, you will be able to access this information.")
6
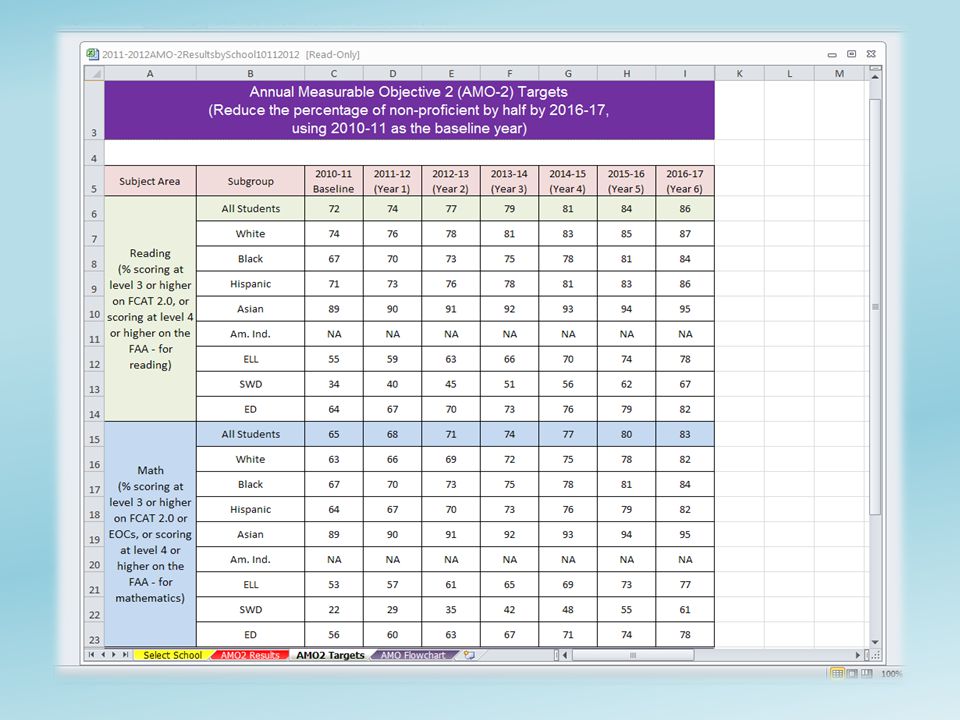
Select a school from the drop down list and click on the provided buttons. Annual Measurable Objectives-2 Report, 2011-12 School AMO-2 Results School AMO-2 Targets AMO Flow Chart District

9
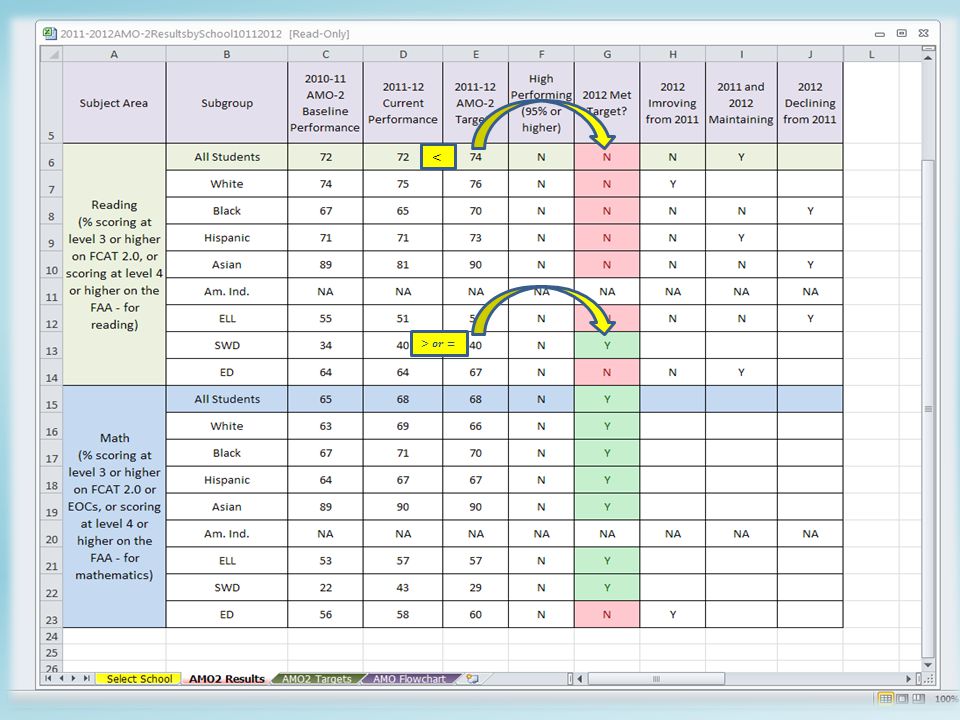
You can use the flowchart to determine if a subgroup reached its AMO target for this year. Any subgroup that did not meet the AMO target must be reported on the Mid-Year Report.

10
Using Edusoft to generate data reports for subgroups

11
Log in to Edusoft. http://www.edusoft.comhttp://www.edusoft.com

12
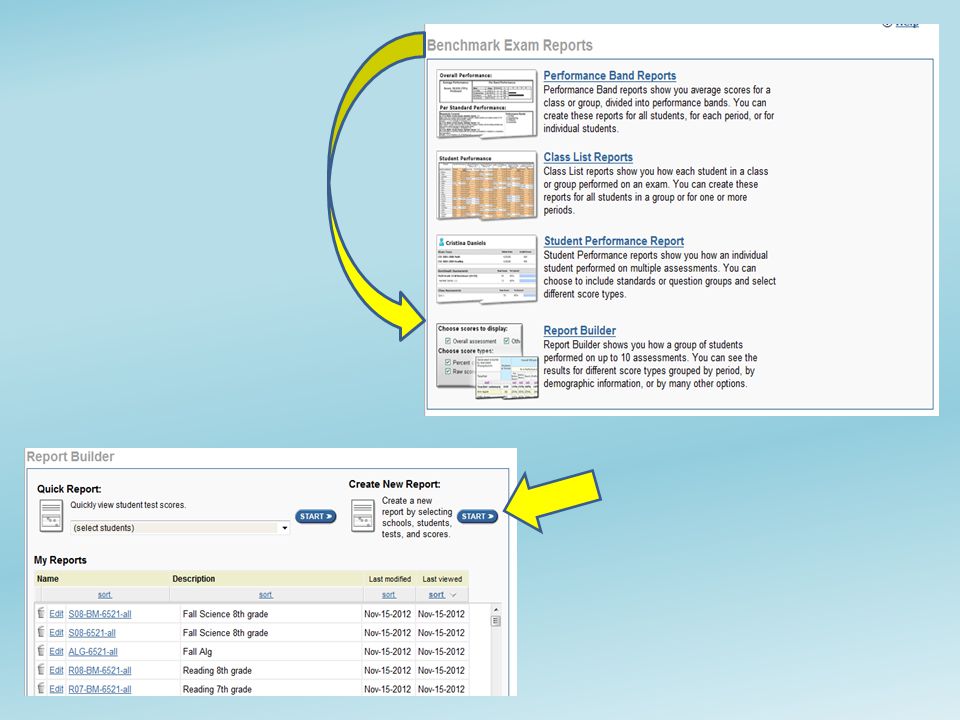
From the top of the page click on Benchmark Exam Click on Reports

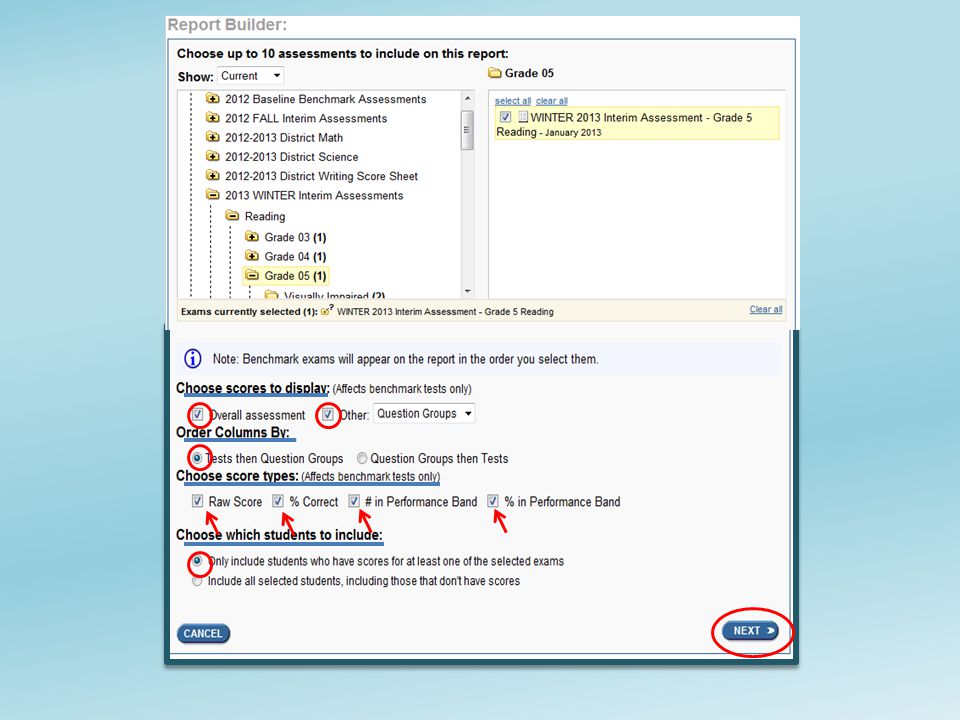
14
You will see “Winter 2013 Interim Assessment – Grade 5 Reading” under Exams currently selected

16
√ This box may look different for you – choose “all” if it gives you a choice of classes.

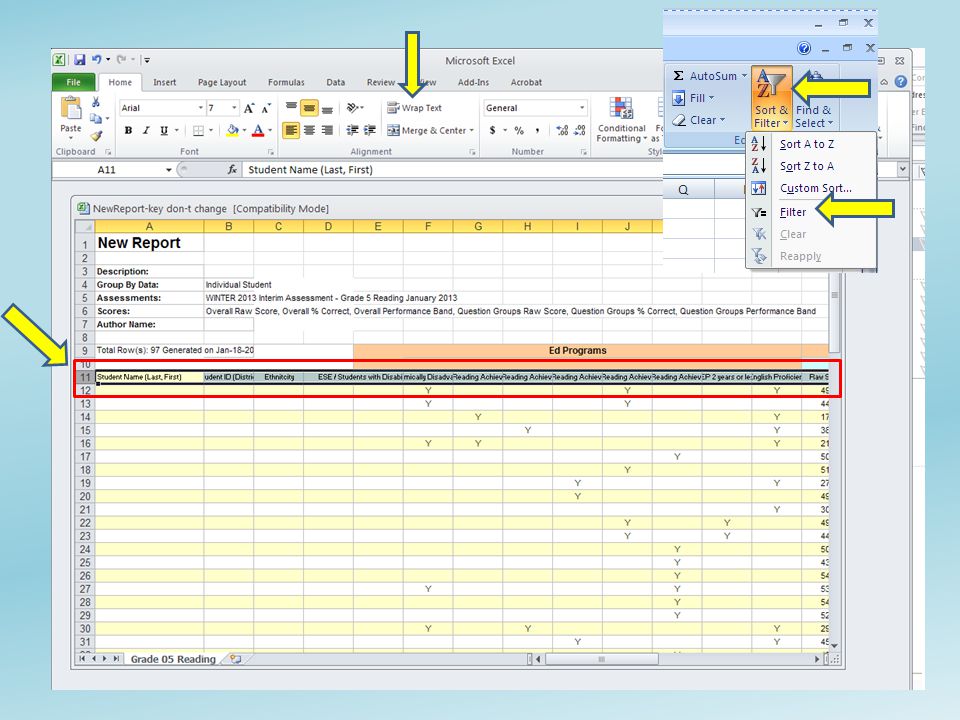
19
Choose View/Save in EXCEL. Save the Excel file to your flash drive using a logical name: (Reading Grade 05 WIA Subgroups).
..")
20
New Report SaveSave

21
Using EXCEL to Focus on Student Performance

22
Preparing the File

23
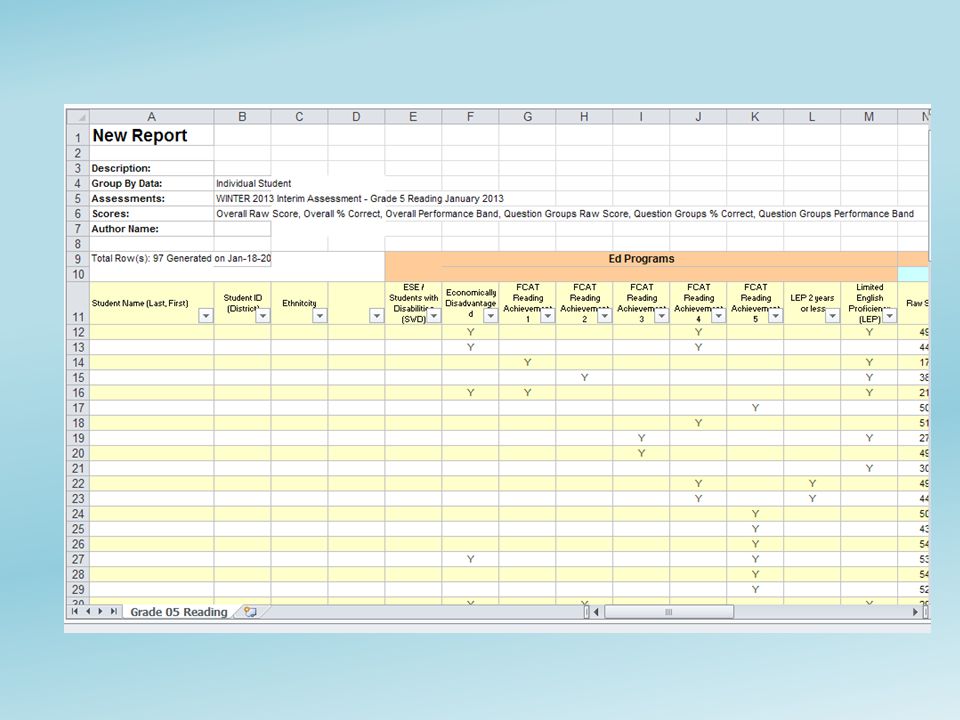
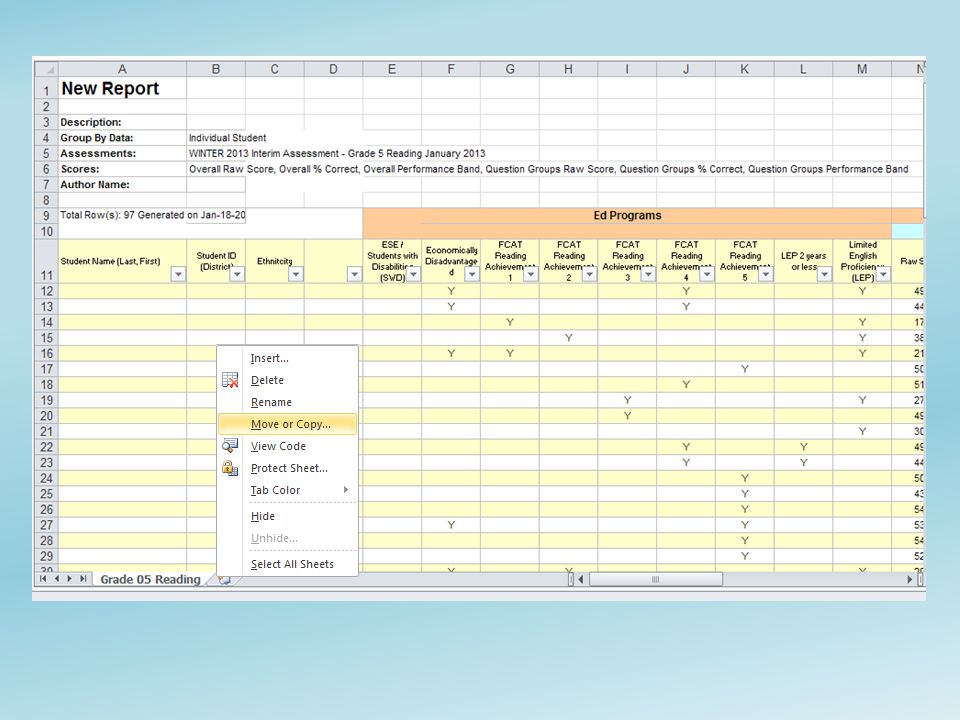
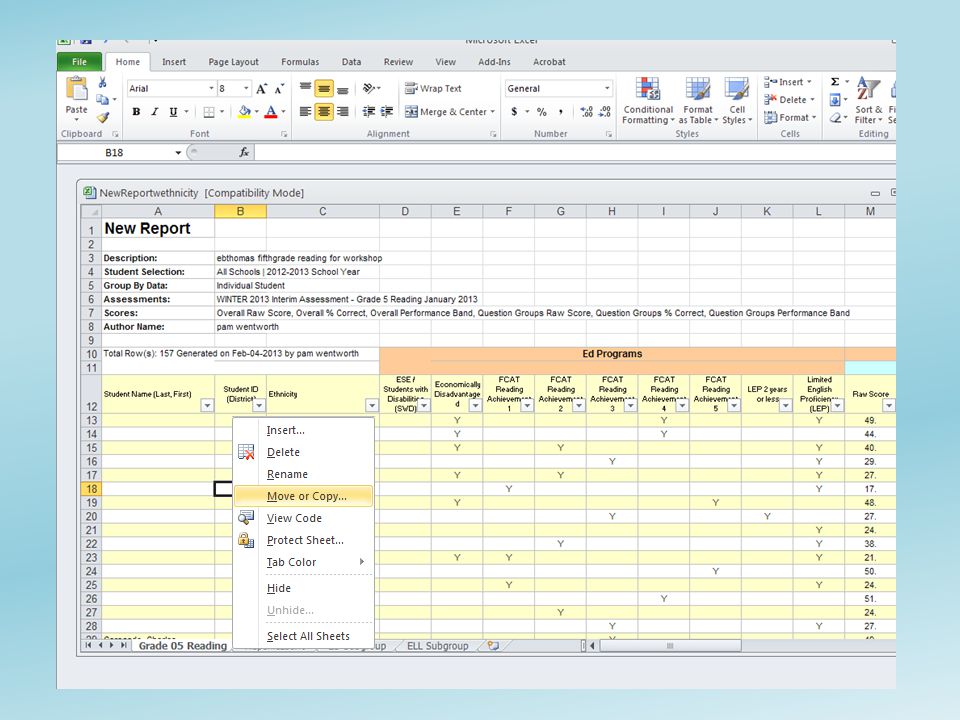
Open the EXCEL file that you saved: Here you will see the names and ID numbers of the students who took the assessment you chose. Check to be sure the Assessment is correct Double click on the tab to open the menu

27
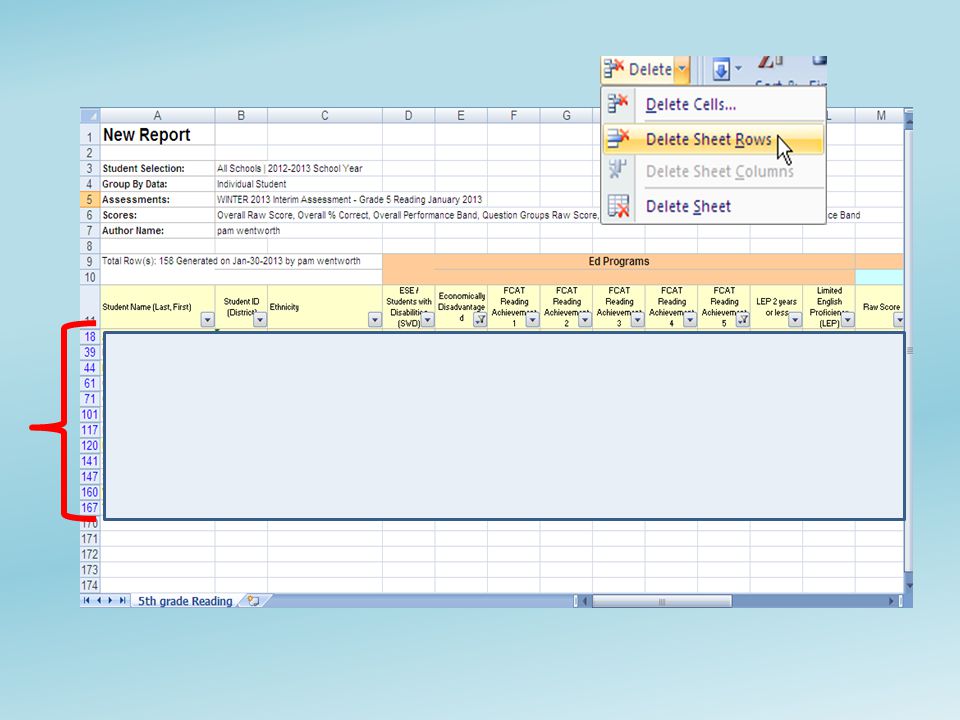
Save the changes you made to your EXCEL file…

28
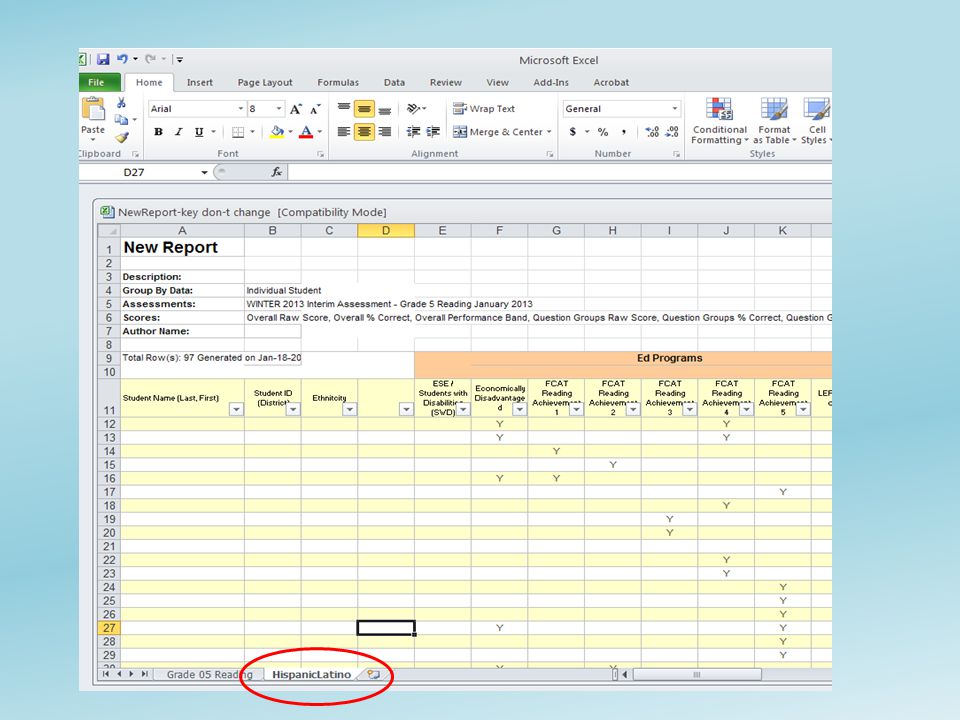
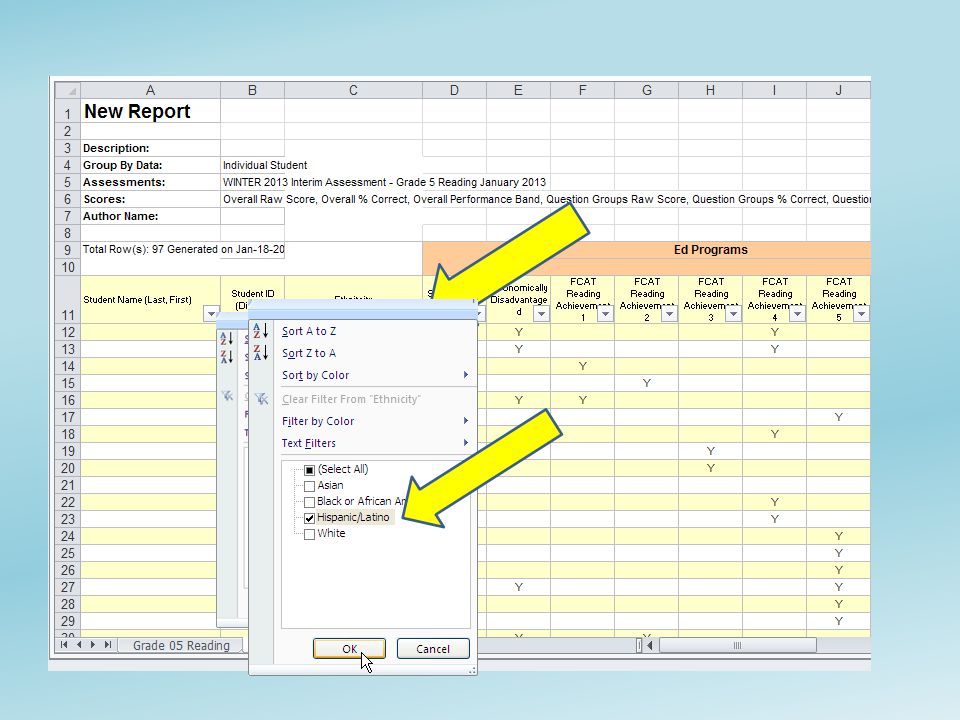
Find the Hispanic Subgroup

31
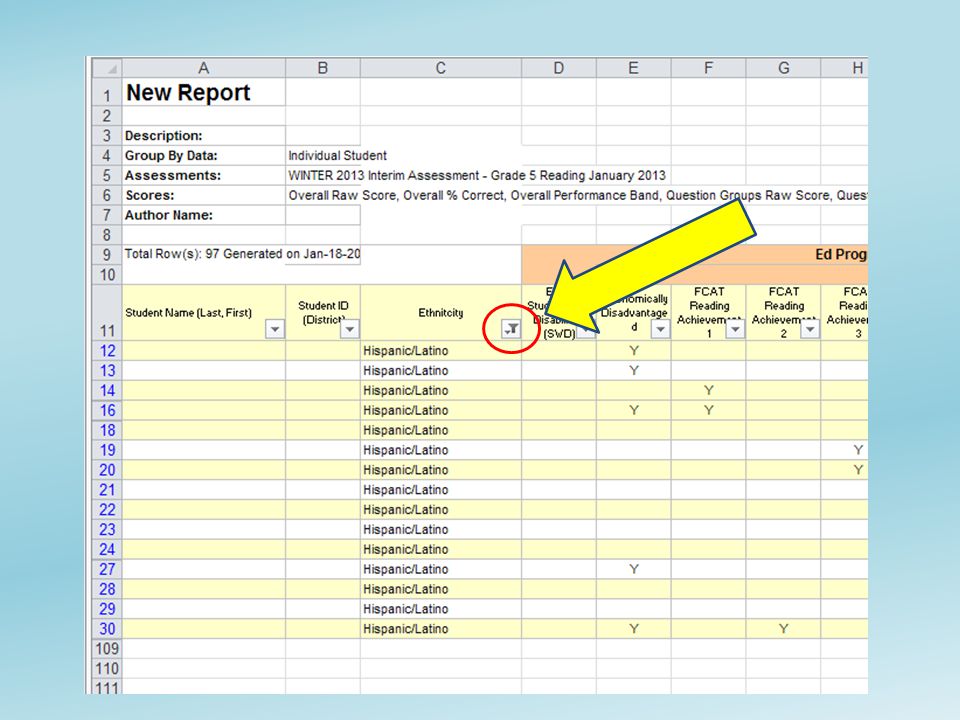
Hispanic Latinos

35
Save the changes you made to your EXCEL file…

36
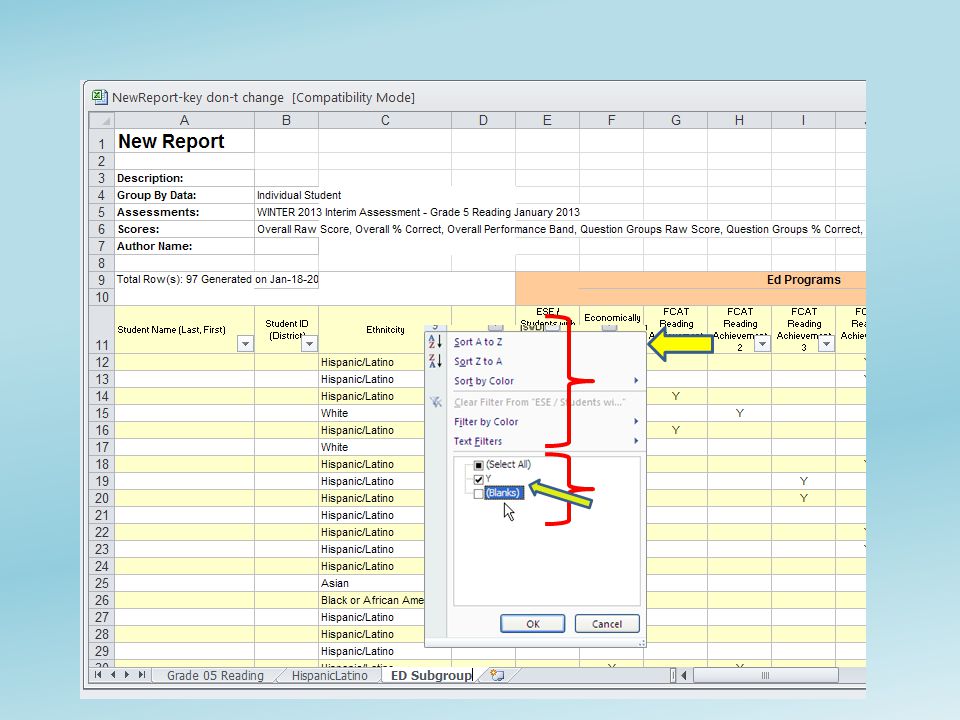
To see other ethnicities, clear the filter for Hispanic and apply another filter. You may also deselect Hispanic/Latino in the filter, delete the rows for the other ethnicities, and clear the filter. This would just leave Hispanic/Latino

37
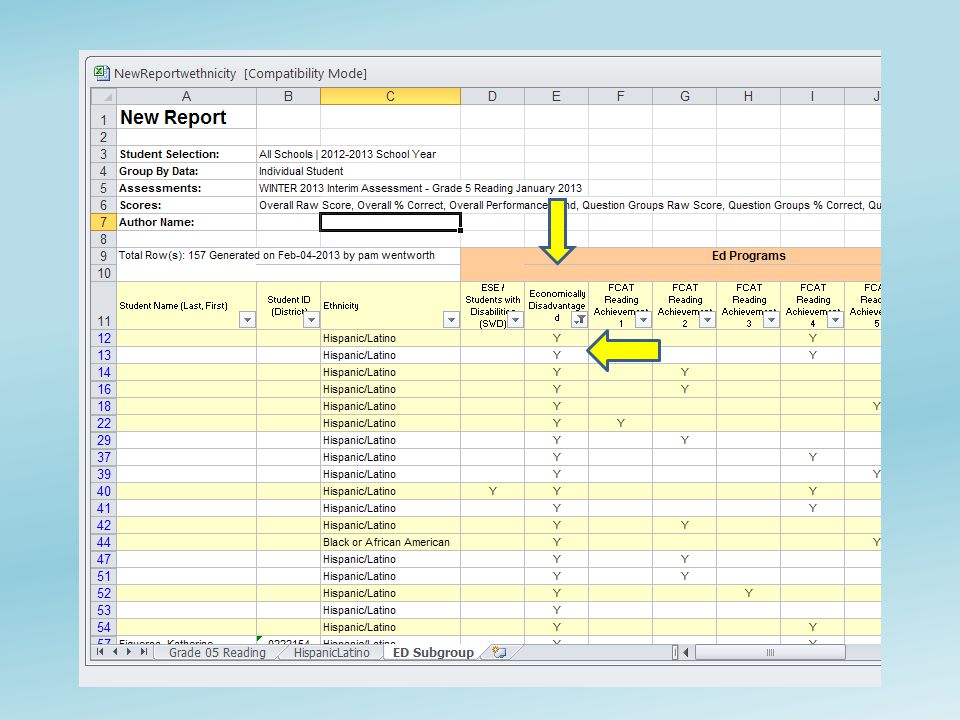
Let’s Let’s start with the ECONOMICALLY DISADVANTAGED Subgroup

41
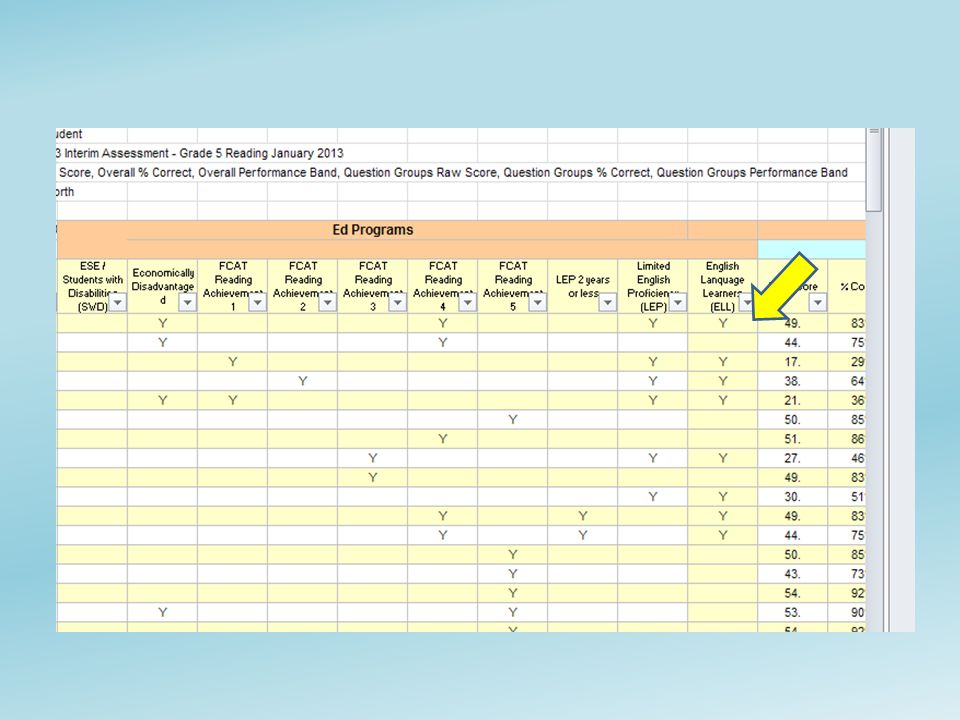
ELL is done differently…

42
Insert a new column We need to combine the results of columns K and L

43
Name the new column.

44
You will type a formula in the first cell under the title in the new column… When you start to type in the cell, a formula bar will appear. You may continue the formula in the formula bar.

45
=IF(K13=”Y”,”Y”,IF(L13=“Y”,”Y”,””)) This is a nested IF statement that says “if either column J or column K contains a Y, then there will be a Y in column L. If not, column L will be blank”. Let’s look at the formula you will type: TYPE Click on cell of first column you want to combine TYPE Click on cell of second column you want to combine TYPE

46
Press F4 KEY 3 times Start by clicking in the first box under the column title and typing =IF( Next, click on the cell under the title LEP 2 Years or less =IF(K13=“Y”,”Y”,(L13=“Y”,”Y”,””)) =IF($K13=“Y”,”Y”,($L13=“Y”,”Y”,””)) =IF( To lock the columns, use the F4 Key
) =IF($K13= Y , Y ,($L13= Y , Y , )) =IF( To lock the columns, use the F4 Key")
47
Double click Hover over the right bottom corner of the first cell in the new column until an + appears… To copy the formula for the whole column….

49
To check if your formula is correct, select a cell and check to see that the row and column referenced are correct….

50
From the 2012-2013 SIP Mid-Year Narrative Report: Question #3. Utilizing data from the reading baseline and mid- year assessments describe the changes to instruction, strategies, and/or school improvement activities that will be made prior to the administration of the FCAT 2.0 to ensure that students scoring FCAT 2.0 Levels 1 or 2 increase achievement to making satisfactory progress (FCAT 2.0 Level 3). Please be specific for each grade level and/or subgroup.
. Please be specific for each grade level and/or subgroup..")
55
Filter the column for Economically Disadvantaged so that you only have ED students showing.

56
Now choose FCAT Reading Level 5

60
Save the changes you made to your EXCEL file…

61
Repeat for Levels 4 and 3

62
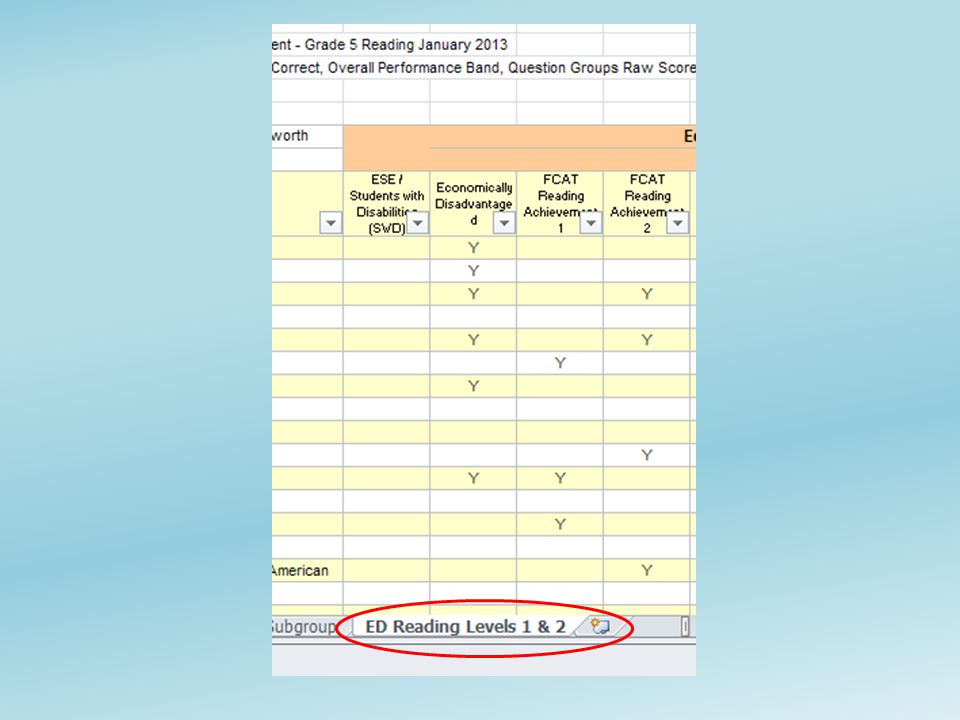
You now have a file that lists the ED students who are in Levels 1 & 2

63
Moving to the right hand side of the slide shows performance of each student and the Reporting Categories.

64
Save the changes you made to your EXCEL file…

65
Use the Excel files to address Questions 3-5 for Subgroup FCAT Levels on the SIP Mid- year Narrative Report.

66
Ms. Linda Fife 305-995-2692 lfife@dadeschools.net Ms. Pamela Wentworth 305-995-1520 pwentworth@dadeschools.net Ms. Pamela Wentworth 305-995-1520 pwentworth@dadeschools.net

Similar presentations