Download presentation
Presentation is loading. Please wait.

1
Ecology Biomes and Ecosystems

2
2 Ecosystems- Matter and Energy

3
3 Primary Production http://www.bigelow.org/foodweb/chemosynthesis.jpg

4
4 Visualizing Matter & Energy There are a variety of diagrams that help us visualize how energy, biomass, matter, and even number of organisms interact in a particular community or ecosystem. It is important that you look carefully at the diagrams and understand what it says about that ecosystem in terms of matter and/or energy.

5
5 Primary Production made by Primary Producers Gross primary productivity is the total amount of energy that producers convert to chemical energy in organic molecules per unit of time. Then the plant must use some energy to supports its own processes with cellular respiration such as growth, opening and closing it’s stomata, etc. What is left over in that same amount of time is net primary productivity which is the energy available to be used by another organism.

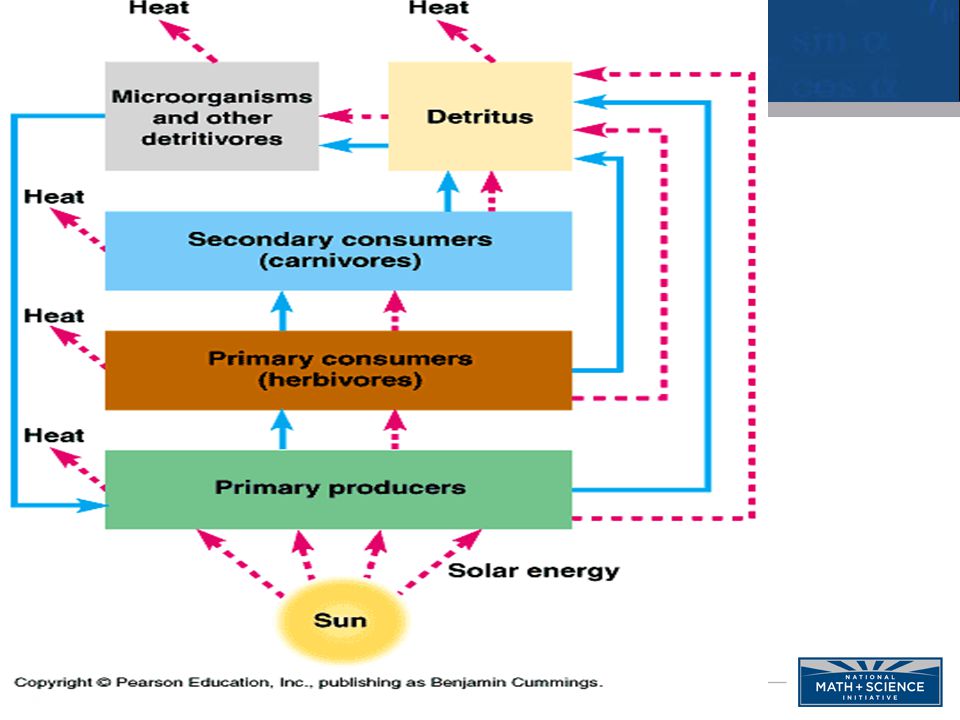
6
Primary Production 6

7
Net Product Pyramid 7

8
Trophic Level Human Population 8

9
I think this slide should go up with the other pyramid slides even though it’s about populations 9 Biomass Pyramids

10
Pyramid of Numbers 10

12
Energy Transformation 12

13
Biogeochemical Cycle 13

14
Nitrogen Cycle 14

15
Phosphorus Cycle 15

16
Water Cycle 16

17
Carbon Cycle 17

18
Nutrient Cycling 18

19
19

20
20 http://www.theenergylibrary.com/files/images/Energy_Allocation.screen.jp g

21
21 Now that we have examined the flow of energy and the cycling of matter, let’s examine biomes from the biosphere.

22
Aquatic Biome Distribution 22

23
Lake Stratification 23

24
Zonation 24 Marine Zonation Lake Zonation

25
Freshwater 25

26
Wetlands & Estuaries 26 Transitional Zones between freshwater and marine. This water tends to be a mix of both depending on its geographic location. The water is often referred to as brackish

27
Tide Zone 27 Coral Reef Benthos Marine Biomes Black Smoker

28
Terrestrial Biomes 28

29
Tropical Rain Forest 29

30
Savanna 30

31
Desert 31

32
Chaparral- also called Scrubland 32

33
Temperate Grasslands 33

34
Temperate Forest 34

35
Taiga Also called Coniferous or Boreal Forest 1. precipitation usually snow 2. conifers like spruce, fir, hemlock 3. soil acidic and forms slowly 35

36
Tundra 36

37
Biosphere 37

38
What happens when a cycle is out of balance? 38 Cycles can have an anthropogenic (man-made) or a non- anthropogenic (natural phenomena) impact that causes a cycle to become unbalanced. Additionally, this may just be the natural state of that ecosystem as a consequence of the availability of nutrients. Two examples involving imbalanced freshwater habitats include: Oligotrophic waters- low primary productivity Eutrophic waters- high primary productivity
 or a non- anthropogenic (natural phenomena) impact that causes a cycle to become unbalanced. Additionally, this may just be the natural state of that ecosystem as a consequence of the availability of nutrients. Two examples involving imbalanced freshwater habitats include: Oligotrophic waters- low primary productivity Eutrophic waters- high primary productivity.")
39
Eutrophic 39 Oligotrophic Lake

40
Eutrophication- The Algal Bloom 40

41
Experimental Data 41 Use the Station 1 data to calculate the Primary Productivity of a water sample. Report your answer in units of mg Carbon fixed/Liter The needed conversion factors are found on the student formula sheet

42
Answers to Previous Slides 42 Station 1 4.2 mg O 2 /L 0.698 = 2.9 mL O 2 /L 2.9 mL O 2 /L 0.526= 1.6 mg Carbon fixed/L

43
Created by: Susan Ramsey VASS Notable contributions by S. Meister

Similar presentations


 l temperature l light l water l nutrients l wind l disturbance l Biotic (living) l.>")


