Download presentation
Presentation is loading. Please wait.

1
HS 202: ECONOMIC DEVELOPMENT:PROBLEMS AND POLICY
Mrinal K. Dutta, Dept. of Humanities and Social Sciences, IIT Guwahati, Assam, India. Indian Institute of Technology Guwahati

2
Development Economics
Relatively new branch of economics Development - Post World War II Phenomenon Broader than traditional economics Concerned with developing economies Which are the developing countries?

3
Economic Development? Traditional economic measures GNP (5%-7%)
PCI (Real)-> economic well being Planned alteration of structure of production and employment Casual reference to non-economic social indicators Belief in “trickle down effect”
-> economic well being. Planned alteration of structure of production and employment. Casual reference to non-economic social indicators. Belief in trickle down effect")
4
Economic Development? The new economic view of development
Mahbub ul Haq: “The problem of development must be defined as a selective attack on the worst forms of poverty. Development goals must be defined in terms of progressive reduction and eventual elimination of malnutrition, disease, illiteracy, squalor, unemployment and inequalities Dudley Seers Redistribution from growth underdevelopment is more than just statistics development is a multidimensional process

5
Economic Development? Three core values of development
sustenance: Ability to meet the basic needs self-esteem: to be a person freedom from servitude: to be able to choose

6
Economic Development? The three objectives of development
To increase availability and improvements in the distribution of food, shelter, health, protection, etc. To improve ‘levels of living,’ including higher incomes, more jobs, better education, etc. To expand the range of economic and social choices available to individuals and nations

7
Defining the Developing World
On the basis of PCI #The UN’s System #World Bank’s System -208 economies are ranked by GNI per capita -Low-Income countries (LIC), Lower-middle income (LMC), Upper-middle income (UMC), high income OECD and other high-income countries
, Lower-middle income (LMC), Upper-middle income (UMC), high income OECD and other high-income countries.")
8
Defining the Developing World
-LIC (PCGNI in 2000): $755 or less LMC (do): $756-$2,995 UMC (do): $2,996-9,265 High Income (do): $ 9,266 or more The UNDP’s Human Development Index On the basis of degree of international indebtedness (WB)
: $755 or less. LMC (do): $756-$2,995. UMC (do): $2,996-9,265. High Income (do): $ 9,266 or more. The UNDP’s Human Development Index. On the basis of degree of international indebtedness (WB)")
11
The Developed and Developing World, 2002
Figure 1.1 The Developed and Developing World, 2002

12
Figure 2.1 The Developed and Developing World, 2002 cont’d

13
The Structural Diversity of Developing Economies
Size and income level Geographical Area, Population, National income per capita

15
The Structural Diversity of Developing Economies
Size and income level Historical background -colonial past Physical (land, mineral and other raw materials) and human resources (no. of people and their level of skill) Relative importance of public and private sectors Industrial structure -Farming not merely an occupation, but a way of life
 and human resources (no. of people and their level of skill) Relative importance of public and private sectors. Industrial structure. -Farming not merely an occupation, but a way of life.")
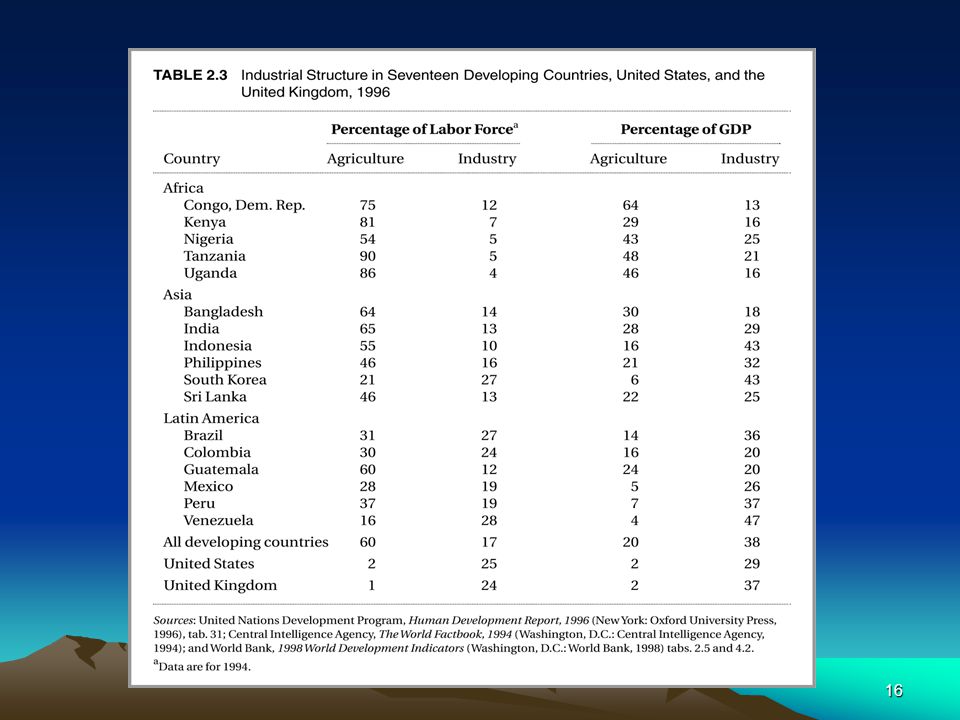
17
The Structural Diversity of Developing Economies
Industrial structure External dependence -Economic, political and cultural (related with its size, resource and political history) Political structure, power, and interest groups -Large landowners, urban industrialists, bankers, etc. Size and income level Historical background Physical and human resources Relative importance of public and private sectors
 Political structure, power, and interest groups. -Large landowners, urban industrialists, bankers, etc. Size and income level. Historical background. Physical and human resources. Relative importance of public and private sectors.")
18
Common Characteristics of Developing Nations
Low levels of living Manifested both quantitatively and qualitatively Per capita national income PPP method

19
Figure 1.2 Per Capita Gross National Product in Selected Countries, 1997 (in U.S. dollars at official exchange rates)
.")
21
Common Characteristics of Developing Nations
Low levels of living Per capita national income Relative growth rates of national and per capita income

23
Common Characteristics of Developing Nations
Low levels of living Per capita national income Relative growth rates of national and per capita income Distribution of national income Income inequality very high and widening Poorest 40% vs. richest 20% Brazil, Columbia, Kenya, South Africa- High China, India Malaysia- Moderate Taiwan, Indonesia, South Korea- Low

25
Common Characteristics of Developing Nations
Low levels of living Per capita national income Relative growth rates of national and per capita income Distribution of national income Extent of poverty Absolute poverty International Poverty Line (US $370)
")
27
Common Characteristics of Developing Nations
Low levels of living Per capita national income Relative growth rates of national and per capita income Distribution of national income Extent of poverty Health Life expectancy (98): 48 yr. (Least Developed) 63 yr. (other developing) 75 yr. (developed) Infant Mortality Rate
: 48 yr. (Least Developed) 63 yr. (other developing) 75 yr. (developed) Infant Mortality Rate.")
28
Figure 1.3 Infant Mortality Rates in Selected Countries, 1998 (per 1,000 live births)
")
30
Common Characteristics of Developing Nations
Low levels of living Per capita national income Relative growth rates of national and per capita income Distribution of national income Extent of poverty Health Education The Human Development Index

31
Common Characteristics of Developing Nations
Low levels of living: -Low levels and slow growth rates of national income -Highly skewed patterns of income distribution. Top 20% receiving 5 to 10 times as much of the bottom 40% -Up to 1.3 billion people living on income less than $370per year -Low life expectancy, Ill health, malnutrition, diseases, high infant mortality rates -Low levels of literacy, high school dropout rate

32
Common Characteristics of Developing Nations
Low levels of living Low levels of productivity -Labour productivity * Law of Diminishing Marginal Productivity * Lack of complementary factors such as physical capital or experienced management * Mobilisation of domestic savings and foreign finance * Institutional Changes * Attitude towards work

33
Common Characteristics of Developing Nations
Low levels of living Low levels of productivity High rates of population growth and dependency burdens Natural growth and migration Birth rate: 30-40/1000 (LDC) Avge. rate of population growth: 1.6% (LDC)
 Avge. rate of population growth: 1.6% (LDC)")
35
Common Characteristics of Developing Nations
Low levels of living Low levels of productivity High rates of population growth and dependency burdens Substantial dependence on agricultural production and primary exports

37
Figure 1.4 Composition of World Exports (percentages of primary and manufactured products)
")
38
Common Characteristics of Developing Nations
Low levels of living Low levels of productivity High rates of population growth and dependency burdens Substantial dependence on agricultural production and primary-product exports

39
Common Characteristics of Developing Nations
Low levels of living Low levels of productivity High rates of population growth and dependency burdens Substantial dependence on agricultural production and primary-product exports Technological Backwardness Lack of R&D institutions, weak communication system, lack of capital Technological choice dictated by poverty

40
Common Characteristics of Developing Nations
Low levels of living Low levels of productivity High rates of population growth and dependency burdens Substantial dependence on agricultural production and primary-product exports Technological Backwardness Prevalence of imperfect markets

41
Prevalence of imperfect markets
Move towards market economies in 1980s and 90s Market economies and market friendly policies depend heavily on existence of institutional, legal and cultural prerequisites Legal system, stable and trustworthy currency, infrastructure of roads and utilities, developed system of banking and insurance, formal credit markets, market information for consumers and producers, and norms of behaviour that facilitate long term trade

42
Common Characteristics of Developing Nations
Low levels of living Low levels of productivity High rates of population growth and dependency burdens Substantial dependence on agricultural production and primary-product exports Technological Backwardness Prevalence of imperfect markets Dependence Others Social life Transfer of values, Demonstration Effect Brain Drain

43
Human Development Index (HDI)
United Nations Development Programme. Initiated in 1990 Range: 0 to 1 Three goals of development: -Longevity: measured by life expectancy at birth -knowledge: measured by weighted average of adult literacy and mean years of schooling, -standard of living: measured by real per capita income adjusted for PPP.

44
Human Development Index (HDI)
HDI═ 1/3(Income index)+ 1/3 (Life expectancy index) + 1/3 (Education index) Education index ═ 2/3 (adult literacy index)+ 1/3 (gross enrolment index) HDI reveals that a country can do much better than might be expected at a low level of income, and that substantial income gains can still accomplish relatively little in human development
+ 1/3 (Life expectancy index) + 1/3 (Education index) Education index ═ 2/3 (adult literacy index)+ 1/3 (gross enrolment index) HDI reveals that a country can do much better than might be expected at a low level of income, and that substantial income gains can still accomplish relatively little in human development.")
45
Human Development Index (HDI)
Some criticisms: Gross enrolment (No dropout) Equal weight to all three variables Role of quality. Healthy extra year of life Quality of schooling
 Equal weight to all three variables. Role of quality. Healthy extra year of life. Quality of schooling.")
48
Concepts for Review Absolute poverty Brain drain Crude birthrate
Death rate Dependency burden Developed world Foreign exchange Gross domestic product (GDP) Gross national product (GNP) Human Development Index (HDI) Imperfect markets Income gap Income inequality Incomplete information
 Gross national product (GNP) Human Development Index (HDI) Imperfect markets. Income gap. Income inequality. Incomplete information.")
49
Concepts for Review, cont’d
Infant mortality rate International poverty line Labor productivity Least developed countries (LLDCs) Levels of living Low income countries (LICs) Malnutrition Mixed economic systems Physical resources
 Levels of living. Low income countries (LICs) Malnutrition. Mixed economic systems. Physical resources.")
50
Concepts for Review, cont’d
Production function Purchasing power parity (PPP) Resource endowment World Bank
 Resource endowment. World Bank.")
Similar presentations


 or other measure of aggregate income, typically reported as the annual rate.>")


![Why is Economic Development so Difficult? [2 – June 12 2003]](/13/4157556/big_thumb.jpg "Why is Economic Development so Difficult? [2 – June 12 2003]>")


