Download presentation
Presentation is loading. Please wait.

1
GSB Library Atrium Analysis
John Brooks Richard Jones Reid Senescu Min Jae Suh Matt Yamasaki

2
Options Base No Basement Skylights Alternate Basement Skylights

3
Options Base No Basement Skylights Alternate Basement Skylights

4
Potential Advantages of Skylight
Plus Minus Structure None expected Other beams bigger. Larger lateral deflections. More complex gravity framing Energy More natural ventilation, less cooling load Bigger temp. difference between bottom and top of library Less insulation, could create more heating/cooling load Lighting More daylighting, .less energy Potential glare, sunshine on books Acoustics Louder, less sound absorbing material CFD Nat. Ventilation better in the summer Airflow from doors could decrease comfort in winter Cost Lower life cycle cost Higher first cost, because of less homogenous design Schedule Added scope, longer duration

5
Outline Structure Lighting Acoustics Schedule, 4D Cost Energy Analysis
CFD Sample Money Slide Challenges and Resolutions For each tool: Assumptions Metrics Results

6
Static Load Conditions
Dead Load Live Load Earthquake IBC 2006: Inputs are fixed. Wind ASCE 7-02 Wind Loading Applied to all area objects Wind speed = 100 mph Unknown Inputs: importance factor, exposure type, topographical factor, gust factor, directionality factor

7
Model Analysis Analysis Goal Analysis Parameter
Determine maximum moments & deflections under given loading conditions Determine demand capacity ratios for all members Analysis Parameter Dimensions of members Joints: Releases Materials Loads: Load combinations

8
Revit Structure Regenerate Revit Architecture model

9
ETABS Import Revit model Correct geometric errors
Define “dummy surfaces” Define additional load parameters & combinations Analyze

10
Analysis Result ETABS generates shear, moment, deflection and demand capacity data on structure.

11
Earthquake Displacements
Displacements in original design due to earthquake are excessive. Possibly due to invalid inputs. 11 11

12
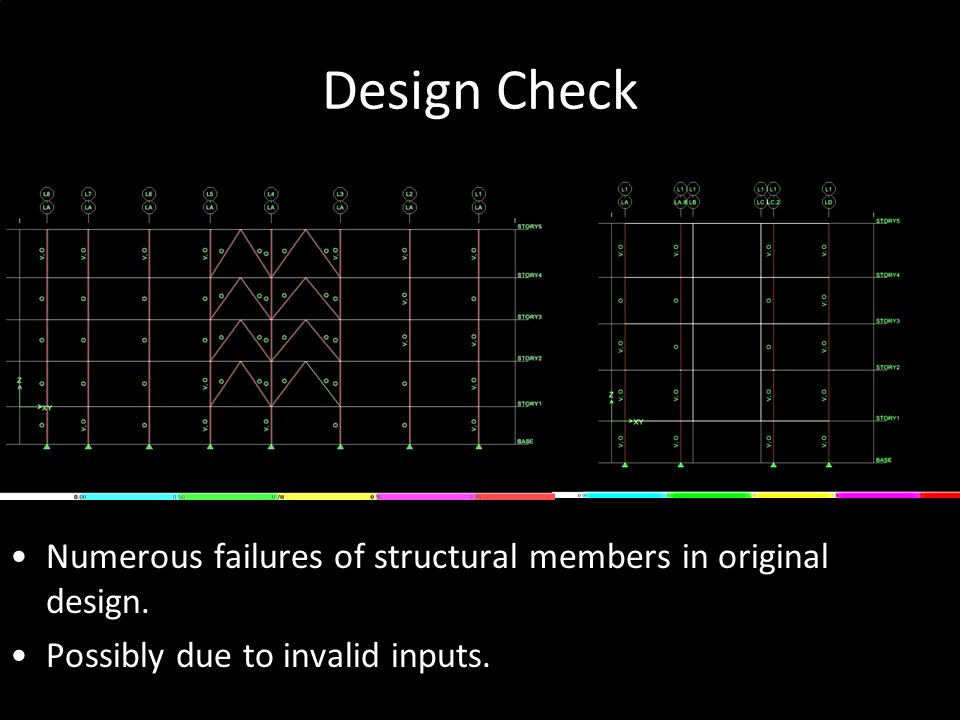
Design Check Numerous failures of structural members in original design. Possibly due to invalid inputs. 12 12
13
Lighting - Occupant Behavior
Occupied 8 AM to 5 PM Min. Illuminance: 500 lux Active and Passive light switching and blind use Manual on/off switch near door Installed lighting power density 1.5 W/SF

14
Lighting – Analysis Assumptions
Time Step: 30 minutes Ground Reflectance: 0.2

15
Lighting – Metrics Units Measurement -3 3 Daylighting Aesthetics
3 Daylighting Aesthetics unitless My opinion Claustro-phobic ok beautiful Lighting Cost Dollars / SF Energy $3410 $1746 $737 Lighting Quality % of sensors Continuous Daylight Factor > 40% 0% 40% 90%

16
Skylights provide more light…
Annual Light Exposure (lux hours) Base No Basement Skylights Alternate Basement Skylights
 Base. No Basement Skylights. Alternate. Basement Skylights.")
17
Not much direct light… Alternate Basement Skylights December 21, 2008
December 21, 2008, 2:00 PM

18
Not much direct light… Alternate Basement Skylights
December 21, 2008, 2:00 PM

19
Lighting Results For Base and Alternate:
Total Electric Lighting Energy: 3.5 kWh/SF Average Office Building Energy: 2.6 kWh/SF Daylight Autonomy: 0% % of the year when a minimum illuminance threshold is met by daylight alone 0% of sensors have Daylight Factor > 2% ratio of internal to external illuminance. Base Alternate % of sensors with Continuous Daylight Autonomy >40% 0% 11%

20
Next Steps For Base and Alternate:
WHY? For Base and Alternate: Total Electric Lighting Energy: 3.5 kWh/SF Average Office Building Energy: 2.6 kWh/SF Daylight Autonomy: 0% % of the year when a minimum illuminance threshold is met by daylight alone 0% of sensors have Daylight Factor > 2% ratio of internal to external illuminance. WHY? WHY? Base Alternate % of sensors with Continuous Daylight Autonomy >40% 0% 11%

21
Information Goal Models Metrics
What is a different acoustics after designing 3 skylights on the ground floor & basement? (Influence of 3 skylights to the ground floor & basement) Models Baseline: Original GSB Atrium Option: GSB Atrium with 3 skylights on the ground floor Metrics Two different models (Base vs. Option) Each different volume and surface of models (2,735m³ vs. 5,270m³ ) 21 21
 Models. Baseline: Original GSB Atrium. Option: GSB Atrium with 3 skylights on the. ground floor. Metrics. Two different models (Base vs. Option) Each different volume and surface of models (2,735m³ vs. 5,270m³ )")
22
Assumption Material Condition (Fixed)
No influence from outside weather and noise 22 22

23
Assumption(Cont) Sound Condition
Setup 1 speaker instead of noise for the each analysis No influence from existing the upper floors or not No influence of the components and equipments except 50 clothe-covered chairs Twice bigger volume due to the skylights in option Consider only Sabine Algorithm for Reverberation time

24
Base vs. Option Sound Path (Low Frequency: 63Hz) BASE: 21.7ms
OPTION: 18.5ms

25
Base vs. Option(Cont) Sound Path (High Frequency: 16KHz) BASE: 17.4ms
Option: 15.7ms

26
Base vs. Option(Cont) Base Reverberation Time
 Base Reverberation Time")
27
Base vs. Option(Cont) Option Reverberation Time
 Option Reverberation Time")
28
Base vs. Option(Cont) Base Acoustic Response 63Hz: 47ms 16KHz: 47ms
 Base Acoustic Response 63Hz: 47ms 16KHz: 47ms")
29
Base vs. Option(Cont) Option Acoustic Response 63Hz: 89ms 16KHz: 95ms
 Option Acoustic Response 63Hz: 89ms 16KHz: 95ms")
30
Base vs. Option(Cont) Result 63Hz 16KHz Base Option Elapsed Time
21.7ms 18.5ms Sound Type Direct/Masked Base Option Elapsed Time 17.4ms 15.7ms Sound Type Direct/Masked

31
Base vs. Option(Cont) Result Base Option RT Value 500ms~690ms
Ideal RT Value 800ms~1750ms 1000ms~1900ms Estimated Decay 63Hz: 47ms 63Hz: 89ms 16KHz: 47ms 16KHz: 95ms

32
Conclusion The RT of option model is in the ideal pink area, but the RT of base model is below the area. The volume and surface of base model is easy to absorb the sound rays. There is no influence by 3 skylights to the basement 3 Skylights change the result a little bit, but make a better acoustic condition at the ground floor. Better RT result The base model has a longer elapsed time to completely disappear. The volume and the surface area bring a big different criteria for ideal condition. Ideal Pink Area: 800ms~1750ms vs. 1000ms~1900ms

33
For the next step Simulate the model with several different noise directions. Figure out the scale of preference about estimated decay time Find out other metrics to achieve a better result.

34
Costs, Schedule

35
Assumptions Building Explorer is right U.S. Average Building Index ok
Automatically generated schedule ok

36
Results

37
Material Costs

38
Labor Costs $

39
Equipment Costs $33.82

40
Schedule + 4D 4-Day Duration…

41
Day 1

42
Day 2

43
Day 3

44
Day 4

45
Energy Analysis Goal: To determine energy consumption of building
To determine if natural ventilation will be sufficient

46
Energy Analysis IES Virtual Environment ApacheSim
Simulates natural and mixed ventilation (MacroFlo) Simulates building loads (ApacheLoad) Simulates heat loss/gain (ApacheCalc)
 Simulates building loads (ApacheLoad) Simulates heat loss/gain (ApacheCalc)")
47
Energy Analysis Assumptions: Model inputs Simulation
HVAC System: Mixed System w/ natural ventilation Weather file: Moffett Field, Mountain View, CA Building type: Library Building construction: default room system Thermal condition: Atrium Each Floor Fluorescent lighting – 1.5W/SF People 65 from 10am-12am Simulation Run period: 1 May to 31 May Time step: 10 minutes Report interval: 60 minutes Preconditioning: 10 days

48
Energy Analysis Results
Carbon Emissions CO2 emissions – base case Total monthly emissions – 35,027 lbCO2 CO2 emissions – alternative case Total monthly emissions – 46,587 lbCO2

49
Energy Analysis Results
Energy Consumption Energy Consumption – Base case Monthly total – MMBtu Energy Consumption – Alternative case Monthly total – MMBtu

50
Energy Analysis Results
Heating/Cooling Loads Daily Heating and Cooling Loads – base case Monthly total – heating: MMBtu; cooling: 0MMBtu Daily Heating and Cooling Loads - alternative Monthly total – heating: MMBtu; cooling: MMBtu

51
Energy Analysis Results
Room analysis – Stacks Peak hourly room loads Room environmental conditions Alternative Case Base Case

52
Energy Analysis Next Step More accurately capture behavior of building
Determine actual operating hours Determine actual HVAC system Type, set points, etc Create more accurate geometry

53
CFD Analysis CFD: Computational Fluid Dynamics
Analysis of fluid flows using numerical methods and algorithms Simulation of wind tunnel performance

54
CFD Analysis IES Virtual Environment MicroFlo (IES VE)
Numerical simulation of air flow an heat transfer User definable obstructions Interoperability with Virtual Environment model

55
CFD Analysis Goals: Determine effects of atrium on airflow in building
Predict occupant comfort Temperature gradient in rooms Air velocity

56
CFD Analysis Model inputs: Model outputs:
Boundary Conditions defined during energy analysis Obstructions and heat generating component Ex: People, computers, radiators, etc Model outputs: Air flow temperature, direction, and velocity Graphical displays of temperature gradient and air flow properties

57
CFD Analysis Progress Problems with importing gbXml geometry
Inconsistencies developed between Revit and IES

58
CFD Analysis Next Step Manipulate Revit model to properly represent geometry in IES Contact with IES tech support as well as Ben Welle

59
Sample MACDADI Goodness

Similar presentations


;>")


