Download presentation
Presentation is loading. Please wait.

1
Changing Demographics: Impacts to Oregon and the U.S. Are demographic changes taking place? –Changes in Racial / Ethnicity composition? Richard Bjelland OHCS State Housing Analyst (503) 986-0983 richard.bjelland@hcs.state.or.us
")
2
Presentation Definitions A person of Hispanic or Latino Ethnicity may be of any race Minority represents any of the following: –An individual of any race other than white only –A multiracial individual –A person of Hispanic or Latino Ethnicity Non-Minority or “white only” – A white only non-Hispanic or Latino person

4
Source: U.S. Census Bureau, International Data Base, Table 094

7
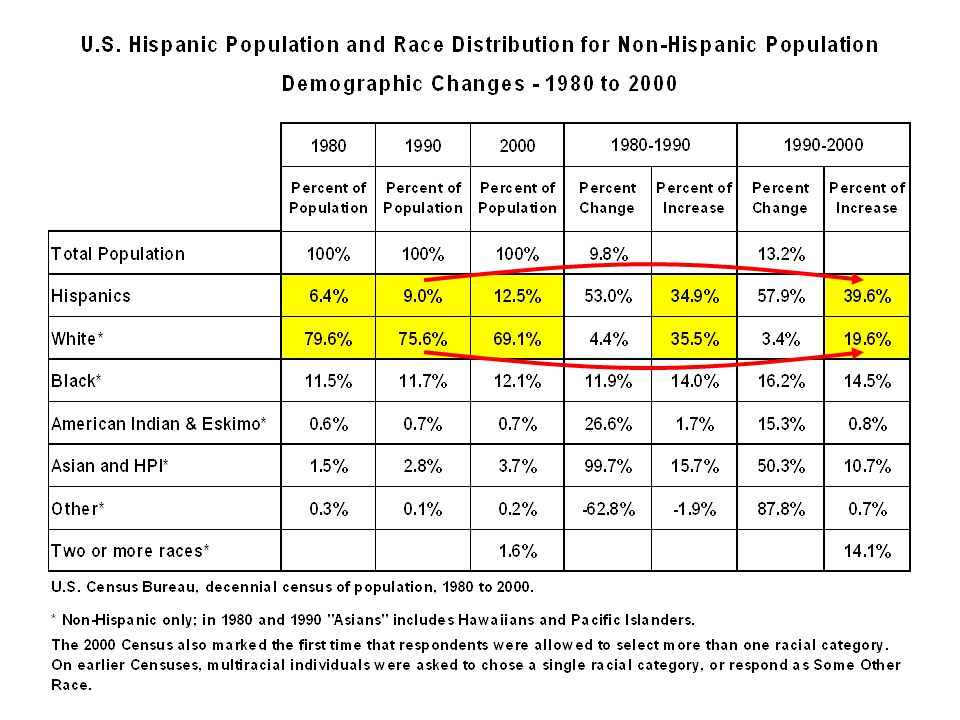
Source: U.S. Census Bureau, decennial census of population, 1980 to 2000.

8
Source: U.S. Census Bureau, decennial census of population, 1990 to 2000.

9
California Demographics In 1970, 4 in 5 Californians were white; now whites are in the minority – 44.5 % Only one in three children in California’s public schools is white; 45 % are Latino In Los Angeles, only 10 % are white; 70 % are Latino District F in LAUSD has 60,000 students; 98 % are minorities; and contains Belmont High School - 5,500 students with a 40 % graduation rate Education 101 - The Economist Print Edition, April 29th, 2004

11
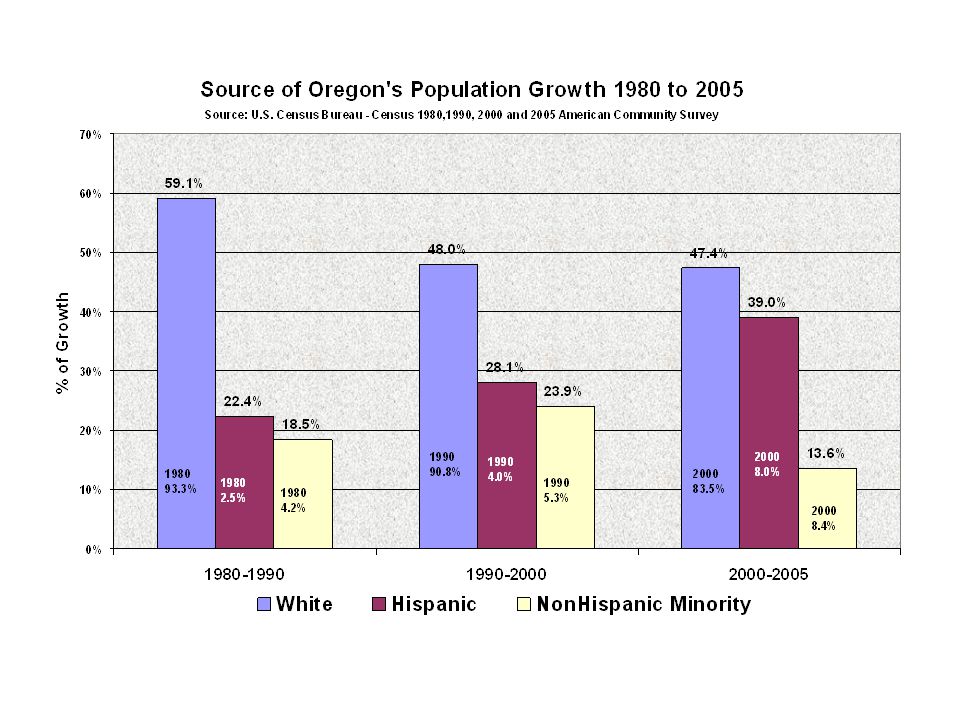
Source: U.S. Census Bureau, decennial census of population, 1980 to 2000.

13
51,094 Hispanic

14
-12%(46,080)
")
15
Oregon

16
Immigrants Disperse to New Growth States

17
Oregon’s Foreign Born as a percent of Total Population in 2000 - 8.5 % Percent change in the foreign-born population: 1990 -2000 - 108 % Percent Distribution of Oregon’s Foreign Born by Region

18
(10.5 million) 28% (11.5 million) 31% (11.1 million) 30% SOURCE: Pew Hispanic Center 2005 study (1.3 million) 3% (2.6 million) 7% in 2005
 28% (11.5 million) 31% (11.1 million) 30% SOURCE: Pew Hispanic Center 2005 study (1.3 million) 3% (2.6 million) 7% in 2005")
20
Source: U.S. Census Bureau, decennial census of population - 2000.

22
70% of Oregon’s population live in these 8 counties

24
Cumulative Estimates of the Components of Population Change by Race and Hispanic or Latino Origin for the United States: April 1, 2000 to July 1, 2005 Race and Hispanic or Latino origin Total population change* Natural Increase Net International Migration TotalBirthsDeaths TOTAL POPULATION14,985,8028,651,86121,329,80412,677,9436,333,941.One Race14,304,5008,048,54320,649,21612,600,6736,256,173..White9,748,4545,474,70216,288,56010,813,8584,274,278..Black or African American2,204,4701,710,5443,236,5571,526,013493,542..American Indian and Alaska Native199,150150,041209,15259,11149,171..Asian2,098,350682,925878,407195,4821,415,274..Native Hawaiian and Other Pacific Islander54,07630,33136,5406,20923,908.Two or more races681,302603,318680,58877,27077,768.Race alone or in combination:(1)..White10,370,3786,039,29716,917,72010,878,4234,331,515..Black or African American2,619,1272,098,7563,645,9281,547,172519,704..American Indian and Alaska Native228,539164,497267,035102,53863,893..Asian2,369,911905,8181,124,585218,7671,463,859..Native Hawaiian and Other Pacific Islander82,87646,83962,16015,32136,279 HISPANIC OR LATINO ORIGIN7,380,8464,123,2684,685,371562,1033,257,595 WHITE ALONE, NOT HISPANIC OR LATINO ORIGIN2,789,4411,601,51311,888,32010,286,8071,188,483 HISPANIC OR LATINO ORIGIN % of Change49.3%47.7%22.0%4.4%51.4% WHITE ALONE, NOT HISPANIC OR LATINO ORIGIN %18.6%18.5%55.7%81.1%18.8% (1) 'In combination' means in combination with one or more other races. The sum of the five race groups adds to more than the total population because individuals may report more than one race. Source: Population Division, U.S. Census Bureau

26
Changing Demographics: Impacts to Oregon and the U.S. Are demographic changes taking place? –Changes in Racial / Ethnicity composition? –Changes in Age and Sex Distributions?

27
Child-bearing years

28
Child-bearing years

29
Changing Demographics: Impacts to Oregon and the U.S. Are demographic changes taking place? What are impacts of demographic changes?

30
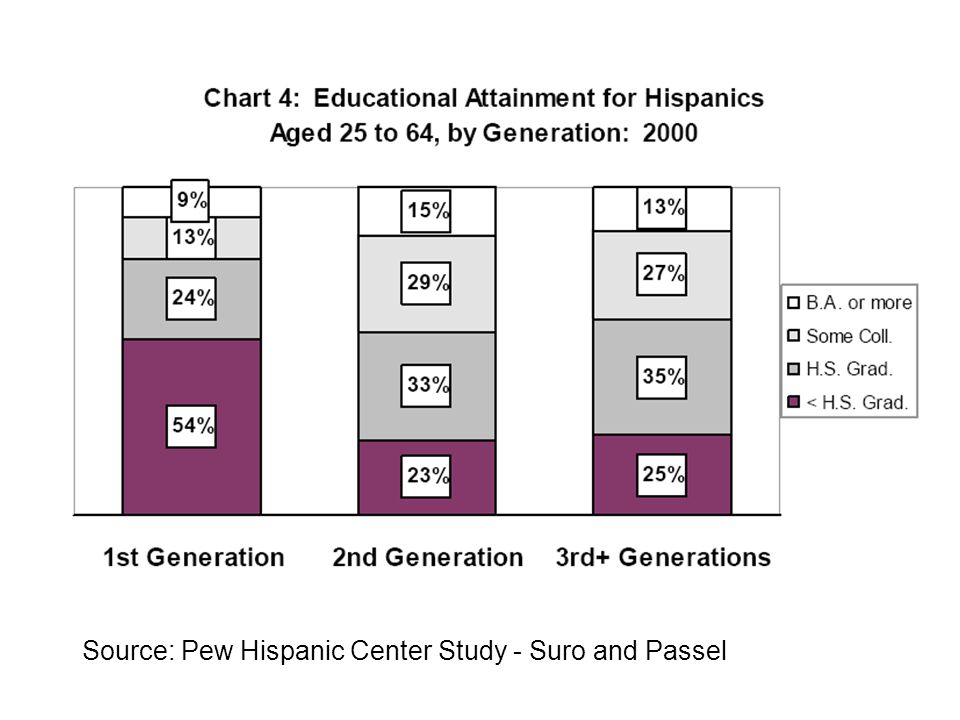
Source: Pew Hispanic Center Study - Suro and Passel

34
Changing Demographics Impacts on Educational Attainment An Example of Impacts Under the Following Assumptions Past High School Students High School Graduation Rate % Graduating High School % HS Graduates Obtaining College Degree % College Graduates of All High School Students % of All HS Students not Graduating High School Hispanic10%55%5.50%15%0.83%4.50% NH Minority10%70%7.00%25%1.75%3.00% White NH80% 64.00%40%25.60%16.00% Total100% 76.50% 28.18%23.50% Future (using California's current student ratios) Hispanic45%55%24.75%15%3.71%20.25% NH Minority22%70%15.40%25%3.85%6.60% White NH33%80%26.40%40%10.56%6.60% Total100% 66.55% 18.12%33.45% In this scenario * 36% decrease in percent graduating from college * 42% increase in percent of students not graduating high school
 Hispanic45%55%24.75%15%3.71%20.25% NH Minority22%70%15.40%25%3.85%6.60% White NH33%80%26.40%40%10.56%6.60% Total100% 66.55% 18.12%33.45% In this scenario * 36% decrease in percent graduating from college * 42% increase in percent of students not graduating high school")
35
The reality of Latino Youth in the United States Only 50% of the Latino Students graduate from high school. In Oregon the percentages are even lower. A Latino Youth that drops-out of High School earns around $6,500 dollars a year. Source: EducationTrust.org

36
US Labor supply, 1950 to 2000 and Projected Labor supply, 2000-2050 Labor Supply Change in millions in millions 1950 62.2 1960 69.6 7.4 1970 82.8 13.2 1980 106.9 24.1 1990 125.8 18.9 2000 140.9 15.1 2010 157.7 16.8 2020 164.7 7.0 2030 170.1 5.4 2040 180.5 10.4 2050 191.8 11.3 Source, 2000 to 2050, Toossi, MLR, May 2002, table 5; 1950-1990 http://www.census.gov/statab/hist/02HS0029.xls Baby boomers retire

37
Source: Pew Hispanic Center Study - Suro and Passel

40
101% 27%

41
Confidential and Proprietary. Copyright © 2007 by Educational Testing Service. All rights reserved. America’s Perfect Storm Irwin Kirsch ETS National Press Club Washington, D.C. February 5, 2007

42
Confidential and Proprietary. Copyright © 2007 by Educational Testing Service. All rights reserved. Three Forces Are Changing Our Nation’s Future Inadequate literacy and numeracy skills among large segments of our student and adult populations An ongoing shift in the demographic profile of our population, powered by the highest immigration rates in nearly a century The continuing evolution of the economy and the nation’s job structure, requiring higher levels of skills from an increasing proportion of workers

43
Confidential and Proprietary. Copyright © 2007 by Educational Testing Service. All rights reserved. Literacy surveys conducted by ETS have represented literacy along scales divided into 5 levels. National and international committees have judged that skills in Levels 3 and higher are needed for participation in modern societies. Less ProficientMore Proficient National Adult Literacy Survey (NALS, 1992)
.")
44
Confidential and Proprietary. Copyright © 2007 by Educational Testing Service. All rights reserved. 70 million increases to 119 million in 2030 Less ProficientMore Proficient Average literacy scores are expected to decline between 1992 and 2030, with an increase in the amount of inequality. Less ProficientMore Proficient

45
Confidential and Proprietary. Copyright © 2007 by Educational Testing Service. All rights reserved. Half of America’s adults lack literacy skills needed for the 21st century. All AdultsAsianBlackHispanic White 35 30 20 14 41 13 9 3 3 17 20 28 33 49 12 32 33 44 33 30 100 80 60 40 20 0 40 60 80 100 Percentage of Adults 16-65 Years Old at: Level 1Level 2Level 3Levels 4/5

46
Confidential and Proprietary. Copyright © 2007 by Educational Testing Service. All rights reserved. 197319892004% Change ALL$27,618$22,852$20,700-25 Education <12 yrs, no diploma22,68615,99816,000-30 HS diploma/GED30,81922,85421,000-32 13-15 years28,01826,75625,000 -9 Bachelor’s degree35,39036,56535,000 Master’s or higher40,82638,08845,00010 Note: Earnings are in 2004 dollars. Average earnings of men 20-29 years of age have decreased for all except those attaining the highest levels of education, resulting in greater inequality.

47
Major Demographic Impacts Racial/ethnic composition of public school students changing rapidly in Oregon Minority population generally less educated with lower earnings capacity White educated Baby Boomers begin retiring in 2010 Work force growth will mostly come from minority population - primarily Hispanic Federal and state revenue will be negatively impacted unless minority earnings increase Ratio of workers to retired persons is decreasing - putting pressure on retirement plan funding

48
Demographic Conclusions U.S./Oregon is rapidly changing from primarily a majority nation of white non-Hispanic persons to a racially and ethnically diverse population Hispanic/Latino and Asian populations are the fastest growing; white only beginning to decrease Hispanic/Latino population increases now account for half of U.S. population growth Planning and policy decisions in education, work force development, housing, social services, etc. need to anticipate and accommodate these changes

49
Changing Demographics: Impacts to Oregon and the U.S. Are demographic changes taking place? What are impacts of demographic changes? Where do Oregonians live? View this presentation at www.ohcs.oregon.gov/OHCS/PPR_Demogr aphics.shtml Richard Bjelland OHCS State Housing Analyst (503) 986-0983 richard.bjelland@hcs.state.or.us
")
Similar presentations


 981-4076>")


