Download presentation
Presentation is loading. Please wait.

1
PRESENTED BY THE DEMAREST ADMINISTRATIVE TEAM 2013-2014 Annual State of the Schools Assessment Report

2
2012-2013 Criterion Referenced Tests (CRTs)
")
3
Grade 1 Writing 2013 Average Spring Score Growth from Fall to Spring (Points) Growth from Fall to Spring (Percentage) 3.221.4278% This CRT is scored on a rubric from 1-4.
 Growth from Fall to Spring (Percentage) % This CRT is scored on a rubric from 1-4.")
4
Grade 2 Science 2013

5
Grade 3 Writing 2013 Average Spring Score Growth from Fall to Spring (Points) Growth from Fall to Spring (Percentage) 3.590.8933% This CRT is scored on a rubric from 1-5.
 Growth from Fall to Spring (Percentage) % This CRT is scored on a rubric from 1-5.")
6
Grade 5 Social Studies

7
Grade 6 Health

8
Grade 6 Study Skills (Pilot)
")
9
Grade 7 Science

10
Spring 2013 NJASK Results PARTIALLY PROFICIENT PROFICIENTADVANCED PROFICIENT 150-199200-249250-300

11
District Factor Group According to the NJDOE: District Factor Group - DFGs were first developed for the purpose of comparing students’ performance on statewide assessments across demographically similar school…the DFGs were calculated using the following six variables that are closely related to SES: % of adults with no high school diploma % of adults with some college education Occupational status Unemployment status % of individuals in poverty Median family income

12
GRADES 3-8 NJASK RESULTS

13
Language Arts Mathematics 3 rd Grade: 2013 NJASK

14
Language Arts Mathematics 4 th Grade: NJASK 2013

16
Language Arts Mathematics Current 5 th Grade Students

17
Language Arts Mathematics 5 th Grade: NJASK 2013

18
Language Arts Mathematics Current 6 th Grade Students

19
Language Arts Mathematics 6 th Grade: NJASK 2013

20
Language Arts Mathematics Current 7 th Grade Students

21
Language Arts Mathematics 7 th Grade: NJASK 2013

22
Language Arts Mathematics Current 8 th Grade Students

23
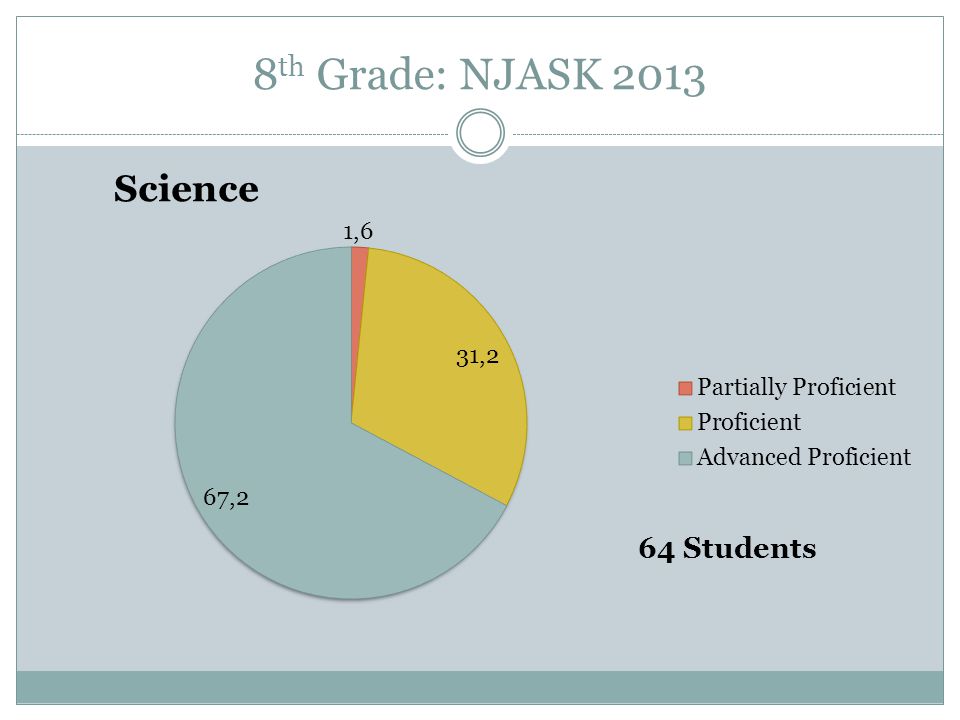
Language Arts Mathematics 8 th Grade: NJASK 2013

25
Language Arts Mathematics Current 9 th Grade Students

26
NOTABLE POINTS – BRAG BOARD DMS and LLE outperformed the state mean in all 76 of the tested categories. DMS equaled or outperformed the DFG in 45 out of the 49 categories (5 th Grade Math) LLE outperformed the DFG in 23 out of the 27 categories (3 rd and 4 th Grade Math).
 LLE outperformed the DFG in 23 out of the 27 categories (3 rd and 4 th Grade Math)..")
Similar presentations


 Core CRTs DWA UAA UBSCT NCLB U-PASS Alphabet Soup.>")
 Accountability “Chief school administrators shall.>")

 1 Hal Sanderson, Ph.D. Research and Assessment August 21, 2013 2013.>")

 Accountability “Chief school administrators shall.>")


>")

