Download presentation
Presentation is loading. Please wait.

1
Wisconsin Student Assessment System Grades 3, 4, 5, 6, 7 & 8 WSAS Test Proficiency Summary Report 1997 - 2008 Assessment Seminar #2

2
Limited Validity in Longitudinal Comparisons of the Proficiency Summary Results From the seminars presented in previous years, you already know that there is limited validity in comparing the proficiency summary results from 1997 – 2008 in a longitudinal manner due to the fact that cut scores have been changed, the testing has moved from the spring to the fall, the test items have been changed to align with the Wisconsin Standards, and, now, the type of test has changed to being a criterion-referenced measure (a new type of test than previously administered before). As a result, this DPI has again cautioned districts to remember, Proficiency data for 2001-2002 and earlier years are NOT comparable to proficiency data for 2002-2003 and later years. For Walworth, this means that we now truly have only three years of longitudinal data for comparison purposes.

3
GRADE 3 RESULTS (Reading and Math)
")
4
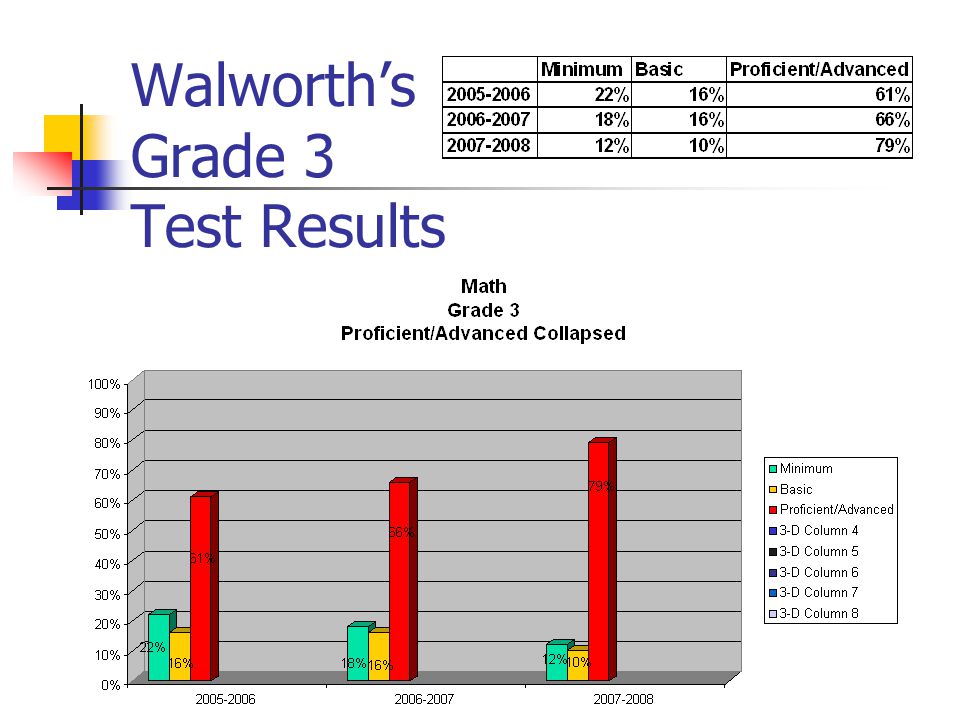
Walworth Grade 3 Test Results

6
Walworths Grade 3 Test Results

10
GRADE 4 RESULTS (Reading, Language Arts, Math, Science and Social Studies)
")
11
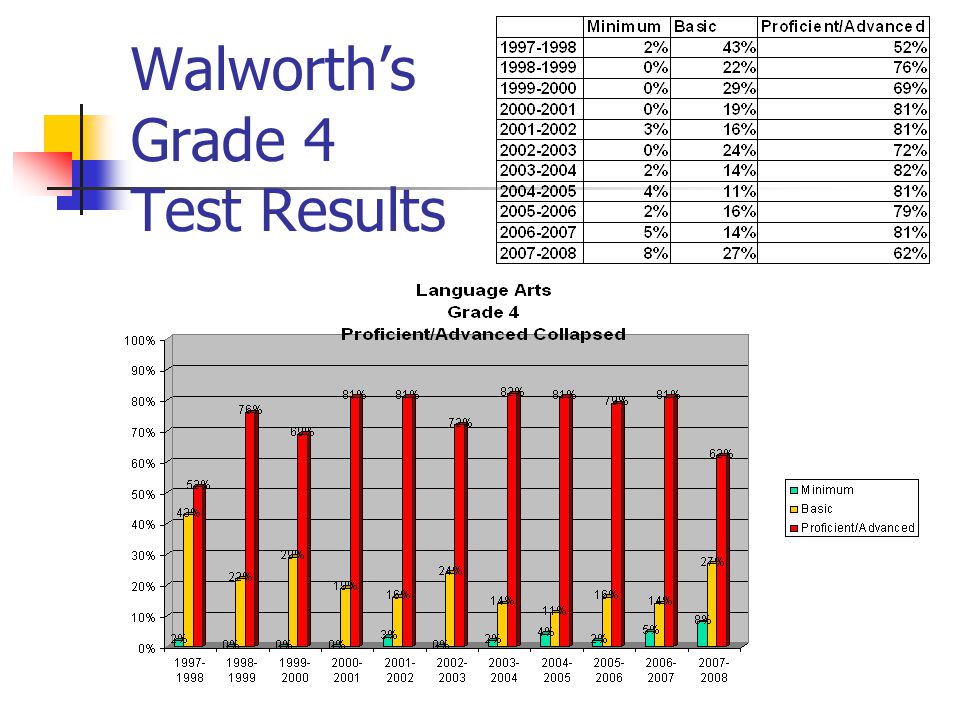
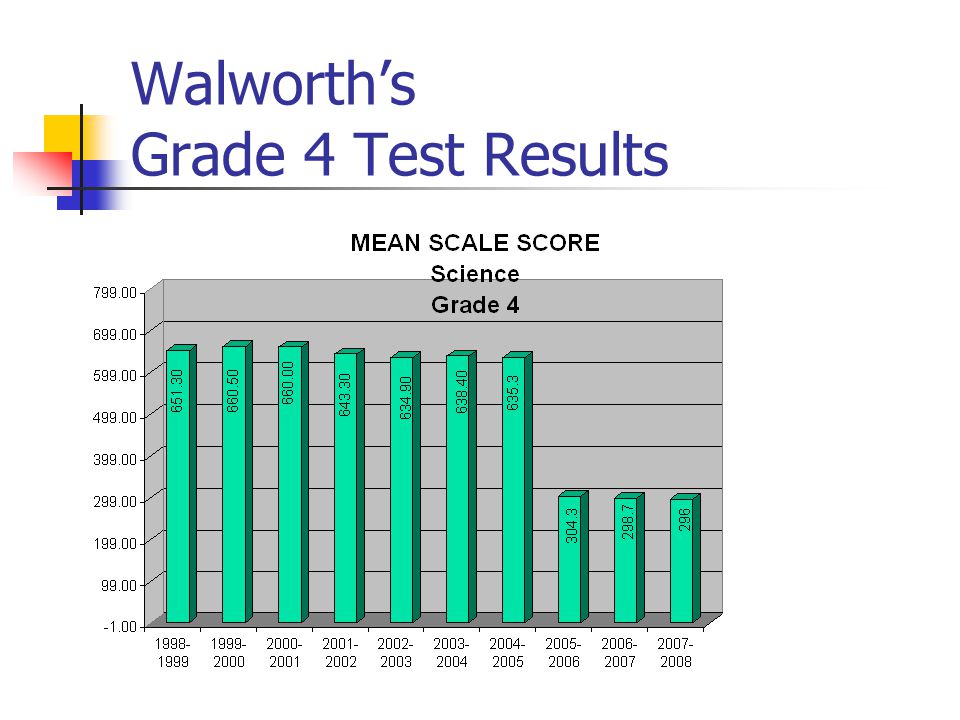
Walworth Grade 4 Test Results

13
Walworths Grade 4 Test Results

26
GRADE 5 RESULTS (Reading and Math)
")
27
Walworth Grade 5 Test Results

29
Walworths Grade 5 Test Results

30
Walworth Grade 5 Test Results

31
Walworths Grade 5 Test Results

33
GRADE 6 RESULTS (Reading and Math)
")
34
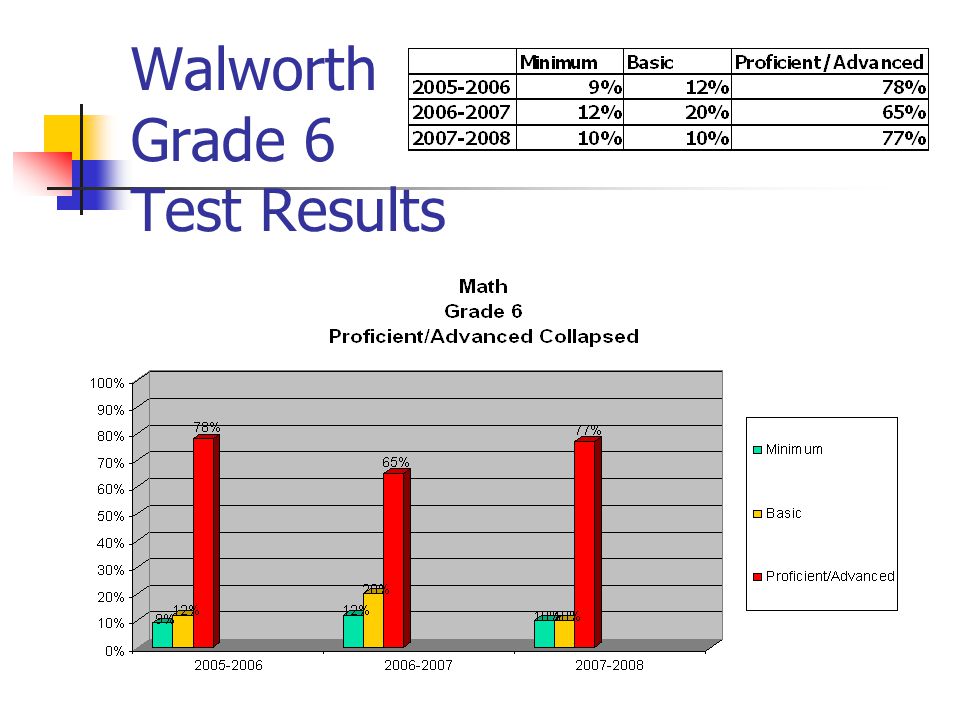
Walworth Grade 6 Test Results

36
Walworths Grade 6 Test Results

37
Walworth Grade 6 Test Results

39
Walworths Grade 6 Test Results

40
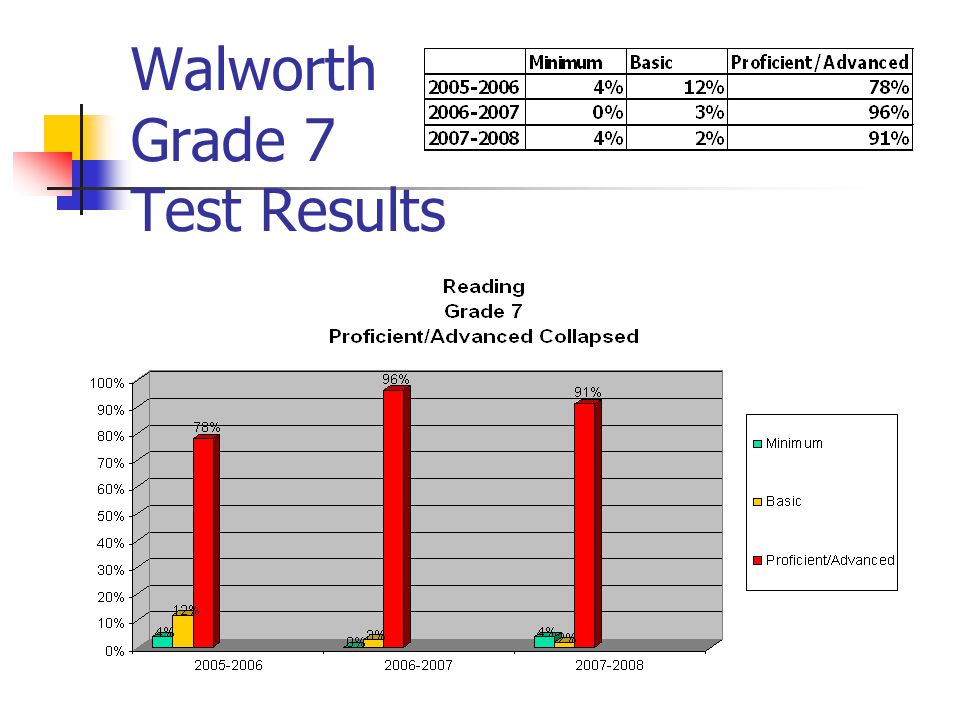
GRADE 7 RESULTS (Reading and Math)
")
41
Walworth Grade 7 Test Results

43
Walworths Grade 7 Test Results

44
Walworth Grade 7 Test Results

46
Walworths Grade 7 Test Results

47
GRADE 8 RESULTS (Reading, Language Arts, Math, Science and Social Studies)
")
48
Walworths Grade 8 Test Results

63
Understanding Test Results Test results show the average total score of the entire class for each subject Year-to-year comparisons of test scores shows the diversity between each class as a whole Each class is a unique entity; we do expect variation between classes Any one test should be viewed as just one assessment measure Test results are most meaningful when interpreted in a broad, longitudinal view; determining trends over time

Similar presentations


>")

 Spring 2009 California Standards Test.>")


