Download presentation
Presentation is loading. Please wait.

1
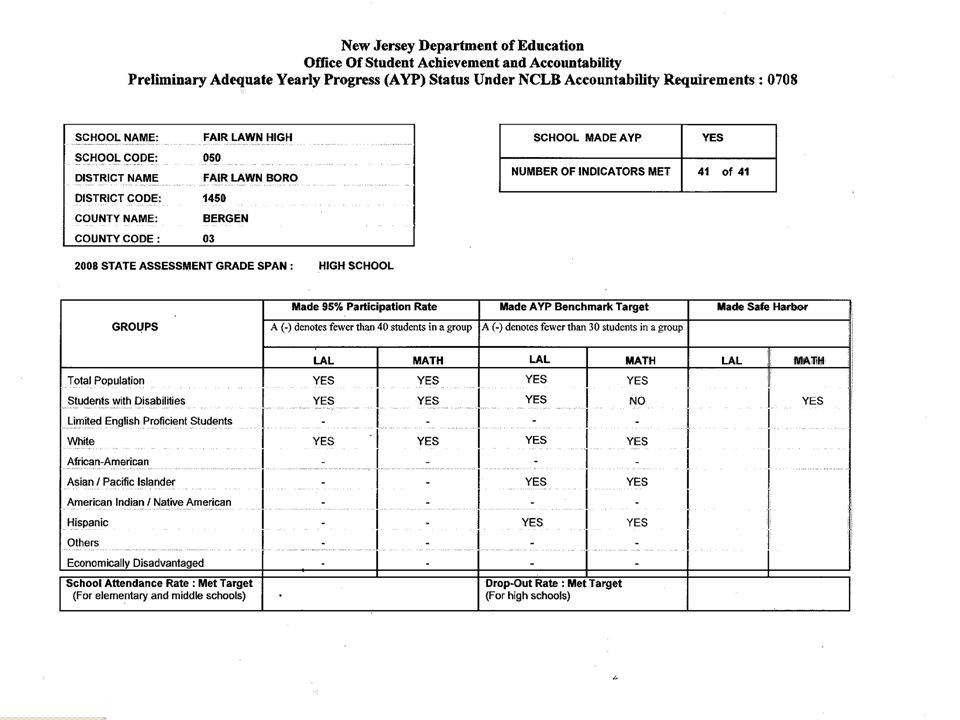
Review of NCLB Testing For Fair Lawn Board of Education and Public---October 2012 N.J.A.C. 6A:8-4.3(a) Accountability “Chief school administrators shall report results of annual assessments to district boards of education within 30 days of receipt of information from the Department of Education.”
 Accountability Chief school administrators shall report results of annual assessments to district boards of education within 30 days of receipt of information from the Department of Education. .")
4
District Factor Groups The District Factor Group (DFG) is an indicator of the socioeconomic status of citizens in each district and has been useful for the comparative reporting of test results from New Jersey’s statewide testing programs. They range from A (lowest socioeconomic districts) to J (highest socioeconomic districts) and are labeled as follows: A, B, CD, DE, FG, GH, I, J.
 to J (highest socioeconomic districts) and are labeled as follows: A, B, CD, DE, FG, GH, I, J..")
5
Ensuring Success for All! Evaluate and share data Formulate school goals Develop and implement an action plan Assess effectiveness of program implementation Reevaluate, refocus, and recharge!

6
DISTRICT GRADE 3 NJ ASK TOTAL STUDENTS NCLB PROFICIENCY SCORES LANGUAGE ARTS - 2012 79

7
District Grade 3 NJ ASK TOTAL STUDENTS NCLB PROFICIENCY SCORES MATHEMATICS - 2012 83

8
DISTRICT GRADE 4 NJ ASK TOTAL STUDENTS NCLB PROFICIENCY SCORES LANGUAGE ARTS - 2012 79

9
DISTRICT GRADE 4 NJ ASK TOTAL STUDENTS NCLB PROFICIENCY SCORES MATHEMATICS - 2012 83

10
DISTRICT GRADE 4 NJ ASK TOTAL STUDENTS NCLB PROFICIENCY SCORES SCIENCE - 2012

11
DISTRICT GRADE 5 NJ ASK TOTAL STUDENTS NCLB PROFICIENCY SCORES LANGUAGE ARTS - 2012 83

12
DISTRICT GRADE 5 NJ ASK TOTAL STUDENTS NCLB PROFICIENCY SCORES MATHEMATICS - 2012 83

13
DISTRICT GRADE 6 NJ ASK TOTAL STUDENTS NCLB PROFICIENCY SCORES LANGUAGE ARTS - 2012 86

14
DISTRICT GRADE 6 NJ ASK TOTAL STUDENTS NCLB PROFICIENCY SCORES MATHEMATICS - 2012 80

15
DISTRICT GRADE 7 NJ ASK TOTAL STUDENTS NCLB PROFICIENCY SCORES LANGUAGE ARTS - 2012 86

16
DISTRICT GRADE 7 NJ ASK TOTAL STUDENTS NCLB PROFICIENCY SCORES MATHEMATICS - 2012 80

17
DISTRICT GRADE 8 NJ ASK TOTAL STUDENTS NCLB PROFICIENCY SCORES LANGUAGE ARTS - 2012 86

18
DISTRICT GRADE 8 NJ ASK TOTAL STUDENTS NCLB PROFICIENCY SCORES MATHEMATICS - 2012 80

19
DISTRICT GRADE 8 NJ ASK TOTAL STUDENTS NCLB PROFICIENCY SCORES SCIENCE - 2012

20
DISTRICT GRADE 11 HSPA TOTAL STUDENTS NCLB PROFICIENCY SCORES LANGUAGE ARTS - 2012

21
DISTRICT GRADE 11 HSPA TOTAL STUDENTS NCLB PROFICIENCY SCORES MATHEMATICS - 2012

22
District Grade 3 NJASK Total NCLB Proficiency Scores General Education Students versus DFG 2005 - 2012 2012 Scale Score Mean District – 220.9 DFG – 215.3 State - 209.7 75 59 79 7.7 AP

23
District Grade 3 NJASK Total NCLB Proficiency Scores Special Education Students versus DFG 2005 - 2012 2012 Scale Score Mean District - 201.5 DFG - 195.0 State - 190.6 75 59 79

24
NJ ASK 2012 COMPARISON DISTRICT & “I” DFG GRADE 3 LANGUAGE ARTS LITERACY 79 SCALE SCORE MEAN 214.9 215.4

25
District Grade 3 NJASK Total NCLB Proficiency Scores General Education Students versus DFG 2005 - 2012 2012 Scale Score Mean District - 258.4 DFG - 247.9 State - 235.9 62 66 83 66.2 AP

26
District Grade 3 NJASK Total NCLB Proficiency Scores Special Education Students versus DFG 2005 - 2012 2012 Scale Score Mean District - 231.3 DFG - 219.0 62 66 83 29.7 AP

27
NJ ASK 2012 COMPARISON DISTRICT & “I” DFG GRADE 3 MATHEMATICS 83 Scale Score Mean 248.9 247.9258.4 252.6231.3 227.1243.1 219.9228.2 226.0

28
District Grade 4 NJASK Total NCLB Proficiency Scores General Students versus DFG 2005 - 2012 2012 Scale Score Mean District - 217.5 DFG - 212.8 State - 207.2 75 59 79

29
District Grade 4 NJASK Total NCLB Proficiency Scores Special Education Students versus DFG 2005 - 2012 2012 Scale Score Mean District - 199.2 DFG - 189.5 State - 183.9 75 59 79 1.3AP

30
NJ ASK 2012 COMPARISON DISTRICT & “I” DFG GRADE 4 LANGUAGE ARTS LITERACY 79 Scale Score Mean 213.2 213.6217.5 217.7199.2 194.9197.6 200.3209.6 217.7

31
District Grade 4 NJASK Total NCLB Proficiency Scores General Students versus DFG 2005-2012 2012 Scale Score Mean District - 258.4 DFG -243.8 State - 234.2 62 66 83 64AP

32
District Grade 4 NJASK Total NCLB Proficiency Scores Special Education Students versus DFG 2005 - 2012 2012 Scale Score Mean District - 232.8 DFG - 215.0 State - 207.1 62 66 83 36.4AP

33
NJ ASK 2012 COMPARISON DISTRICT & “I” DFG GRADE 4 MATHEMATICS 83 Scale Score Mean 252.4 245.9258.4 250.9232.8 223.0229.9 217.2235.2 226.6

34
District Grade 4 NJASK Total NCLB Proficiency Scores General Students versus DFG 2005 - 2012 2012 Scale Score Mean District - 257.4 DFG - 254.6 State - 246.0 63.1AP

35
District Grade 4 NJASK Total NCLB Proficiency Scores Special Education Students versus DFG 2005 - 2012 2012 Scale Score Mean District - 241.2 DFG 232.4 State - 225.3

36
NJ ASK 2012 COMPARISON DISTRICT & “I” DFG GRADE 4 SCIENCE Scale Score Mean 253.6 255.7257.4 259.7242.2 238.9240.9 234.6241.4 241.9

37
District Grade 5 NJASK Total NCLB Proficiency Scores General Students versus DFG 2006 -2012 2012 Scale Score Mean District - 221.9 DFG - 216.9 State - 210.0 75 59 79

38
District Grade 5 NJASK Total NCLB Proficiency Scores Special Education Students versus DFG 2006 - 2012 2012 Scale Score Mean District - 199.2 DFG - 188.6 State - 183.3 29 59 2.4AP

39
NJ ASK 2012 COMPARISON DISTRICT & “I” DFG GRADE 5 LANGUAGE ARTS LITERACY 79 Scale Score Mean 216.4 217.6221.9 222.2199.2 194.9220.1 201.6204.6 204.7

40
District Grade 5 NJASK Total NCLB Proficiency Scores General Students versus DFG 2006 - 2012 2012 Scale Score Mean District -262 DFG - 250.2 State - 241.3 62 66 83 70.3AP

41
District Grade 5 NJASK Total NCLB Proficiency Scores Special Education Students versus DFG 2006 - 2012 2012 Scale Score Mean District 225.4 DFG - 214.3 State - 207.4 62 66 83 22.6AP

42
NJ ASK 2012 COMPARISON DISTRICT & “I” DFG GRADE 5 MATHEMATICS 83 Scale Score Mean 252.6 251.3262.0 257.1225.4 222.2251.0 225.9230.9 231.1

43
2010-2012 NJ ASK—District Growth Chart Elementary Grades 3,4, and 5

44
2010-2012 NJ ASK Growth Chart Milnes School a Reward School

45
District Grade 6 NJASK Total NCLB Proficiency Scores General Education Students versus DFG 2006 - 2012 2012 Scale Score Mean District - 226.0 DFG - 219.9 State - 213.6 66 72 86 12.3AP

46
District Grade 6 NJASK Total NCLB Proficiency Scores Special Education Students versus DFG 2006 - 2012 2012 Scale Score Mean District - 198.3 DFG - 190.2 State - 186.2 66 72 86 1.5AP

47
NJ ASK 2012 COMPARISON DISTRICT & “I” DFG GRADE 6 LANGUAGE ARTS LITERACY 86 Scale Score Mean 220.6 221.0226.0 225.4198.3 197.1218.7 204.3214.4 209.7

48
District Grade 6 NJASK Total NCLB Proficiency Scores General Education Students versus DFG 2006 - 2012 2012 Scale Score Mean District - 255.3 DFG - 244.1 State - 235.7 49 61 80 59.1AP

49
District Grade 6 NJASK Total NCLB Proficiency Scores Special Education Students versus DFG 2006 - 2012 2012 Scale Score Mean District - 207.4 DFG - 199.4 State - 195.4 49 61 80 11.8AP

50
NJ ASK 2012 COMPARISON DISTRICT & “I” DFG GRADE 6 MATHEMATICS 80 Scale Score Mean 246.2 255.3 252.9207.4 209.7228.8 232.4232.4 227.1

51
District Grade 7 NJASK Total NCLB Proficiency Scores General Students versus DFG 2006 - 2012 2012 Scale Score Mean District - 227.5 DFG - 222.8 State - 214.6 66 72 86 19.8AP

52
District Grade 7 NJASK Total NCLB Proficiency Scores Special Education Students versus DFG 2006 - 2011 2012 Scale Score Mean District - 194.3 DFG - 183.8 State - 177.6 66 72 86 1.7AP

53
NJASK 2012 COMPARISON DISTRICT & “I” DFG GRADE 7 LANGUAGE ARTS LITERACY 86 Scale Score Mean 221.1 223.8227.5 229.5194.3 190.7210.4 203.7 208.7 209.7

54
District Grade 7 NJASK Total NCLB Proficiency Scores General Students versus DFG 2006 - 2012 2012 Scale Score Mean District - 240.5 DFG - 232.1 State - 222.6 49 61 80

55
District Grade 7 NJASK Total NCLB Proficiency Scores Special Education Students versus DFG 2006 - 2012 2012 Scale Score Mean District - 202.2 DFG - 185.9 State - 181.8 49 61 80 8.3AP

56
NJ ASK 2012 COMPARISON DISTRICT & “I” DFG GRADE 7 MATHEMATICS 80 Scale Score Mean 233.4 233.8240.5 240.8202.2 193.0213.5 204.2218.0 212.1

57
District Grade 8 GEPA/NJASK Total NCLB Proficiency Scores General Students versus DFG 2005 - 2012 2012 Scale Score Mean District - 232.4 DFG - 232.6 State - 226.6 66 72 86 22.6AP

58
District Grade 8 GEPA/NJASK Total NCLB Proficiency Scores Special Education Students versus DFG 2005 - 2012 2012 Scale Score Mean District 209.3 DFG 202.4 State - 197.0 66 72 86 6.6AP

59
NJ ASK 2012 COMPARISON DISTRICT & “I” DFG GRADE 8 LANGUAGE ARTS LITERACY 86 Scale Score Mean 227.9 233.5232.4 237.7209.3 208.3217.4 216.6215.0 223.3

60
District Grade 8 GEPA/NJASK Total NCLB Proficiency Scores General Students versus DFG 2005 - 2012 2012 Scale Score Mean District - 246.1 DFG 242.7 State - 231.9 49 61 80 48.8AP

61
District Grade 8 GEPA/NJASK Total NCLB Proficiency Scores Special Education Students versus DFG 2005 - 2012 2012 Scale Score Mean District - 194.5 DFG 186.6 State - 179.5 49 61 80 14.5AP

62
NJ ASK 2012 COMPARISON DISTRICT & “I” DFG GRADE 8 MATHEMATICS 80 Scale Score Mean 236.9 242.8246.1 250.3194.5 196.7206.5 208.4210.4 221.5

63
2010-2012 NJ ASK Growth Chart Middle School Grades 6, 7, and 8

64
District Grade 8 NJASK Total NCLB Proficiency Scores General Students versus DFG 2005- 2012 2012 Scale Score Mean District - 243.5 DFG - 243.5 State - 236.0 47.3AP

65
NJ ASK 2012 COMPARISON DISTRICT & “I” DFG GRADE 8 SCIENCE Scale Score Mean 232.2 246.1243.5 250.9211.0 218.0221.4 222.8219.4 232.3

66
District Grade 11 HSPA Total NCLB Proficiency Scores General Education Students versus DFG 2004 - 2012 2012 Scale Score Mean District - 241.2 DFG - 241.2 State - 237.4 97 98.6 96.998 73 79 85 92 98.5 State 97.3 29.8AP

67
District Grade 11 HSPA Total NCLB Proficiency Scores Special Education Students versus DFG 2004 - 2012 2012 Scale Score Mean District - 222.3 DFG - 214.6 State - 206.8 State - 66.7 10.2AP

68
District Grade 11 HSPA Total Proficiency Hispanic Sub-Group versus DFG and State 2006-2012 92 79 85 2012 Scale Score Mean District - 232.6 DFG - 227.8 State - 221.3 90.1

69
CYCLE II MAY 2012 HSPA Fair Lawn Compared to DFG I State District Language Arts Literacy Scale Score Mean 238.3 242.0 241.2 245.8222.3 220.4 228.1 227.9 232.6 234.3 92

70
District Grade 11 HSPA Total NCLB Proficiency Scores General Education Students versus DFG 2004-2012 2012 Scale Score Mean District - 241.5 DFG 238.2 State - 232.4 55 64 74 86 State 87.6 43.4AP

71
District Grade 11 HSPA Total NCLB Proficiency Scores Special Education Students versus DFG 2004-2012 2012 Scale Score Mean District - 218.1 DFG 199.7 Scale 193.4 55 64 74 State - 38.4 20.3AP

72
District Grade 11 HSPA Total Proficiency Hispanic Sub-Group versus DFG and State 2006-2012 2012 Scale Score Mean District - 225.4 DFG - 217.6 State - 212.3 64 74 86

73
Cycle II May 2012 HSPA Fair Lawn Compared to DFG I State District Mathematics Scale Score Mean 238.0 240.3 241.5 245.8218.1 207.2 211.1 215.8 225.4 224.3 86

75
SAT SCORE REPORT ANALYSIS CRITICAL READING 200720082009201020112012 Fair Lawn500508517501518520 New Jersey495 Comparison+5+13+21+6+23+25 National502 501 497496 Comparison-2+6+16-0-+21+24 Overall Mean Scores

76
SAT SCORE REPORT ANALYSIS CRITICAL READING Overall Mean Scores 800

77
SAT SCORE REPORT ANALYSIS MATHEMATICS 200720082009201020112012 Fair Lawn534541546536547550 New Jersey510513 514516517 Comparison+24+28+33+22+31+33 National515 516514 Comparison+19+26+31+20+33+36 Overall Mean Scores

78
SAT SCORE REPORT ANALYSIS MATHEMATICS Overall Mean Scores 800

79
SAT SCORE REPORT ANALYSIS WRITING 200720082009201020112012 Fair Lawn510514518512520535 New Jersey494496 497 499 Comparison+16+18+22+15+23+36 National494 518492489488 Comparison+16+20+25+20+31+47 Overall Mean Scores

80
SAT SCORE REPORT ANALYSIS WRITING Overall Mean Scores 800

81
Magazine Ranks High School Among The Best In Country Newsweek Magazine—Ranks “America’s Best High Schools” – Out of over 27,000—Fair Lawn was in the top 1300 in 2008 and 2009, in 2010 ranked 1106, and in 2011 Fair Lawn HS was ranked #400 (Top 2%). New Jersey Monthly Magazine—September Issue “NJ’s Best High Schools – The Top 100 Public HS’s—Fair Lawn HS was ranked #81 in 2008, #76 in 2010, and #65 in 2012.

82
Other Quality Indicators Top 25% in Nation—5 th Grade Math Olympiad 6 th in Nation, Among 729 School Teams, 5 th Grade “WORDMASTERS” Championship Marching Band and Award Winning High School Musical Model UN, Debate Team, Athletic Teams Including County and State Championships, Etc.

Similar presentations


 Accountability “Chief school administrators shall.>")


 MAP Performance Index Status Targets 339.5 (2011) 336.1.>")


>")