Download presentation
Presentation is loading. Please wait.

1
Ecosystems: Components, Energy Flow, and Matter Cycling
“All things come from earth, and to earth they all return”—Menander

2
Key Questions: What is ecology?
What are the major parts of the earth’s life support systems? What are the major components of an ecosystem? What happens to matter and energy in ecosystems? What are ecosystem services? How do they affect the sustainability of the earth’s life support systems?

3
Ecology and the levels of organization of matter
Ecology—Greek oikos meaning house Study of how organisms interact with one another and their non-living environment (biotic and abiotic components) Studies connections in nature on the thin life supporting membrane of air, water, and soil Levels of Organization of Matter Subatomic to biosphere
 Studies connections in nature on the thin life supporting membrane of air, water, and soil. Levels of Organization of Matter. Subatomic to biosphere.")
4
Ecosystem Organization
Biosphere Ecosystems Communities Populations Organisms Organisms Made of cells Eukaryotic vs Prokaryotic Species Groups of organisms that resemble one another in appearance, behavior, and genetic make up Sexual vs Asexual reproduction Production of viable offspring in nature 1.5 million named; million likely Populations Genetic diversity Communities Ecosystems Biosphere Fig. 4.2, p. 66

5
Earth’s Life Support Systems
Troposphere To 11 miles Air is here Stratosphere 11 to 30 miles Ozone layer Hydrosphere Solid, liquid, and gaseous water Lithosphere Crust and upper mantle Contains non- renewable res. Atmosphere Vegetation and animals Soil Rock Biosphere Crust core Mantle Lithosphere (crust, top of upper mantle) Hydrosphere (water) (air) (Living and dead organisms) (soil and rock)
 Hydrosphere. (water) (air) (Living and dead. organisms) (soil and rock)")
6
Major Ecosystem Components
Abiotic Components Water, air, temperature, soil, light levels, precipitation, salinity Sets tolerance limits for populations and communities Some are limiting factors that structure the abundance of populations Biotic Components Producers, consumers, decomposers Plants, animals, bacteria/fungi Biotic interactions with biotic components include predation, competition, symbiosis, parasitism, commensalism etc.

7
Limiting Factors on Land & in H2O
Terrestrial Sunlight Temperature Precipitation Soil nutrients Fire frequency Wind Latitude Altitude Aquatic/Marine Light penetration Water clarity Water currents Dissolved nutrient concentrations Esp. N, P, Fe Dissolved Oxygen concentration Salinity

9
Sustaining Life on Earth…
One way flow of high quality energy The cycling of matter (the earth is a closed system) Gravity Causes downward movement of matter Biosphere Carbon cycle Phosphorus Nitrogen Water Oxygen Heat in the environment Heat
 Gravity. Causes downward movement of matter. Biosphere. Carbon. cycle. Phosphorus. Nitrogen. Water. Oxygen. Heat in the environment. Heat.")
10
Ecosystem Services and Sustainability
Solar Capital Air resources and purification Climate control Recycling vital chemicals Renewable energy Nonrenewable mineral Potentially renewable matter Biodiversity and gene pool Natural pest and disease Waste removal and detoxification Soil formation renewal Water Lessons From Nature! Use Renewable Solar Energy As Energy Source Recycle the chemical nutrients needed for life

11
Ecological communities
Community = an assemblage of species living in the same place at the same time Members interact with each other Interactions determine the structure, function, and species composition of the community Community ecologists = people interested in how: Species coexist and relate to one another Communities change, and why patterns exist 11 11

12
Energy passes through trophic levels
One of the most important species interactions is who eats whom Matter and energy move through the community Trophic levels = rank in the feeding hierarchy Producers Consumers Detritivores and Decomposers 12 12

13
Biotic Components of Ecosystems
Producers=autotroph Source of all food Photosynthesis Consumers=heterotroph Aerobic respiration Anaerobic respiration Methane, H2S Decomposers Matter recyclers… Release organic compounds into soil and water where they can be used by producers Heat Abiotic chemicals (carbon dioxide, oxygen, nitrogen, minerals) Producers (plants) Decomposers (bacteria, fungus) Consumers (herbivores, carnivores) Solar energy
 Producers. (plants) Decomposers. (bacteria, fungus) Consumers. (herbivores, carnivores) Solar. energy.")
14
Producers: the first trophic level
Autotrophs (“self-feeders”) = organisms that capture solar energy for photosynthesis to produce sugars Green Plants Cyanobacteria Algae Chemosynthetic bacteria use the geothermal energy in hot springs or deep-sea vents to produce their food 14 14
 = organisms that capture solar energy for photosynthesis to produce sugars. Green Plants. Cyanobacteria. Algae. Chemosynthetic bacteria use the geothermal energy in hot springs or deep-sea vents to produce their food")
15
Consumers: organisms that consume producers
Primary consumers = second trophic level Organisms that consume producers Herbivores consume plants Deer, grasshoppers Secondary consumers = third trophic level Organisms that prey on primary consumers Carnivores consume meat Wolves, rodents 15 15

16
Consumers occur at even higher trophic levels
Tertiary Consumers = fourth trophic level Predators at the highest trophic level Consume secondary consumers Are also carnivores Hawks, owls Omnivores = consumers that eat both plants and animals

17
Detritivores and decomposers
Organisms that consume nonliving organic matter Enrich soils and/or recycle nutrients found in dead organisms Detritivores = scavenge waste products or dead bodies Millipedes Decomposers = break down leaf litter and other non-living material Fungi, bacteria Enhance topsoil and recycle nutrients 17 17

18
Detritivores vs Decomposers
Fig. 4.15, p. 75 Mushroom Wood reduced to powder Long-horned beetle holes Bark beetle engraving Carpenter ant galleries Termite and carpenter work Dry rot fungus Detritus feeders Decomposers Time progression Powder broken down by decomposers into plant nutrients in soil

19
Energy Flow and Matter Cycling in Ecosystems…
Food Chains vs. Food Webs KEY: There is little if no matter waste in natural ecosystems! Heat First Trophic Level Second Trophic Third Trophic Fourth Trophic Solar energy Producers (plants) Primary consumers (herbivores) Tertiary (top carnivores) Secondary (carnivores) Detritvores (decomposers and detritus feeders)
 Primary. consumers. (herbivores) Tertiary. (top carnivores) Secondary. (carnivores) Detritvores. (decomposers and detritus feeders)")
20
Food webs show relationships and energy flow
Food chain = the relationship of how energy is transferred up the trophic levels Food web = a visual map of feeding relationships and energy flow Includes many different organisms at all the various levels Greatly simplified; leaves out the majority of species 20 20

21
Generalized Food Web of the Antarctic
Fig. 4.18, p. 77 Humans Blue whale Sperm whale Crabeater seal Killer whale Elephant seal Leopard Adélie penguins Petrel Fish Squid Carnivorous plankton Krill Phytoplankton Herbivorous zooplankton Emperor penguin Note: Arrows Go in direction Of energy flow…

22
Food Webs and the Laws of matter and energy
Food chains/webs show how matter and energy move from one organism to another through an ecosystem Each trophic level contains a certain amount of biomass (dry weight of all organic matter) Chemical energy stored in biomass is transferred from one trophic level to the next With each trophic transfer, some usable energy is degraded and lost to the environment as low quality heat Thus, only a small portion of what is eaten and digested is actually converted into an organisms’ bodily material or biomass (WHAT LAW ACCOUNTS FOR THIS?) Ecological Efficiency: The % of usable nrg transferred as biomass from one trophic level to the next (ranges from 5-20% in most ecosystems, use 10% as a rule of thumb) Thus, the more trophic levels or steps in a food chain, the greater the cumulative loss of useable energy…
 Chemical energy stored in biomass is transferred from one trophic level to the next. With each trophic transfer, some usable energy is degraded and lost to the environment as low quality heat. Thus, only a small portion of what is eaten and digested is actually converted into an organisms’ bodily material or biomass (WHAT LAW ACCOUNTS FOR THIS ) Ecological Efficiency: The % of usable nrg transferred as biomass from one trophic level to the next (ranges from 5-20% in most ecosystems, use 10% as a rule of thumb) Thus, the more trophic levels or steps in a food chain, the greater the cumulative loss of useable energy…")
23
Energy, biomass, and numbers decrease
Most energy organisms use is lost as waste heat through respiration Less and less energy is available in each successive trophic level Each level contains only 10% of the energy of the trophic level below it There are far fewer organisms at the highest trophic levels, with less energy available A human vegetarian’s ecological footprint is smaller than a meat-eater’s footprint 23 23

24
Pyramids of energy, biomass, and numbers

25
Pyramids of Energy and Matter
Pyramid of Energy Flow Pyramid of Biomass Heat 10 100 1,000 10,000 Usable energy Available at Each tropic level (in kilocalories) Producers (phytoplankton) Primary consumers (zooplankton) Secondary (perch) Tertiary (human) Decomposers
 Producers. (phytoplankton) Primary. consumers. (zooplankton) Secondary. (perch) Tertiary. (human) Decomposers.")
26
Implications of Pyramids….
Why could the earth support more people if the eat at lower trophic levels? Why are food chains and webs rarely more than four or five trophic levels? Why do marine food webs have greater ecological efficiency and therefore more trophic levels than terrestrial ones? Why are there so few top level carnivores? Why are these species usually the first to suffer when the the ecosystems that support them are disrupted?

27
Ecological Pyramids of Energy
Energy in ecosystems flows from producers (photosynthetic organisms) to consumers (herbivores and carnivores). Ecological pyramids of energy usually depict the amount of living material (or its energetic equivalent) that is present in different trophic levels. In this diagram, energy is depicted in kilocalories. Primary producers convert only about 1% of the energy in available sunlight. The average amount of energy that is available to the next trophic level is about 10%. Because so much energy is utilized in building and maintaining organisms, food chains (series of feeding relationships) are usually limited to just three or four steps. Pyramids of energy can not be inverted. References: Campbell, N.E., & Reece, J.B. (2002). Biology,(6th ed.). San Francisco: Benjamin Cummings. Holligan, P.M., Harris,R.P., Newell, R.C., Harbour, D.C., Head, R.N., Linley, E.A.S., Lucas, M.I., Tranter, P.R.G., Weekly, C.M. (1984). Vertical distribution and partitioning of organic carbon in mixed, frontal, and stratified waters of the English Channel. Marine Ecology Progress Series, 14, Raven, P.H., & Johnson, G.B. (2002). Biology, (6th ed.). McGraw-Hill. Image Reference: Baylor College of Medicine, Center For Educational Outreach. (2004). Martha Young, Senior Graphic Designer.
 to consumers (herbivores and carnivores). Ecological pyramids of energy usually depict the amount of living material (or its energetic equivalent) that is present in different trophic levels. In this diagram, energy is depicted in kilocalories. Primary producers convert only about 1% of the energy in available sunlight. The average amount of energy that is available to the next trophic level is about 10%. Because so much energy is utilized in building and maintaining organisms, food chains (series of feeding relationships) are usually limited to just three or four steps. Pyramids of energy can not be inverted. References: Campbell, N.E., & Reece, J.B. (2002). Biology,(6th ed.). San Francisco: Benjamin Cummings. Holligan, P.M., Harris,R.P., Newell, R.C., Harbour, D.C., Head, R.N., Linley, E.A.S., Lucas, M.I., Tranter, P.R.G., Weekly, C.M. (1984). Vertical distribution and partitioning of organic carbon in mixed, frontal, and stratified waters of the English Channel. Marine Ecology Progress Series, 14, Raven, P.H., & Johnson, G.B. (2002). Biology, (6th ed.). McGraw-Hill. Image Reference: Baylor College of Medicine, Center For Educational Outreach. (2004). Martha Young, Senior Graphic Designer.")
28
Ecological Pyramids of Biomass
The total dry weight of organisms (standing crop) in a particular trophic level is referenced as biomass. Most pyramids follow the typical pattern of narrowing at each level, however in some aquatic ecosystems, the pyramid may be inverted. In the example, phytoplankton grow and reproduce so rapidly that they can support a large population of zooplankton even though at any one time, the biomass of phytoplankton is smaller than that of the zooplankton. References: Campbell, N.E., & Reece, J.B. (2002). Biology,(6th ed.). San Francisco: Benjamin Cummings. Holligan, P.M., Harris,R.P., Newell, R.C., Harbour, D.C., Head, R.N., Linley, E.A.S., Lucas, M.I., Tranter, P.R.G., Weekly, C.M. (1984). Vertical distribution and partitioning of organic carbon in mixed, frontal, and stratified waters of the English Channel. Marine Ecology Progress Series, 14, Raven, P.H., & Johnson, G.B. (2002). Biology, (6th ed.). McGraw-Hill. Image Reference: Baylor College of Medicine, Center For Educational Outreach. (2004). Martha Young, Senior Graphic Designer.
 in a particular trophic level is referenced as biomass. Most pyramids follow the typical pattern of narrowing at each level, however in some aquatic ecosystems, the pyramid may be inverted. In the example, phytoplankton grow and reproduce so rapidly that they can support a large population of zooplankton even though at any one time, the biomass of phytoplankton is smaller than that of the zooplankton. References: Campbell, N.E., & Reece, J.B. (2002). Biology,(6th ed.). San Francisco: Benjamin Cummings. Holligan, P.M., Harris,R.P., Newell, R.C., Harbour, D.C., Head, R.N., Linley, E.A.S., Lucas, M.I., Tranter, P.R.G., Weekly, C.M. (1984). Vertical distribution and partitioning of organic carbon in mixed, frontal, and stratified waters of the English Channel. Marine Ecology Progress Series, 14, Raven, P.H., & Johnson, G.B. (2002). Biology, (6th ed.). McGraw-Hill. Image Reference: Baylor College of Medicine, Center For Educational Outreach. (2004). Martha Young, Senior Graphic Designer.")
30
Matter Cycles You are responsible for knowing the water, carbon, nitrogen, sulfur, and phosphorus cycles Know major sources and sinks Know major flows Know how human activities are disrupting these cycles

31
Basic Biogeochemical Cycling
Biotic (Organic) Reservoir Process 1 Process 2 Abiotic (Inorganic) Reservoir
 Reservoir. Process 1. Process 2. Abiotic. (Inorganic) Reservoir.")
32
Common Reservoirs and Fluxes

33
Carbon Cycle Can be stored in five major areas:
1. Living and dead organisms 2. Atmosphere (carbon dioxide) 3. Organic matter in soil 4. Lithosphere as fossil fuels and rock deposits 5. Oceans as dissolved CO2 and shells
 3. Organic matter in soil. 4. Lithosphere as fossil fuels and rock deposits. 5. Oceans as dissolved CO2 and shells.")
34
Carbon Cycle Carbon Cycle
Carbon, in the form of carbon dioxide, comprises about 0.03 percent of the atmosphere. Worldwide circulation of carbon atoms is called the carbon cycle. Since carbon becomes incorporated into molecules used by living organisms during photosynthesis, parts of the carbon cycle closely parallel the flow of energy through the earth’s living systems. Carbon is found in the atmosphere, the oceans, soil, fossil deposits and living organisms. Photosynthetic organisms create carbon-containing molecules (known as “organic” compounds), which are passed to other organisms as depicted in food webs. Each year, about 75 billion metric tons of carbon are trapped in carbon-containing compounds through photosynthesis. Carbon is returned to the environment through respiration (breakdown of sugar or other organic compounds), combustion (burning of organic materials, including fossil fuels), and erosion. References: Campbell, N.E., & Reece, J.B. (2002). Biology,(6th ed.). San Francisco: Benjamin Cummings. Image Reference: Baylor College of Medicine, Center For Educational Outreach. (2004). Martha Young, Senior Graphic Designer.
, which are passed to other organisms as depicted in food webs. Each year, about 75 billion metric tons of carbon are trapped in carbon-containing compounds through photosynthesis. Carbon is returned to the environment through respiration (breakdown of sugar or other organic compounds), combustion (burning of organic materials, including fossil fuels), and erosion. References: Campbell, N.E., & Reece, J.B. (2002). Biology,(6th ed.). San Francisco: Benjamin Cummings. Image Reference: Baylor College of Medicine, Center For Educational Outreach. (2004). Martha Young, Senior Graphic Designer.")
35
Estimated major stores of carbon on the Earth
Sink Amounts in Billions of Metric Tons Atmosphere 766 Soil Organic Matter Ocean 38,000-40,000 Marine sediments and sedimentary rocks 66,000,000 to 100,000,000 Terrestrial plants Fossil Fuel Deposits 4000

37
Carbon in Oceans Enters through diffusion (creates carbonic acid)
Some sea life use bicarbonate to produce shells and body parts (coral, clams, some algae)
")
38
Carbon cycle in the lithosphere
Inorganic: coal, oil, natural gas, oil shale, limestone Created from organisms (both plant and animal) that died a long time ago and accumulated on the bottom of oceans or lakes
 that died a long time ago and accumulated on the bottom of oceans or lakes.")
39
Carbon cycle in the soil
Organic: litter, humic substances found in soil

40
Humans and the Carbon Cycle
Until recently: none Now: 6.5 billion metric tons of carbon are transferred from fossil fuel storage pool to the atmosphere

41
The Source of High Quality Energy
Solar radiation Energy in = Energy out Reflected by atmosphere (34%) UV radiation Absorbed by ozone by the earth Visible light Lower Stratosphere (ozone layer) Troposphere Heat Greenhouse effect Radiated by atmosphere as heat (66%) Earth Heat radiated Energy of sun lights and warms the planet Supports photosyn. Powers the cycling of matter Drives climate and weather that distribute heat and H2O
 UV radiation. Absorbed. by ozone. by the earth. Visible. light. Lower Stratosphere. (ozone layer) Troposphere. Heat. Greenhouse. effect. Radiated by. atmosphere. as heat (66%) Earth. Heat radiated. Energy of sun lights and warms the planet. Supports photosyn. Powers the cycling of matter. Drives climate and weather that distribute heat and H2O.")
42
Carbon in Ecosystems: Photosynthesis and Respiration
Forms of C: CO2, organic C compounds like glucose Processes Photosynthesis: Carbon dioxide + water + solar energy chlorophyll glucose (sugar) + oxygen Respiration: Glucose + oxygen Carbon dioxide + water + E Most of the carbon in the world is bound up in the bodies of living organisms Large amounts are also found in the atmosphere and dissolved in the oceans as carbon dioxide Carbon is removed from the atmosphere through the process of photosynthesis and returned through cellular respiration Burning anything with organic carbon in it also releases carbon dioxide to the atmosphere This is what happens when you burn gasoline, which is made of hydrocarbons, in your car 42 42
 + oxygen. Respiration: Glucose + oxygen Carbon dioxide + water + E. Most of the carbon in the world is bound up in the bodies of living organisms. Large amounts are also found in the atmosphere and dissolved in the oceans as carbon dioxide. Carbon is removed from the atmosphere through the process of photosynthesis and returned through cellular respiration. Burning anything with organic carbon in it also releases carbon dioxide to the atmosphere. This is what happens when you burn gasoline, which is made of hydrocarbons, in your car")
43
Fate of Solar Energy… Earth gets 1/billionth of sun’s output of nrg
34% is reflected away by atmosphere 66% is absorbed by chemicals in atm = re- radiated into space Visible light, Infrared radiation (heat), and a small amount of UV not absorbed by ozone reaches the atmosphere Energy warms troposphere and land Evaporates water and cycles it along with gravity Generates winds A tiny fraction is captured by photosynthesizing organisms Natural greenhouse effect vs. Global Warming
, and a small amount of UV not absorbed by ozone reaches the atmosphere. Energy warms troposphere and land. Evaporates water and cycles it along with gravity. Generates winds. A tiny fraction is captured by photosynthesizing organisms. Natural greenhouse effect vs. Global Warming.")
44
Primary Productivity The conversion of light energy to chemical energy is called “gross primary production.” Plants use the energy captured in photosynthesis for maintenance and growth. The energy that is accumulated in plant biomass is called “net primary production.” Primary Production in Plants The total production of organic compounds by plants is referred to as primary productivity or production. This represents the total amount of light energy transformed into chemical energy through photosynthesis. Only about 1 – 5 % of the solar energy in any given location actually is captured for use or storage by plants. After the metabolic requirements of producers (plants or other photosynthetic organisms) are met, the total energy (accumulated as biomass) available to be passed through the food chain is called net primary productivity. References: Campbell, N.E., & Reece, J.B. (2002). Biology,(6th ed.). San Francisco: Benjamin Cummings. Raven, P.H., & Johnson, G.B. (2002). Biology, (6th ed.). McGraw-Hill. Image Reference: Baylor College of Medicine, Center For Educational Outreach. (2004). Martha Young, Senior Graphic Designer.
 are met, the total energy (accumulated as biomass) available to be passed through the food chain is called net primary productivity. References: Campbell, N.E., & Reece, J.B. (2002). Biology,(6th ed.). San Francisco: Benjamin Cummings. Raven, P.H., & Johnson, G.B. (2002). Biology, (6th ed.). McGraw-Hill. Image Reference: Baylor College of Medicine, Center For Educational Outreach. (2004). Martha Young, Senior Graphic Designer.")
45
Primary Productivity NPP=GPP-respiration rate
GPP= RATE at which producers convert solar energy into chemical energy as biomass Rate at which producers use photosynthesis to fix inorganic carbon into the organic carbon of their tissues These producers must use some of the total biomass they produce for their own respiration NPP= Rate at which energy for use by consumers is stored in new biomass (available to consumers) Units Kcal/m2/yr or g/m2/yr How do you measure it? AP Lab Site Most productive vs. least productive
 Units Kcal/m2/yr or g/m2/yr. How do you measure it AP Lab Site. Most productive vs. least productive.")
47
What are the most productive Ecosystems?
Estuaries Swamps and marshes Tropical rain forest Temperate forest Northern coniferous forest (taiga) Savanna Agricultural land Woodland and shrubland Temperate grassland Lakes and streams Continental shelf Open ocean Tundra (arctic and alpine) Desert scrub Extreme desert 800 1,600 2,400 3,200 4,000 4,800 5,600 6,400 7,200 8,000 8,800 9,600 Average net primary productivity (kcal/m2/yr)
 Savanna. Agricultural land. Woodland and shrubland. Temperate grassland. Lakes and streams. Continental shelf. Open ocean. Tundra (arctic and alpine) Desert scrub. Extreme desert ,600. 2,400. 3,200. 4,000. 4,800. 5,600. 6,400. 7,200. 8,000. 8,800. 9,600. Average net primary productivity (kcal/m2/yr)")
48
Fate of Primary Productivity and Some important questions…
Since producers are ultimate source of all food, why shouldn’t we just harvest the plants of the world’s marshes? Why don’t we clear cut tropical rainforests to grow crops for humans? Why not harvest primary producers of the world’s vast oceans? Vitousek et al: Humans now use, waste, or destroy about 27% of earth’s total potential NPP and 40% of the NPP of the planet’s terrestrial ecosystems

49
Lakes and ponds are ecologically diverse
Lakes and ponds are bodies of open, standing water Littoral zone = region ringing the edge of a water body Benthic zone = extends along the entire bottom of the water body Home to many invertebrates Limnetic zone = open portions of the lake or pond where the sunlight penetrates the shallow waters Profundal zone = water that sunlight does not reach Supports fewer animals because there is less oxygen 49

50
Zonation in Lakes Zonation in Lakes
The photic zone is an area where there is sufficient light for photosynthesis. Within the photic zone, the shallow area found close to shore is designated as the littoral zone, the surface water away from the shore is referred to as the limnetic zone. The area where very little light penetrates and the primary organisms are heterotrophic is called the aphotic zone. The benthic zone (the bottom of lakes) and profundal zone contain organisms that feed off decaying organic matter called detritus. The benthic zone usually has higher biodiversity than the profundal zone. Lakes are often are categorized as oligotrophic or eutrophic by their production of organic matter. Oligotrophic lakes are generally deeper, have sparse nutrients, and clear blue water. Euthophic lakes tend to be more shallow and have a rich nutrient supply. References: Campbell, N.E., & Reece, J.B. (2002). Biology,(6th ed.). San Francisco: Benjamin Cummings. Raven, P.H., & Johnson, G.B. (2002). Biology, (6th ed.). McGraw-Hill. Image Reference: Baylor College of Medicine, Center For Educational Outreach. (2004). Martha Young, Senior Graphic Designer.
 and profundal zone contain organisms that feed off decaying organic matter called detritus. The benthic zone usually has higher biodiversity than the profundal zone. Lakes are often are categorized as oligotrophic or eutrophic by their production of organic matter. Oligotrophic lakes are generally deeper, have sparse nutrients, and clear blue water. Euthophic lakes tend to be more shallow and have a rich nutrient supply. References: Campbell, N.E., & Reece, J.B. (2002). Biology,(6th ed.). San Francisco: Benjamin Cummings. Raven, P.H., & Johnson, G.B. (2002). Biology, (6th ed.). McGraw-Hill. Image Reference: Baylor College of Medicine, Center For Educational Outreach. (2004). Martha Young, Senior Graphic Designer.")
51
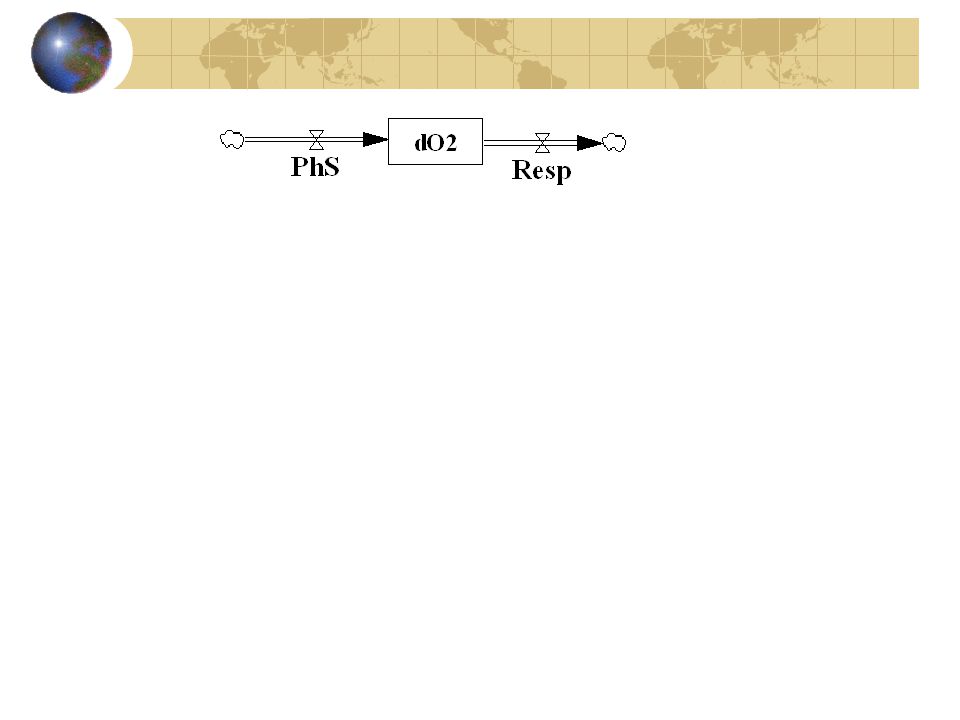
NPP as a function of Depth:Phs and Resp

52
NPP as a function of Depth:Phs and Resp

53
Thermal Stratification in Lakes
Explanation of Stratification and Mixing Animation Of Lake Turnover Thermal Stratification in Lakes Large bodies of water often have layers with different temperatures. In the summer, the top layer (epilimnion) is warmer than the bottom layer (hypolimnion). The boundary between the upper and lower layers is called the thermocline. Winter approaches and the upper layer cools, eliminating the thermocline. Winds create circulation and the top and bottom regions will mix (called fall overturn). In the spring, the temperature of the upper layer (now the coolest layer) warms and the layers mix in what is called the spring overturn. The mixing of oxygen and other nutrients between the upper and lower regions during seasonal overturns supplies essential ingredients for organisms in lake ecosystems. References: Campbell, N.E., & Reece, J.B. (2002). Biology,(6th ed.). San Francisco: Benjamin Cummings. Raven, P.H., & Johnson, G.B. (2002). Biology, (6th ed.). McGraw-Hill. Image Reference: Baylor College of Medicine, Center For Educational Outreach. (2004). Martha Young, Senior Graphic Designer.
 is warmer than the bottom layer (hypolimnion). The boundary between the upper and lower layers is called the thermocline. Winter approaches and the upper layer cools, eliminating the thermocline. Winds create circulation and the top and bottom regions will mix (called fall overturn). In the spring, the temperature of the upper layer (now the coolest layer) warms and the layers mix in what is called the spring overturn. The mixing of oxygen and other nutrients between the upper and lower regions during seasonal overturns supplies essential ingredients for organisms in lake ecosystems. References: Campbell, N.E., & Reece, J.B. (2002). Biology,(6th ed.). San Francisco: Benjamin Cummings. Raven, P.H., & Johnson, G.B. (2002). Biology, (6th ed.). McGraw-Hill. Image Reference: Baylor College of Medicine, Center For Educational Outreach. (2004). Martha Young, Senior Graphic Designer.")
54
Nitrogen Cycle Nitrogen Cycle
A major component of the atmosphere, nitrogen is essential for all living things. However, most organisms are unable to use the gaseous forms of nitrogen present in the atmosphere. In order for nitrogen to be usable by most organisms, it must be “fixed,” in other words, combined with oxygen, hydrogen or carbon to form other molecules. Nitrogen fixation can happen during rainstorms, which yields nitrate and ammonium ions. Nitrogen also can be fixed biologically by free- living and symbiotic bacteria. Leguminous plants, for example, host nitrogen-fixing bacteria in root nodules allowing them to capture nitrogen and incorporate it into proteins and other molecules. Unlike other organisms, nitrogen fixing bacteria are able to convert atmospheric nitrogen to ammonia, which then can serve as raw material for the incorporation of nitrogen into other molecules. The other four important steps in the nitrogen cycle are: (1) assimilation (reduction of nitrate ions [NO2-] inside plants to ammonium ions [NH4+], which are used to manufacture proteins and other molecules; this conversion requires energy); (2) ammonification (release of excess nitrogen in the form of ammonia [NH3] and ammonium ions [NH4+] by soil-dwelling bacteria and some fungi during the decomposition of complex organic compounds such as proteins, and nucleic acids); (3) nitrification (the oxidation of ammonium ions or ammonia by free- living, soil dwelling bacteria to nitrates [NO2-]; and (4) denitrification (the conversion of nitrate to gaseous nitrogen [N2 ] by free-living bacteria in soil; this conversion yields energy and occurs in conditions with low levels of oxygen). References: Campbell, N.E., & Reece, J.B. (2002). Biology,(6th ed.). San Francisco: Benjamin Cummings. Image Reference: Baylor College of Medicine, Center For Educational Outreach. (2004). Martha Young, Senior Graphic Designer.
 assimilation (reduction of nitrate ions [NO2-] inside plants to ammonium ions [NH4+], which are used to manufacture proteins and other molecules; this conversion requires energy); (2) ammonification (release of excess nitrogen in the form of ammonia [NH3] and ammonium ions [NH4+] by soil-dwelling bacteria and some fungi during the decomposition of complex organic compounds such as proteins, and nucleic acids); (3) nitrification (the oxidation of ammonium ions or ammonia by free- living, soil dwelling bacteria to nitrates [NO2-]; and (4) denitrification (the conversion of nitrate to gaseous nitrogen [N2 ] by free-living bacteria in soil; this conversion yields energy and occurs in conditions with low levels of oxygen). References: Campbell, N.E., & Reece, J.B. (2002). Biology,(6th ed.). San Francisco: Benjamin Cummings. Image Reference: Baylor College of Medicine, Center For Educational Outreach. (2004). Martha Young, Senior Graphic Designer.")
55
Nutrient pollution Pollution = the release of matter or energy into the environment that causes undesirable impacts on the health and well-being of humans or other organisms

56
Lakes vary in their nutrients and oxygen
Nutrient pollution from fertilizers, farms, sewage, lawns, golf courses Leads to eutrophication Oligotrophic lakes and ponds = have low nutrient and high oxygen conditions Eutrophic lakes and ponds = have high nutrient and low oxygen conditions Solutions Phosphate-free detergents Planting vegetation to increase nutrient uptake Treat wastewater Reduce fertilizer application 56

57
Eutrophication is a natural process, but…
Human activities dramatically increase the rate at which it occurs

58
Accelerated results with human input of nutrients to a lake
Eutrophication Accelerated results with human input of nutrients to a lake © Brooks/Cole Publishing Company / ITP Water Resources and Water Pollution by Paul Rich

59
What’s Happening to the Otters?

60
Some organisms play big roles
Keystone Species = has a strong or wide- reaching impact far out of proportion to its abundance Removal of a keystone species has substantial ripple effects Alters the food chain

61
Species can change communities
Trophic Cascade = predators at high trophic levels can indirectly affect populations of organisms at low trophic levels by keeping species at intermediate trophic levels in check Extermination of wolves led to increased deer populations, which led to overgrazed vegetation and changed forest structure Ecosystem engineers = physically modify the environment Beaver dams, prairie dogs, fungi

62
Surface Water Surface runoff flows into streams, lakes, wetlands and reservoirs A watershed or drainage basin Region that drains into a streams, lakes, wetlands or reservoirs watershed.asp

63
Rivers and streams wind through landscapes
Water from rain, snowmelt, or springs forms streams, creeks, or brooks These merge into rivers, and eventually reaches the ocean Tributary = a smaller river slowing into a larger one Watershed = the area of land drained by a river and its tributaries

64
A river may shift course
Floodplain = areas nearest to the river’s course that are flooded periodically Discharge and Sediment Load Frequent deposition of silt makes floodplain soils fertile Riparian = riverside areas that are productive and species-rich Water of rivers and streams hosts diverse ecological communities 64

65
Rivers shape the landscape
If there is a large bend in the river, the force of the water cuts through the land Oxbow = an extreme bend in a river Oxbow lake = the bend is cut off and remains as an isolated, U-shaped body of water 65

66
Wetlands include marshes, swamps, and bogs
Wetlands = systems that combine elements of freshwater and dry land Freshwater marshes = shallow water allows plants to grow above the water’s surface Swamps = shallow water that occurs in forested areas Can be created by beavers Bogs = ponds covered in thick floating mats of vegetation A stage in aquatic succession 66

67
Wetlands are valuable Wetlands are extremely valuable for wildlife
They slow runoff Reduce flooding Recharge aquifers Filter pollutants People have drained wetlands, mostly for agriculture Southern Canada and the U.S. have lost more than half of their wetlands 67

Similar presentations