Download presentation
Presentation is loading. Please wait.

1
Racial Disparities in Criminal Justice in Wisconsin Pamela Oliver

2
Plan for the Talk National overview Wisconsin patterns in imprisonment (with mention of overall incarceration) Age Patterns of imprisonment in Wisconsin County comparisons in imprisonment County comparisons in arrests: Short Implications: making the problem worse What is to be done
 Age Patterns of imprisonment in Wisconsin County comparisons in imprisonment County comparisons in arrests: Short Implications: making the problem worse What is to be done")
3
The Magnitude of the Problem

4
Comparing International Incarceration Rates (Source: Sentencing Project)
")
5
World Incarceration Rates in 1995: Adding US Race Patterns

6
Nationally, The Black Population is Being Imprisoned at Alarming Rates Upwards of 1/3 of the Black male population is under the supervision of the correctional system (prison, jail, parole, probation) Estimated “lifetime expectancy” of spending some time in prison is 29% for young Black men. About 12% of Black men in their 20s are in prison 7% of Black children, 2.6% of Hispanic children,.8% of White children have a parent in prison (at one time) – lifetime expectancy much higher
 – lifetime expectancy much higher.")
7
About Rates & Disparity Ratios Imprisonment and arrest rates are expressed as the rate per 100,000 of the appropriate population Example: In 1999 Wisconsin new prison sentences –1021 Whites imprisoned, White population of Wisconsin was 4,701,123: 1021 ÷ 4701123 =.000217. Multiply.00021 by 100,000 = 22, the imprisonment rate per 100,000 population. –1,266 Blacks imprisoned, Black population of Wisconsin was 285,308. 1266 ÷ 285308 =.004437. Multiply by 100,000 = 444 Calculate Disparity Ratios by dividing rates: 444/22 = 20.4 the Black/White ratio in new prison sentence rates

8
US Prison Admissions by Race

9
The 1970’s Policy Shift Shift to determinate sentencing, higher penalties LEAA, increased funding for police departments Crime becomes a political issue Drug war funding gives incentives to police to generate drug arrests & convictions Post-civil rights post-riots competitive race relations, race-coded political rhetoric.?

11
Social Conditions, Political Processes, Crime, and Corrections

12
Imprisonment Has Increased While Crime Has Declined Imprisonment rates are a function of responses to crime, not a function of crime itself Property crimes declined steadily between 1970s and 2000 Violent crime declined modestly overall, with smaller ups and downs in the period

13
Crime Trends Source: Crunching Numbers: Crime and Incarceration at the End of the Millennium by Jan M. Chaiken Based on Bureau of Justice Statistics data from National Crime Victimization Survey. Figures adjusted for changed methodology, shaded area marks change.

14
Property Crime

15
Violent Crime

16
Rape

17
The Drug War Most of the increase in imprisonment is due to drug offenses. Drug use rates have generally declined since the 1980s, while drug imprisonments have increased. Black adult drug use rates are only slightly higher than White (see next chart), while their imprisonment rates for drugs are enormous Among juveniles, Blacks use illegal drugs less than Whites, but Black juveniles have much higher drug arrest rates.
, while their imprisonment rates for drugs are enormous Among juveniles, Blacks use illegal drugs less than Whites, but Black juveniles have much higher drug arrest rates..")
18
Current Illicit Drug Use Among Adults (National Patterns) 6.6 percent for Whites 6.8 percent for Hispanics 7.7 percent for Blacks 10.6 percent for American Indian/Alaska Natives (this is largely marijuana, rates for other drugs are lower than other races) 11.2 percent for persons reporting multiple race 3.2 percent for Asians Source: 1999 National Household Survey on Drug Abuse
 6.6 percent for Whites 6.8 percent for Hispanics 7.7 percent for Blacks 10.6 percent for American Indian/Alaska Natives (this is largely marijuana, rates for other drugs are lower than other races) 11.2 percent for persons reporting multiple race 3.2 percent for Asians Source: 1999 National Household Survey on Drug Abuse")
19
Wisconsin’s High Black Incarceration Rate Headlines in 2002 “Wisconsin #1 in Black incarceration in 2001”

20
Contributors to Incarceration Rates Prisons (state-level & federal facilities) –New sentences for new offenses –Length of sentence for each offense –Probation & parole revocations Jails (local county-level facilities) –Short-term sentences for convictions (number & length per sentence –Held awaiting trial –Held awaiting probation/parole revocation hearing Growing use of prisons/jails for disruptive mentally ill
 –New sentences for new offenses –Length of sentence for each offense –Probation & parole revocations Jails (local county-level facilities) –Short-term sentences for convictions (number & length per sentence –Held awaiting trial –Held awaiting probation/parole revocation hearing Growing use of prisons/jails for disruptive mentally ill")
21
Disparities Higher For Prison than Jail BJS said Wisconsin’s overall Black/White incarceration disparity is 10 to 1. Prison disparity is closer to 20 to 1 This means there is less disparity in jail than prisons Most of Wisconsin’s counties are overwhelmingly White, presumably have overwhelmingly Whites in their jails Prisons in Wisconsin are now majority Black despite Blacks being only 5% of general population

22
Wisconsin Prison Admissions Including Detailed Time Trends 1990-1999

23
New Imprisonment Rates by State, 1996

24
National & Wisconsin Imprisonment Rates

25
Wisconsin Prison Admissions by Race Black Asian White Hispanic AmerInd

26
Total Admits, Whites Wisconsin: White NH Total Prison Admissions Violent Robbery & Burglary Other Drugs Theft

27
Total Admits, Offense Blacks Violent Robbery & Burglary Other Drugs Theft

28
Total Admits, Hispanics Violent Robbery & Burglary Other Drugs Theft

29
Proportion of Admissions Involving New Sentences

30
White Admissions Status New Sentence Only Violation Only Violation + New

31
Blacks Admission Status New Sentence Only Violation Only Violation + New

32
Total admits, violations only AmerInd Black Hispanic White Asian

33
Whites, Violators Violent Robbery & Burglary Other Drugs Theft

34
Black violators Violent Robbery & Burglary Other Drugs Theft

35
Total Admits, New Sentences Only Prison Admission by Race 1990-1999, New Sentence Only Black Asian White Hispanic AmerInd

36
New Sentences, Whites Violent Robbery & Burglary OtherDrugsTheft

37
New Sentences, Blacks Offense Violent Robbery & Burglary Other Drugs Theft

38
Conclusions About Wisconsin Prison Admissions Huge racial disparities, especially Black vs. White Probation/parole violators returning to prison are a major source of the rise Blacks show steep rises in new sentences for drugs, while Whites show no increase White new sentences are primarily for violent offenses. Black new sentences are primarily for drug offenses.

39
Age Patterns for Imprisonment

40
New sentences by age, race

41
Offenses by Age, Whites

42
Offenses by Age, Blacks

43
Disparities by Age, Offense

44
County Comparisons

45
Males in prison per 100,000 population in April 2000, Wisconsin Counties with More than 1000 Non-Prisoner Blacks # counties with < 1000 American Indians Graphic calculated using 1999 population estimates

46
Females in Prison per 100,000 population in April, 2000,Wisconsin Counties with More than 1000 Non-Prisoner Blacks # counties with < 1000 American Indians Graphic calculated using 1999 population estimates

47
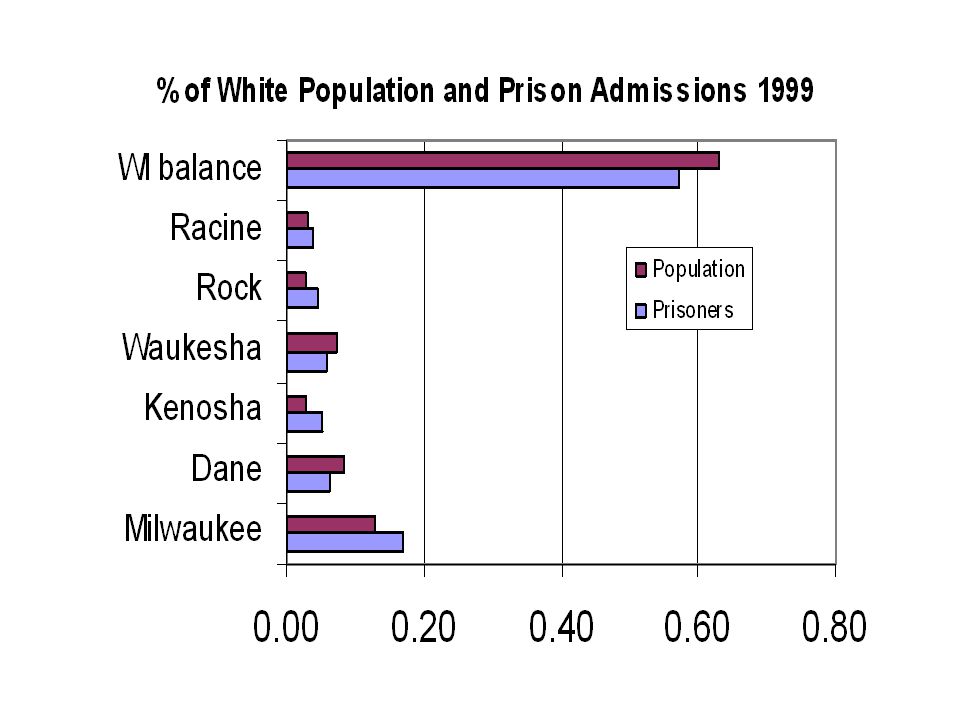
Total Prison Admissions Per 100,000 in 1999

48
Compare Counties Whites New Sentences

49
Compare counties Black, new sentences thick

50
Compare Counties, New Sentences B/w ratio

51
County Drug Disparities by Time WI Bal. Dane Waukesha Milwaukee Racine Kenosha Rock

52
Compare counties, Whites violations

53
Compare Counties, Blacks Violations

54
Compare Counties, Violations B/W ratio

55
Milwaukee New Totals AmerInd Black Hispanic White Asian

56
Milwaukee New Black Violent Robbery & Burglary Other Drugs Theft

57
Milwaukee New White Violent Robbery & Burglary Other Drugs Theft

58
Dane New Totals All Races AmerInd Black Hispanic White Asian

59
Dane New Black Violent Robbery & BurglaryOther Drugs Theft

60
Dane New White Violent Robbery & Burglary Other Drugs Theft

61
Racine Totals New Sentences

62
Racine New Black

63
Racine New White

64
Kenosha new totals AmerInd Black Hispanic white Asian

65
Kenosha New Black

66
Kenosha New White

67
Rock New Totals

68
Rock New Black

69
Rock New White

70
Waukesha Total

71
Waukesha New Black

72
Waukesha New White

73
WI balance total AmerInd Black Hispanicwhite Asian

74
WI balance new black

75
WI balance new white

78
Dane vs. Milwaukee Counties A more detailed look at offense breakdowns

79
Prison Entry From Dane County 1999, by offense and race

80
Dane County Prison Admissions per 100,000 by race & offense, 1999 (Totals: Black 3361, White 87)
")
81
Milwaukee and Dane County Prison

82
Milwaukee and Dane County Arrests

83
Milwaukee County: Allocating Disparities to Arrest vs. Post-Arrest Processing ~72% of difference is due to arrest differentials

84
Dane County : Allocating Disparities to Arrest vs. Post-Arrest Processing ~ 37% of difference is due to arrest differentials

85
Arrest Rates in Madison & Milwaukee, 1998-1999 Source: Uniform Crime Reports Data obtained from Wisconsin Office of Justice Assistance

86
Annual Arrest Rate Per 100,000 Madison PD 1998-1999

87
Adult Arrest Rates Per 100,000 Average 1998-1999

88
Juvenile Arrest Rates Per 100,000 Average 1998-1999

89
Total Juvenile Arrests

90
Adult, Total arrests

91
Arrests 1997-1999 Averages: Adult Disparity Ratios

92
Arrests 1997-1999 Averages: Juvenile Disparity Ratios

93
Rates of Arrest for Specific Offenses 1998-9 Dane County Juveniles

94
Rates of Arrest for Specific Drug Offenses, 1998-9 Dane County Juveniles

95
Rates of Arrest for Specific Offenses 1998-9 Dane County Juveniles

96
Conclusions The drug war is being fought “against Blacks” and this problem is especially bad in Wisconsin Probation/parole violation holds are a major source of arrests and a major source of jail crowding. Large racial disparities in serious crimes indicate a real problem that needs to be addressed Racial patterns of arrests for lesser offenses create “prior offenses” which affect sentencing

97
Making Things Worse High imprisonment rates (including longer sentences, high rates of probation/parole revocation) are not a constructive way of dealing with the problem of non- violent property crimes (thefts) and drug offenses Enormous expenses to house these offenders in prison Destruction of offenders’ lives and and serious harm to their families Because of racial targeting of the drug war, the harmful consequences of this policy are being concentrated in Black communities, while the beneficiaries of the policy do not pay its price
 are not a constructive way of dealing with the problem of non- violent property crimes (thefts) and drug offenses Enormous expenses to house these offenders in prison Destruction of offenders’ lives and and serious harm to their families Because of racial targeting of the drug war, the harmful consequences of this policy are being concentrated in Black communities, while the beneficiaries of the policy do not pay its price")
98
Effects of Incarceration Criminal Records + Racial Discrimination Hurt Employment Opportunities Next few slides are from research by Devah Pager, new PhD from University of Wisconsin Sociology, Now on faculty at Northwestern This was a controlled experiment in which matched pairs of applicants applied for entry- level jobs advertised in Milwaukee newspapers

99
Figure 4. The Effect of a Criminal Record on Employment Opportunities for Whites

100
Figure 5. The Effect of a Criminal Record for Black and White Job Applicants

101
An Individual Life Course Model of Crime With Policing Added

102
Imprisonment as a Cause of Crime?

103
What is to be done? This is not a sound bite issue. Factors include a combination of bias, real differences in serious crime, social & political conditions Patterns are arising from the core structures of our society But there are steps we can take

104
Oppose the “drug war” Treatment and public education are the most effective ways to reduce drug use Drug enforcement just increases the profits of illegal drugs, makes the problem worse Learn about the consequences of alcohol prohibition: drive-by shootings, organized crime The largest racial disparities are for drug offenses Association of violence with drugs is due to illegality & police enforcement

105
Oppose “tough on crime” rhetoric Help depoliticize crime as an issue Distinguish among different kinds of crimes Take the crime problems of poor (& economically integrated) neighborhoods seriously without over-reacting and “middle class panic” Call for rehabilitation & restoration for lesser offenses, not “lock ‘em up”
 neighborhoods seriously without over-reacting and middle class panic Call for rehabilitation & restoration for lesser offenses, not lock ‘em up")
106
Revisit probation & parole The vast majority of offenders are not murderers or rapists – they will get out Insist the system focus on rehabilitating and reintegrating offenders, rather than looking for opportunities to incarcerate them NOTE: Wisconsin has abolished parole, but has “extended supervision”

107
Address “root causes” of crime Reduce poverty and deprivation through income transfers (e.g. earned income credit), training programs, living wages Provide social support, education, constructive alternatives for juveniles who are not doing well in school Need to break the inter-generational cycle caused by massive incarceration
, training programs, living wages Provide social support, education, constructive alternatives for juveniles who are not doing well in school Need to break the inter-generational cycle caused by massive incarceration.")
108
Address racial bias & prejudice Racial discrimination in employment & housing reduce constructive options Conscious and unconscious biases, perceptions, assumptions affect policing & sentencing White fear of crime more sensitive to presence of Blacks than to actual crime rates Politicians play on Whites’ race-tinged crime fears in pushing “tough on crime” policies

109
Racism and Justice: Conclusions We cannot move from an unjust to a just situation by ignoring race and pretending the disparities are not there We cannot achieve racial justice by ignoring the real differences in serious crimes, economic & social conditions We cannot achieve racial justice by treating this as “somebody else’s” problem Politics caused the problem, and politicians need to be part of the solution

Similar presentations


 FBI Compiles data from the nation’s law enforcement agencies on crime for: Numbers of arrests Reports of crimes This is the.>")


