Download presentation
Presentation is loading. Please wait.

1
Land-use effects on spatial and temporal patterns of carbon storage and flux in PNW forests David Wallin Department of Environmental Sciences Huxley College of the Environment Western Washington University Bellingham, WA

2
Collaborators Peter Homann: Dept. of Environmental Sciences, Huxley College, WWU Mark Harmon: Dept. of Forest Science, Oregon State University Warren Cohen: USDA Forest Service, PNW Research Station Olga Krankina: Dept. of Forest Science, Oregon State University

3
Why is the global carbon cycle important? All life on the planet is based upon the cycling of carbon

4
Carbon Cycling Photosynthesis 6CO 2 + 12H 2 0 Life 6O 2 + C 6 H 12 O 6 + 6H 2 0 Respiration Photosynthesis and respiration are among the most important mechanisms controlling the global carbon cycle Plants use CO 2 from the atmosphere as a source of both C and O for the production of glucose (C 6 H 12 O 6 ), with H 2 0 providing the necessary H
, with H 2 0 providing the necessary H")
5
Carbon Cycling Glucose (C 6 H 12 O 6 ) is the central carbohydrate compound of protoplasm, and carbohydrates constitute a large percentage of the total dry biomass of plants. Glucose is composed of: 6 atoms of C; atomic wt = 1272 6 atoms of O; atomic wt = 1696 12 atoms of H; atomic wt = 112 ---- 180 So, (72 + 96)/180 = 0.93 93% of the mass of the glucose molecule is derived directly from air!
/180 = % of the mass of the glucose molecule is derived directly from air!.")
6
Carbon Cycling Plants, and animals, are composed of more than just C, O, and H; other important elements include N, P and K. Nevertheless, about half of the dry biomass of plants is composed of C and this C is derived entirely from the atmosphere.

7
Why is the global carbon cycle important? All life on the planet is based upon the cycling of carbon Atmospheric concentrations of CO 2 have increased substantially over the past century or so, largely as a result of the combustion of fossil fuels

8
Long-term variation in atmospheric CO 2 concentrations: The Vostok ice core

9
Recent trends in atmospheric CO 2 concentrations: The role of fossil fuel burning

10
Even more recent records reveal that atmospheric CO 2 concentrations continue to increase

11
Why is the global carbon cycle important? All life on the planet is based upon the cycling of carbon Atmospheric concentrations of CO 2 have increased substantially over the past century or so, largely as a result of the combustion of fossil fuels CO 2 is a “greenhouse gas” and, as such, increasing atmospheric concentrations of CO 2 have the potential to cause major changes in the earth’s climate

12
A “Greenhouse Gas”; What does this mean? I. The Electromagnetic Spectrum

13
A “Greenhouse Gas”; What does this mean? II. Sources of EM Energy –The amount of energy emitted by an object (area under the curve) and the wavelength of peak emission area function of the temperature of the object
 and the wavelength of peak emission area function of the temperature of the object.")
14
A “Greenhouse Gas”; What does this mean? III. Interaction of EM energy with solids, liquids and gasses

15
A “Greenhouse Gas”; What does this mean? IV. Greenhouse gasses absorb EM energy very strongly at wavelengths (8-10 um) where the earth is emitting EM energy to space. This results in a warming of the atmosphere.
 where the earth is emitting EM energy to space. This results in a warming of the atmosphere..")
16
Major reservoirs in the global carbon cycle Atmosphere 748 Pg Terrestrial 2,000 Pg Oceans38,000 Pg Geologic 4,000 Pg The geologic stores of recoverable fossil fuels were a relatively inactive reservoir in the global carbon cycle prior to the industrial revolution. Pg = 10 15 grams

17
Sources and Sinks in the global carbon budget: 1980-1995 Fossil fuel combustion 5.7 Pg C/yr Land-use emissions 1.9 Pg C/yr Oceans-2.1 Pg C/yr Atmosphere-3.2 Pg C/yr “The Missing Sink” 2.3 Pg C/yr Houghton 2000 J. Geophys. Res. 105:20121-20130

18
Northern Hemisphere, Mid- latitude Forests: The Missing Sink? YES: Based on Atmospheric models that infer the combination of sources and sinks in atmospheric transport models that best match the global atmospheric CO 2 data NO: Most land-based approaches using inventory data and ecosystem models have not been consistent with predictions, however, these studies have revealed significant heterogeneity in both space and time for terrestrial C pools and fluxes. These results have pointed to the need for more careful regional-scale analyses of C pools and fluxes. MAYBE (…Probably?…): Most recent results for the coterminous U.S. (Pacala et al. Science 292:2316) are consistent with the atmospheric studies, suggesting a net sink of 0.3-0.58 Pg C/yr (0.39-0.76 Mg C/ha/yr).
: Most recent results for the coterminous U.S. (Pacala et al. Science 292:2316) are consistent with the atmospheric studies, suggesting a net sink of Pg C/yr ( Mg C/ha/yr)..")
19
Regional-scale analyses are needed Analyses at the global and continental scale mask spatial and temporal heterogeneity in terrestrial C pools and fluxes An understanding of this heterogeneity is needed to narrow the remaining uncertainty in the global C budget. An understanding of this heterogeneity may reveal opportunities for management action that could increase C storage in terrestrial systems.

20
Land-use Impacts on PNW Forests PNW forests are among the most productive in the world. These forests have the capacity to store significant amounts of C Timber harvest activities in this region have the capacity to have a major impact on C flux.

21
Recent changes in harvest rates Or. Dept. Forestry Harvest Stats. Westside Timber Harvest in Oregon

22
Disturbed Forest Carbon Model Atmosphere Onsite -Living -Detrital Offsite -Forest Products Harmon et al. 1990. Science 247:669

23
LANDCARB: A landscape-level carbon model Quantifying carbon dynamics at the landscape and regional scale requires the use of a model that captures the spatial and temporal complexities in terrestrial systems Satellite data can provide information on spatial and temporal heterogeneity A detailed stand-level model (STANDCARB) is used to parameterize a simplified “metamodel” that can be applied to individual grid cells corresponding to the ground resolution of the satellite imagery.
 is used to parameterize a simplified metamodel that can be applied to individual grid cells corresponding to the ground resolution of the satellite imagery.")
24
Carbon Storage following the disturbance of an old-growth stand Site Index 3

30
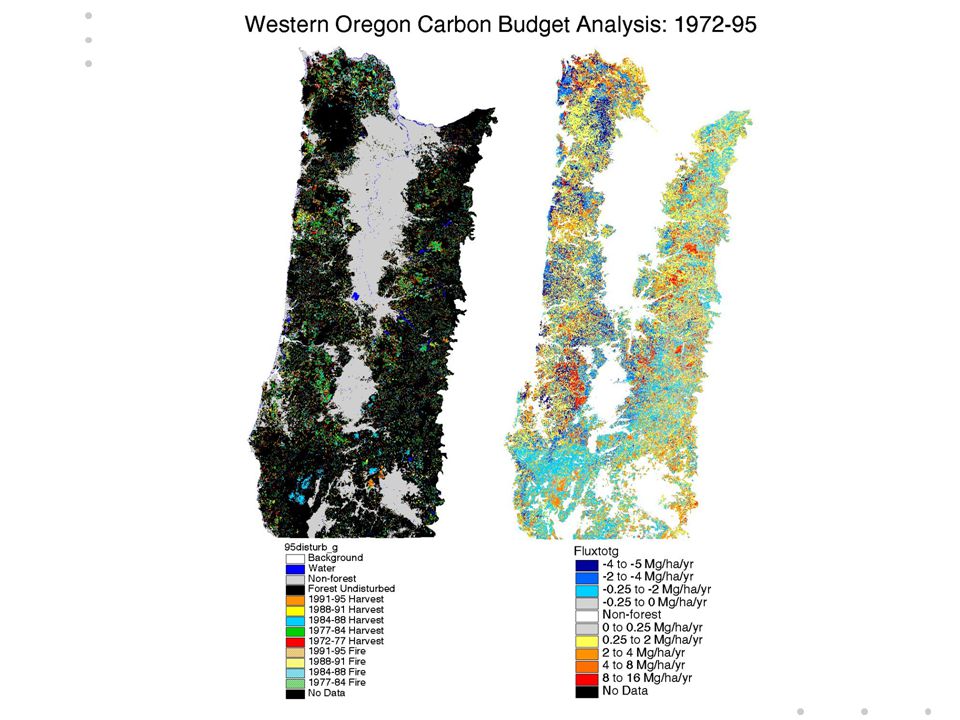
Overall Carbon flux from Western Oregon: 1972-95 A net SOURCE for 0.68 Mg C/ha/yr during 1972-95

31
Range of variation in carbon flux

33
Model Validation

34
Source for 0.68 Mg C/ha/yr Sink for 1.24 Mg C/ha/yr

35
“What If” No timber harvests conducted from 1972-95? A net SINK for 1.24 Mg C/ha/yr during 1972-95

36
Effect of Rotation Length on Carbon Storage

38
Summary Over the past 23 years, the forests of Western Oregon have been a net source for 0.68 Mg C/ha/yr Across the study area, C flux ranged from a sink of 4.7 to a source of 13.2 Mg C/ha/yr This variability was related to land-use history, ownership and site conditions In the absence of timber harvesting between 1972 and 1995, this area would have been a net sink for 1.24 Mg C/ha/yr Our results demonstrate that timber harvesting has had a major impact on the regional carbon budget and that changes in timber management practices could result in the sequestration of significant amounts of carbon in the region

Similar presentations


 and ecosystem interactions with climate Carbon management (e.g.,>")


 Autumn Sun 1.>")


