Download presentation
Presentation is loading. Please wait.

1
Global Carbon Cycle Feedbacks: From pattern to process Dave Schimel NEON inc

2
Fate of Anthropogenic CO 2 Emissions (2000-2007) Canadell et al. 2007, PNAS (updated); Slide from global Carbon Project 1.5 Pg C y -1 + 7.5 Pg C y -1 Atmosphere 46% 4.2 Pg y -1 Land 29% 2.6 Pg y -1 Oceans 26% 2.3 Pg y -1
; Slide from global Carbon Project 1.5 Pg C y Pg C y -1 Atmosphere 46% 4.2 Pg y -1 Land 29% 2.6 Pg y -1 Oceans 26% 2.3 Pg y -1.")
3
The Basic Narrative of Climate Change and the Carbon Cycle Energy Balance Water vapor Temperature We are changing the Carbon Cycle Which causes a change in the distribution of the energy reaching the Earth Which warms the planet Which changes the water cycle Which amplifies the climate change, mainly because of increased water vapor Eventually feeding back on the carbon cycle

4
Carbon cycle feedbacks Terrestrial uptake and release depend on temperature and precipitation Terrestrial uptake depends on atmospheric CO 2 concentration The above feedbacks depend on nutrient cycles Terrestrial carbon storage depends on ecosystem type, which depends on climate And then there are the oceans (for another talk) –And this all leads to model uncertainty…..
 –And this all leads to model uncertainty…..")
5
The C4MIP uncertainty figure

6
Status of global models ? Current models match local and some global observations but often predict variables and scales that are hard to validate (same problem as in night 1 talks) Current models give drastically different predictions under climate change despite similar skill levels for the present day
 Current models give drastically different predictions under climate change despite similar skill levels for the present day.")
7
What can we constrain from observations?

8
Pattern: the interhemispheric gradient implies a Northern Hemisphere sink TFT 1990

9
What does a Northern Hemisphere land sink imply? CO 2 fertilization implies a global sink The Northern hemisphere is perturbed by historical land use, air pollution, nonstationary disturbance regimes (fire) Therefore, this spatial pattern suggests weak CO 2 and strong land use+climate effects For the purposes of this talk, I will make that assumption, although recent observational data suggests it may be false…
 Therefore, this spatial pattern suggests weak CO 2 and strong land use+climate effects For the purposes of this talk, I will make that assumption, although recent observational data suggests it may be false….")
10
Patterns in time:

11
The impact of carbon–climate feedback on carbon storage Increased in the north, reduced in the south. Fung I Y et al. PNAS 2005;102:11201-11206 ©2005 by National Academy of Sciences

12
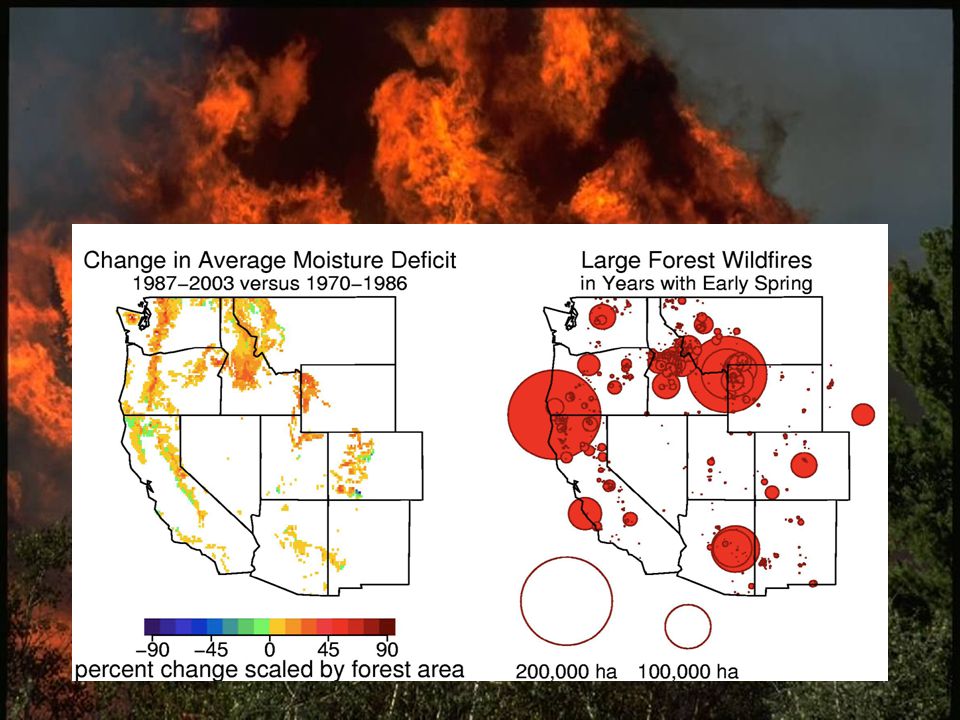
Regional differences in the change in hydrologic regime and ecosystem productivity with global warming: positive effects of warming on pant growth dominate in the North, drought in the South. Fung I Y et al. PNAS 2005;102:11201-11206 ©2005 by National Academy of Sciences

13
Observational support for the Fung and Doney hypothesis

14
Middle sites are in the middle

15
Extratropic mean normalized anomalies in the net spring uptake [dotted black line, expressed by inverted early summer (June) detrended CO2 concentration] and spring (MAM) temperature (dotted red line, weighted by NPP) (a) and in the net growing-season uptake (dotted black line, expressed by inverted seasonal minimum detrended CO2 concentration taken from the GLOBALVIEW “reference marine boundary layer matrix”) and growing season (MAMJJA) temperature (dotted red line, weighted by NPP) (b). Angert A et al. PNAS 2005;102:10823-10827 ©2005 by National Academy of Sciences
![Extratropic mean normalized anomalies in the net spring uptake [dotted black line, expressed by inverted early summer (June) detrended CO2 concentration] and spring (MAM) temperature (dotted red line, weighted by NPP) (a) and in the net growing-season uptake (dotted black line, expressed by inverted seasonal minimum detrended CO2 concentration taken from the GLOBALVIEW reference marine boundary layer matrix ) and growing season (MAMJJA) temperature (dotted red line, weighted by NPP) (b).](http://images.slideplayer.com/20/5999537/slides/slide_15.jpg "Angert A et al. PNAS 2005;102: ©2005 by National Academy of Sciences.")
16
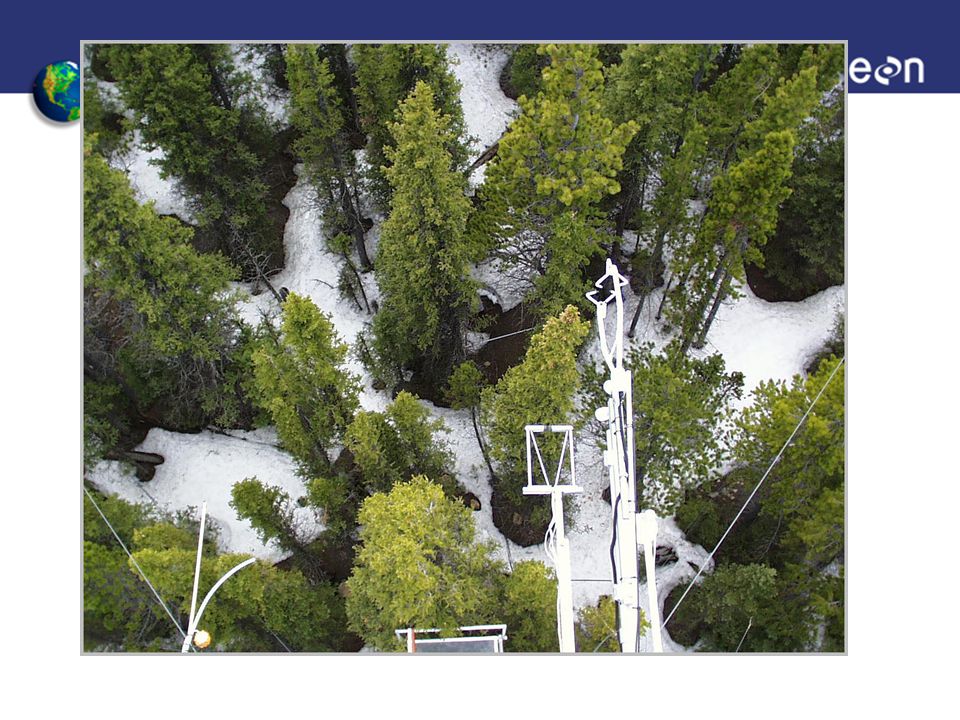
Model-data fusion Detailed analyses at a specific site Niwot Ridge, Colorado

18
Self-consistent parameter sets C S,0 (g m -2 ) K H (g g -1 y -1 )
 K H (g g -1 y -1 )")
19
Self-consistent parameter sets Fit to the diurnal cycle (~12 hour time steps) Fit to daily data: 24 hour time steps
 Fit to daily data: 24 hour time steps")
20
Observed variability of fluxes

21
Analyzed variability of processes

22
Analysis of controls Warm springs accelerate growth but also evaporation, consistent with information from spatial flux patterns and atmospheric CO 2 trends

24
Patterns in time: clues to mechanisms Emissions from Indonesian wildfire estimated by inversion of global CO 2 data

25
One more factor:: nutrient loading

26
Terrestrial stoichiometry: equilibration of plant growth with water/energy and nutrients: at equilbrium, nutrients and climate co-vary, in the transient, not.

27
Conclusions Changes to water balance driven by temperature and moisture dominate the terrestrial carbon feedback. Some of these effects are due to effects on photosynthesis and respiration. Others are due to changes in disturbance and vegetation structure. Requilibration of limiting nutrients will influence, or dominate, the transient.

28
Conclusions: the road forward In the spirit of communicating about climate change, what does this mean? 1.The terrestrial carbon-climate feedback is net positive, though internal (nutrient) feedbacks make it less positive than in simple models 2.Part of this is because of ecosystem destruction and structural change, which is partly under direct human control 3.A net positive carbon climate feedback is not just an esoteric feedback on global mean temperature, but implies damages to agriculture, forestry and associated ecosystem services that may be far more serious for human society than the (small to moderate) additional gain in the coupled climate system.
 feedbacks make it less positive than in simple models 2.Part of this is because of ecosystem destruction and structural change, which is partly under direct human control 3.A net positive carbon climate feedback is not just an esoteric feedback on global mean temperature, but implies damages to agriculture, forestry and associated ecosystem services that may be far more serious for human society than the (small to moderate) additional gain in the coupled climate system..")
30
We are changing the Carbon Cycle…

31
Upscaling from experiments: DRI Reno Face study, Nevada

Similar presentations


 Chris Huntingford,>")


 and ecosystem interactions with climate Carbon management (e.g.,>")


 Autumn Sun 1.>")


