Download presentation
Presentation is loading. Please wait.

1
Earth Systems Science Chapter 1 I. CHANGES it is the nature of dynamic systems to change, often even in the absence of external “forcings”. Some important environmental problems today require discriminating between “natural” and “anthropogenic” changes. Human impact on local environments have been known for years: e.g. deforestation in New England and Europe Today, regional impacts (acid rain, air pollution) and global impacts (“global warming”, stratospheric ozone, deforestation) are also realized to be important.
 and global impacts ( global warming , stratospheric ozone, deforestation) are also realized to be important..")
2
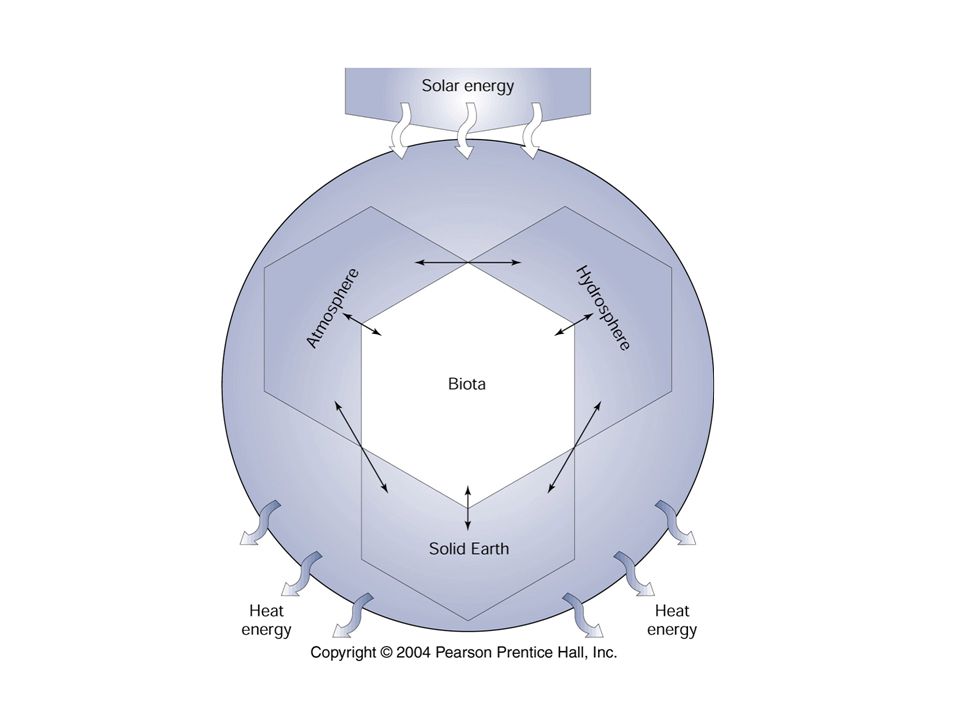
II. 3 MAJOR THEMES OF THE TEXT: 1. Global environmental issues (“global warming”, stratospheric ozone, deforestation) 2. Paleo-environmental changes 3. Systems Our goal in this class is to cover #1 and #2 as we go, but to really focus on #3. The Earth System: atmosphere, hydrosphere, lithosphere, biosphere. In this course we focus on the first three, the continuation of this course will focus more on the biosphere.
 2. Paleo-environmental changes 3. Systems Our goal in this class is to cover #1 and #2 as we go, but to really focus on #3. The Earth System: atmosphere, hydrosphere, lithosphere, biosphere. In this course we focus on the first three, the continuation of this course will focus more on the biosphere..")
4
III. GLOBAL CHANGE ON SHORT TIME SCALES 1. Global Warming 2. Stratospheric Ozone Depletion 3. Deforestation and Loss of Biodiversity How are these problems related? How are they examples of dynamic systems / dynamic equilibrium

5
1. GLOBAL WARMING define: global warming, greenhouse effect EVIDENCE OF GREENHOUSE GAS CHANGES: CO2 fluctuations Keeling curve, and ice core data Other greenhouse gases: methane (CH4), nitrous oxide (N20), and CFCs. EVIDENCE OF TEMPERATURE CHANGES Surface temperature observations
, nitrous oxide (N20), and CFCs. EVIDENCE OF TEMPERATURE CHANGES Surface temperature observations.")
6
The Keeling Curve

7
http://scrippsco2.ucsd.edu/graphics_gallery/mauna_loa_record/mauna_loa_fossil_fuel_trend.html Black Curve: Monthly average atmospheric carbon dioxide concentration versus time at Mauna Loa Observatory, Hawaii (20°N, 156°W) where CO2 concentration is in parts per million in the mole fraction (p.p.m.). Red Curve: Fossil fuel trend of a fixed fraction (57%) of the cumulative industrial emissions of CO2 from fossil fuel combustion and cement production. Data from Scripps CO2 Program.
 of the cumulative industrial emissions of CO2 from fossil fuel combustion and cement production. Data from Scripps CO2 Program..")
8
Ice Core Data and The Keeling Curve

9
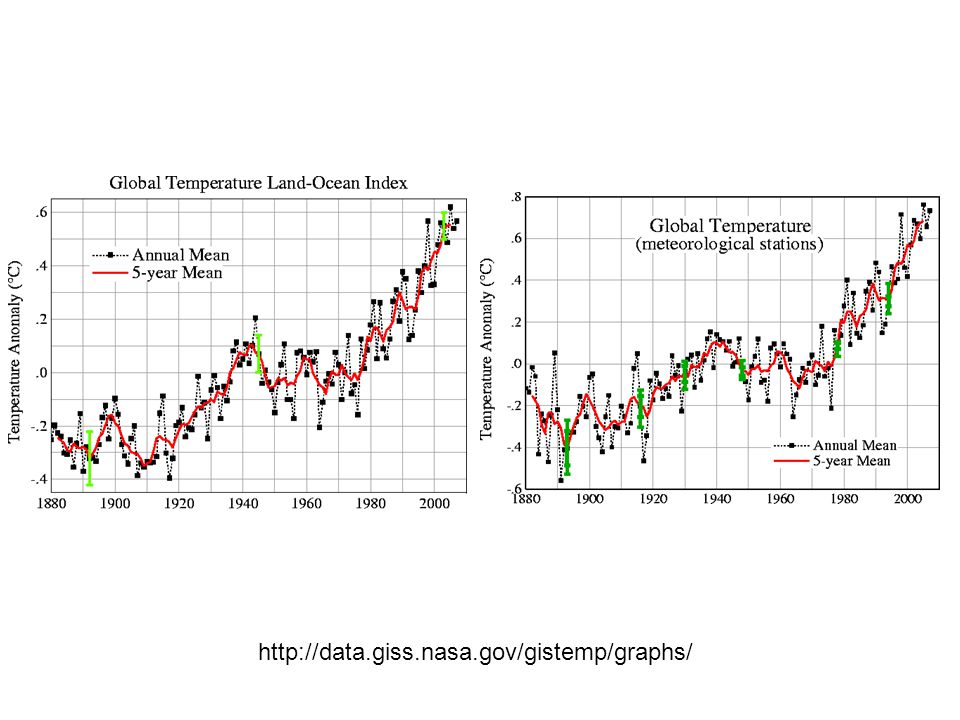
Surface Temperature Observations

10
http://data.giss.nasa.gov/gistemp/graphs/
11
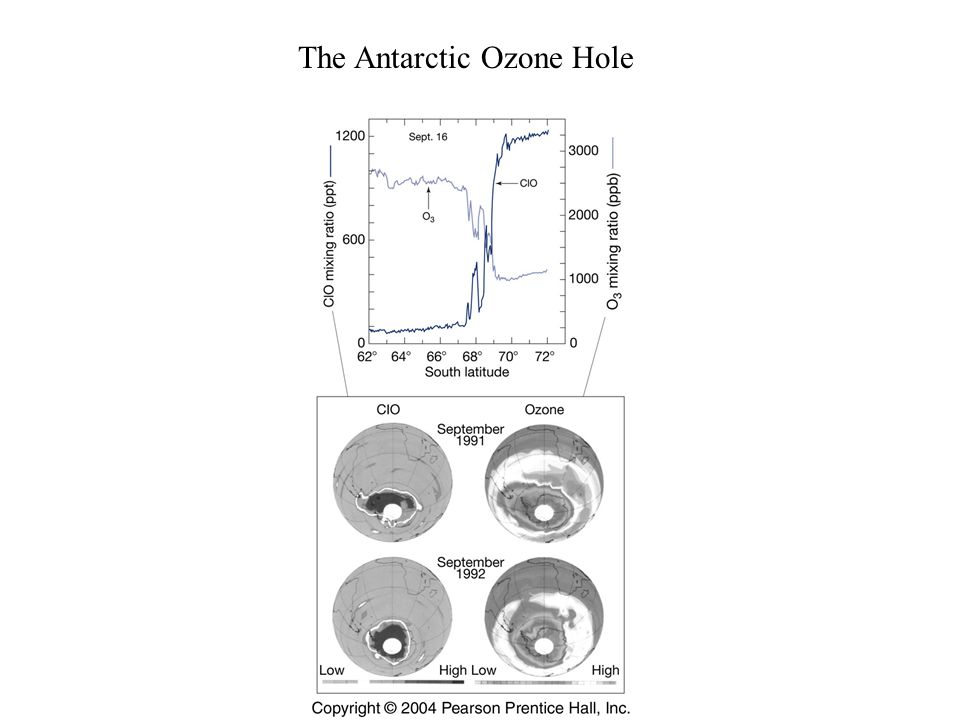
2. STRATOSPHERIC OZONE DEPLETION stratospheric vs tropospheric ozone The ozone hole: How was it discovered, how was it “solved” (not in text) Ozone depletions in other regions
 Ozone depletions in other regions.")
12
The Antarctic Ozone Hole

14
3. DEFORESTATION AND LOSS OF BIODIVERSITY e.g. Europe, New England, and now tropical forests Always changes the landscape, often reduces the complexity (e.g. forest to crops) in terms of flora and fauna Global tropical forest coverage less than half the area estimated for prehistoric times.
 in terms of flora and fauna Global tropical forest coverage less than half the area estimated for prehistoric times..")
15
1.Global Warming 2.Stratospheric Ozone Depletion 3.Deforestation and Loss of Biodiversity HOW ARE THESE DIFFERENT PROBLEMS RELATED? HOW ARE EACH OF THESE AN EXAMPLE OF “DYNAMIC EQUILIBRIUM” ?

16
IV. GLOBAL CHANGE ON LONG TIME SCALES Long = thousands of years or more Geologic Time Scale: eon, era, period, epoch Three examples of long term changes: 1. GLACIAL CYCLES: The Vostok Ice core data 2. MASS EXTINCTIONS: Iridium at the K-T boundary 3. CHANGES IN SOLAR LUMINOSITY: the “faint young sun paradox”

17
1.GEOLOGIC TIME SCALE Eon: 10 8 -10 10 yrs Era : 10 7 -10 8 yrs Period : 10 6 -10 7 yrs Epoch : 10 4 -10 6 yrs

18
GEOLOGIC TIME SCALE K-T Boundary Glacial Cycles

19
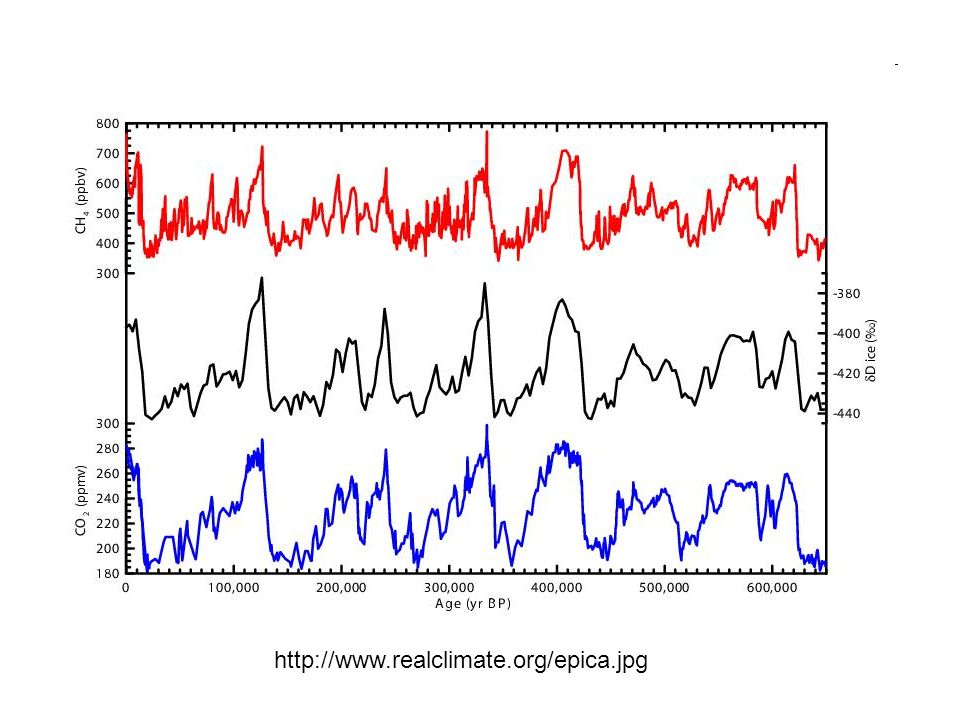
1. GLACIAL CYCLES: THE VOSTOK ICE-CORE DATA C02, CH4, and temperature time series for the last 400,000 years How are they derived: isotope analysis (O and H) These co-varying changes are interpreted as evidence of system-like behavior
 These co-varying changes are interpreted as evidence of system-like behavior.")
20
http://www.realclimate.org/epica.jpg
21
2. MASS EXTINCTIONS: IRIDIUM AT THE K-T BOUNDARY Extinction of dinosaurs, many other marine and terrestrial species (both animal and plant) Iridium: deposited at a very slow, but known, rate from extraterrestrial sources. The iridium concentrations in the layer at the K-T boundary were so high that it could not have been deposited by normal deposition. So, it must have been a very massive, sudden extraterrestrial source. Example of a “shock” to the earth system. The climate, biosphere, recovered, but at different rates. Biosphere “recovery” was very different from prior biosphere. Relevance to anthropogenic changes in biodiversity today
 Iridium: deposited at a very slow, but known, rate from extraterrestrial sources. The iridium concentrations in the layer at the K-T boundary were so high that it could not have been deposited by normal deposition. So, it must have been a very massive, sudden extraterrestrial source. Example of a shock to the earth system. The climate, biosphere, recovered, but at different rates. Biosphere recovery was very different from prior biosphere. Relevance to anthropogenic changes in biodiversity today.")
22
IRIDIUM AT THE K-T BOUNDARY

23
3. CHANGES IN SOLAR LUMINOSITY Solar physicists tell us that the amount of energy emitted by the sun was ~30% less 4.6 billion years ago when the sun formed The “faint young sun paradox”: why wasn’t the earth frozen over when the solar luminosity was so low?

24
3. CHANGES IN SOLAR LUMINOSITY (cont’d) The Gaia Hypothesis: Lovelock and Margulis. Believe that the biosphere, responding to climatic changes, have affected the earth system in such a way as to help maintain a relatively stable climate. Not a conscience action; not resilient to all possible changes Also possible that abiotic factors in the earth system played a role, not necessarily the biosphere.

Similar presentations


>")

 Your Organization (Line #2) Global warming.: Matthieu BERCHER, Master M.I.G.S., University of Burgundy,>")


 Dissolved CO2 in aquatic.>")


