Download presentation
Presentation is loading. Please wait.

1
Forest Growth and Fire Fuel Predictions for Air Quality Modeling Limei Ran, Uma Shankar, Aijun Xiu, B.H. Baek, Zac Adelman Institute for the Environment, UNC Don McKenzie Pacific Wildland Fire Sciences Laboratory, USDA FS Steve McNulty, Jennifer Moore Myers Southern Global Change Program, USDA FS

2
Outline of the Presentation Background of the Study. PnET-II Forest Growth Model (2000-2050) Base Year and Future Year Fuel Estimation and BlueSky/SMOKE Modeling Fire Scenario Builder and Biogenic Emission Estimation Issues with PnET II Model and Fuel Estimation Acknowledgements
 Base Year and Future Year Fuel Estimation and BlueSky/SMOKE Modeling Fire Scenario Builder and Biogenic Emission Estimation Issues with PnET II Model and Fuel Estimation Acknowledgements.")
3
Background of the study Part of research under project -- Integrated Modeling of Forest Growth, Fire Emissions, and Air Quality in Future Climate (EPA STAR) Purpose of the project is to: –Study the effects of climate change on forest growth and fire frequency and intensity –Investigate methods to model fire and biogenic emissions from future forest. –Examine impact of climate change from wild fire on U.S. air quality

4
Integrated Modeling System PnET-II CCSM METCHEM (MM5-MCPL / MAQSIP MAQSIP) BlueSky/EPM MEGAN SMOKE Monthly met. Base & future year fuel data Fire Scenario Builder Hourlymet Fire activity data Anthropogenic inventoried emissions Gridded & Speciated Emissions Initial & boundarymet. FCCSFIA

5
PnET-II Forest Growth Model Use PnET-II model within the PEcon Model developed at SGCP. PEcon is a coupled modeling system with: – PnET model and SRTS (Sub-regional Timber Supply Model ) PnET model developed to predict forest productivity based on climate, site information, and vegetation parameters. SGCP provided the model and data bases to run the model in SE 11 states from 1990-2198
 PnET model developed to predict forest productivity based on climate, site information, and vegetation parameters. SGCP provided the model and data bases to run the model in SE 11 states from")
6
ClimateSpatial FIA FIA Plot PnET-II PnET-CN Volume 1 Volume 2 Volume 3 Inventory and Harvest SRTS Update Acres Calculate Acres Harvested Allocate Harvest Calculate Growth Update Inventory Update Equilibrium Flow Chart of PEcon Vegetation parameters

7
Model Modifications and Input Data Preparation Modified PEcon codes to fit our project Created new input data in SE 13 states at county-level –New site data (WHC, DEM, lat-long, land area) –Monthly met data (9 parameters) from CCSM (2000-2050) and NARR (2000-2006) historic data –Spatial table to relate counties to CCSM and NARR grids Computed yearly biomass from plot/species to county/species groups from 2000 FIA biomass and PnET output. For the presentation, used PnET output from SGCP database due to extreme temp. problem in CCSM

10
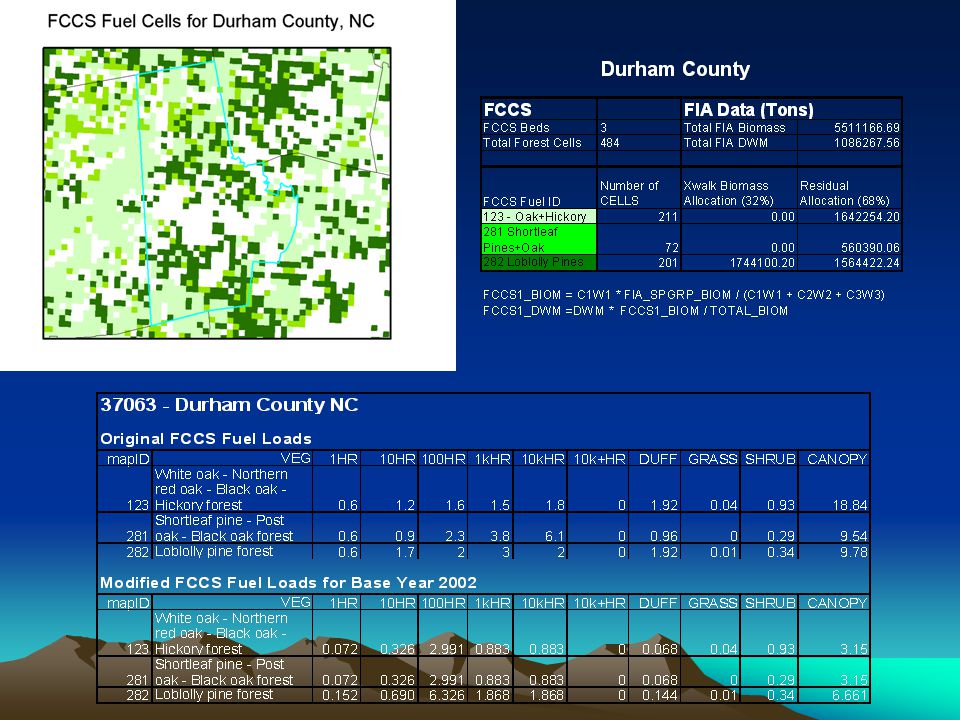
Fuel Load Estimation and BlueSky/SMOKE Modeling BlueSky takes three input files to model fire emission 1.1-km grids with FCCS fuelbed IDs (114 unique IDs) 2.Fuel load lookup table (DWM, grass, shrub, and canopy) 3.Fire information data (location and area burned) Created FIA species group to FCCS fuel bed cross walking table to consistently revise FCCS DWM and canopy Created a Perl program to revise fuel loads based on: –1. DWM_Biomass 2. FCCS fuel cell with FIPS –3. FCCS fuel table4. FIA2FCCS table Base Year 2002 BlueSky/SMOKE run: –2002 FIA DWM and biomass obtained from FS SRS at Knoxville –VISTAS fire information

11
54 FCCS Fuelbeds in SE 0Urban - agriculture - barren 27Ponderosa pine - Two-needle pine - Juniper forest 30Turbinella oak - Ceanothus - Mountain mahogany shrubland 43Arizona white oak - Silverleaf oak - Emory oak woodland 49Creosote bush shrubland 55Western juniper / Sagebrush savanna 56Sagebrush shrubland 57Wheatgrass - Cheatgrass grassland 66Bluebunch wheatgrass - Bluegrass grassland 90White oak - Northern red oak forest 107Pitch pine / Scrub oak forest 109Eastern white pine - Northern red oak - Red maple forest 110American beech - Yellow birch - Sugar maple forest 114Virginia pine - Pitch pine - Shortleaf pine forest 123White oak - Northern red oak - Black oak - Hickory forest 131Bluestem - Indian grass - Switchgrass grassland 133Tall fescue - Foxtail - Purple bluestem grassland 135Eastern redcedar - Oak / Bluestem savanna 154Bur oak savanna 157Loblolly pine - Shortleaf pine - Mixed hardwoods forest 164Sand pine forest 165Longleaf pine / Three-awned grass - Pitcher plant grassland 166Longleaf pine / Three-awned grass - Pitcher plant savanna 168Little gallberry - Fetterbush shrubland 173Live oak / Sea oats savanna 174Live oak - Sabal palm forest 175Smooth cordgrass - Black needlerush grassland 180Red maple - Oak - Hickory - Sweetgum forest 181Pond pine forest 182Longleaf pine - Slash pine / Saw palmetto - Gallberry forest 184Longleaf pine / Turkey oak forest 186Turkey oak - Bluejack oak forest 187Longleaf pine / Yaupon forest 189Sand pine - Oak forest 203Sawgrass - Muhlenbergia grassland 210Pinyon - Juniper forest 232Mesquite savanna 236Tobosa - Grama grassland 240Saw palmetto / Three-awned grass shrubland 264Post oak - Blackjack oak forest 267American beech - Yellow birch - Sugar maple - Red spruce forest 269Sugar maple - Yellow poplar - American beech - Oak forest 270Red spruce - Fraser fir / Rhododendron forest 272Red mangrove - Black mangrove forest 274American beech - Sugar maple forest 275Chestnut oak - White oak - Red oak forest 276Oak - Pine - Magnolia forest 280Bluestem - Gulf cordgrass grassland 281Shortleaf pine - Post oak - Black oak forest 282Loblolly pine forest 283Willow oak - Laurel oak - Water oak forest 284Green ash - American elm - Silver maple - Cottonwood forest 288Bald-cypress - Water tupelo forest 289Pond-cypress / Muhlenbergia - Sawgrass savanna

12
29 FIA Species Groups to FCCS Fuelbeds

14
PEC Emission from Revised and Original FCCS Fuel Loads Original FCCS Revised FCCS

15
Future Year Fuel Load Estimation Preliminary statistical analysis to build predictive models (in SAS E. Miner) for DWM from biomass and related data did not show good results. DWM variability is more associated with stand disturbances and climate than directly with biomass. Use base year DWM data Update canopy fuels as a fixed proportion of total simulated biomass
 for DWM from biomass and related data did not show good results. DWM variability is more associated with stand disturbances and climate than directly with biomass. Use base year DWM data Update canopy fuels as a fixed proportion of total simulated biomass.")
16
Fire Scenario Builder and Biogenic Emission Estimation Fire Prediction Dr. McKenzie will provide us base and future fire information from FSB in Western US for better boundary conditions. Working on creating input data sets to run FSB in eastern US (including human-caused ignitions with FS SRS in RTP). Biogenic Emission Will Use MEGAN to generate biogenic emissions. MEGAN takes gridded monthly LAI, climate data, plant function type and emission factor files. Compute LAI for species group at county level from PnET. Update MEGAN LAI grid file by allocating county-level LAI of species groups with matching MEGAN plant function types. Update monthly met data using CCSM.
. Biogenic Emission Will Use MEGAN to generate biogenic emissions. MEGAN takes gridded monthly LAI, climate data, plant function type and emission factor files. Compute LAI for species group at county level from PnET. Update MEGAN LAI grid file by allocating county-level LAI of species groups with matching MEGAN plant function types. Update monthly met data using CCSM..")
17
Issues with PnET II Model PnET does not model spatial changes in vegetation species Constant expansion factor for species biomass from plot to county Assumed that mortality and removal rates remain the same Used 10% of biomass for canopy fuel for all forest types. CCSM: extreme monthly min and max temperature during summer months.

18
Issues with Fuel Estimation Potential biases in crosswalk from FIA to FCCS FCCS fuelbeds have default values with no spatial variability across landscapes and it is difficult to verify current FCCS fuels Impossible to verify future prediction Assume all other emissions remain the same Despite many uncertainties, we can still predict changing fire and biogenic emissions from changing canopies. It does provide new ways of integrating forest growth and fuel changes for future air quality modeling. Nevertheless...

19
Acknowledgments We gratefully acknowledge the support of the USDA Forest Service Southern Research Station at Knoxville, TN. We thank Jeffery Turner, Samuel Lambert, and Sonja N. Oswalt for processing FIA P2 and P3 data in southeast US for us and advising us how to use the data properly. The work benefited a lot from the SQL support provided by Darin Del Vecchio on processing current and future biomass data into counties. This project is fully funded by US EPA under the STAR Grant RD 83227701.

20
Ignition Avail Fire Scenario Builder Flammability Fire frequency & fuel maps Management RxFire/suppression MM5 (mesoscale model) Atmospheric Instability - CAPE Map Types -500mb -700mb Fire Generator Fire Starts Fire Sizes Equations predict fuel moisture in fuel size classes that carry fire. NFDRS Human ignitions (East)
.")
Similar presentations


>")


