Download presentation
Presentation is loading. Please wait.

1
Fire Modeling issues: fire effects on regional air quality under a changing climate Douglas G. Fox dgfox@comcast.com

2
Fire activity Wildfire wildland fire use prescribed fire agricultural burning agricultural burning Climate Climate change Climate variability Fire: Climate: Air Quality Land cover & land use natural landscapes managed forests rangelands agricultural lands Air Quality Climate influences Health Particulates NAAQS Climate influences Health Particulates NAAQS SOA Visibility Radiation balance SOA Visibility Radiation balance

3
Overview of predicting future fire: modeling issues 1. Simulating fire emissions. 2. Predicting fire potential: a.“Critical” weather/climate conditions; b. Fuels: Amount (vegetation growth & change); Amount (vegetation growth & change); Management activity influences; Management activity influences; Moisture content. Moisture content. 3. Simulating fire activity: – Ignition, Intensity & Duration.
; Amount (vegetation growth & change); Management activity influences; Management activity influences; Moisture content. Moisture content. 3. Simulating fire activity: – Ignition, Intensity & Duration..")
4
BlueSky-EM Future Vegetation & fuels FireSimulator Future fire potential/ activity data Modified biogenic land use data Fire Simulation & Linkages PnET Met inputs Biogenic Emissions Fire emissions SMOKE BEIS 3 1 2a 2b 3

5
Overview of fire modeling issues Fire Emissions Fire Emissions – Models to calculate fire emissions; Different characterizations of fuels; Different characterizations of fuels; Different characterizations of consumption; Different characterizations of consumption; – Input uncertainties: Fire occurrence data; Fire occurrence data; Fire size & location uncertainties. Fire size & location uncertainties. – Limited measured emission factors: Few/no measurements of aerosol components: Few/no measurements of aerosol components: – OC, EC, PMC – SOA precursors

6
Overview of fire modeling issues Fire Emissions i = A x B x CE x e i Fire Emissions i = A x B x CE x e i – Emissions i is the emission of chemical species i (in mass units); – A is the area burned; – B is the fuel loading (biomass per area); – CE is the combustion efficiency, or fraction of biomass fuel burned, and; – e i is an emission factor for species i (mass of species per mass of biomass burned)
; – A is the area burned; – B is the fuel loading (biomass per area); – CE is the combustion efficiency, or fraction of biomass fuel burned, and; – e i is an emission factor for species i (mass of species per mass of biomass burned)")
7
Overview of fire modeling issues BlueSky Fire emissions model: BlueSky Fire emissions model: – Fuel Loading: National Fire Danger Rating System (NFDR): National Fire Danger Rating System (NFDR): – Fuel models (~ 20, mixes of size classes, loadings/size class); – Not representative of heavier fuel loadings; – National satellite derived coverage. Fuel Characteristic Classification System Fuel Characteristic Classification System – More detailed; – Three dimensional, ~ 100 – Don McKenzie will discuss.

8
NFDRS and FCCS Fuel Maps

9
Overview of fire modeling issues BlueSky Fire emissions model: BlueSky Fire emissions model: – Fuel Consumption: EPM/CONSUME v.1.02 predicts fuel consumption as f (time) & emissions: EPM/CONSUME v.1.02 predicts fuel consumption as f (time) & emissions: – Estimates CO, CH 4 and PM10 directly Fire Emission Production Simulator (FEPS): Fire Emission Production Simulator (FEPS): – Allows 6 fuel moisture values (v dry, dry, moderate, moist, wet, v wet); – Allows flaming, smoldering & long smoldering (>2 hrs) emissions; – Estimates CO, CH 4 and PM2.5 directly. – Emission Factors: Additional species calculated from empirical relationships as a f (CO/CO 2 ). Additional species calculated from empirical relationships as a f (CO/CO 2 ). – Don McKenzie will discuss.
. Additional species calculated from empirical relationships as a f (CO/CO 2 ). – Don McKenzie will discuss..")
10
Fire Emission Factors CO21833*CE CO 961 - (984*CE) CH4 42.7 – (43.2*CE) PM2.5 67.4 – (66.8*CE) PM101.18*PM2.5 EC0.072*PM2.5 OC0.54*PM2.5 NOx16.8*MCE-13.1 NH40.012*CE VOC0.085*CO Emissions in g/kg CE = DCO 2 / {DCO+DCO 2 + DCH 4 +D other } MCE = 0.15+.86*CE D= [.] plume – [.]
![Fire Emission Factors CO21833*CE CO (984*CE) CH – (43.2*CE) PM – (66.8*CE) PM101.18*PM2.5 EC0.072*PM2.5 OC0.54*PM2.5 NOx16.8*MCE-13.1 NH40.012*CE VOC0.085*CO Emissions in g/kg CE = DCO 2 / {DCO+DCO 2 + DCH 4 +D other } MCE = *CE D= [.] plume – [.]](http://images.slideplayer.com/15/4757897/slides/slide_10.jpg "Fire Emission Factors CO21833*CE CO (984*CE) CH – (43.2*CE) PM – (66.8*CE) PM101.18*PM2.5 EC0.072*PM2.5 OC0.54*PM2.5 NOx16.8*MCE-13.1 NH40.012*CE VOC0.085*CO Emissions in g/kg CE = DCO 2 / {DCO+DCO 2 + DCH 4 +D other } MCE = *CE D= [.] plume – [.]")
11
By NFDR model loading & consumption for the national wildfire inventory (t/a)
")
12
From Inter RPO fire emissions inventory, Air Sciences, 2005 for WRAP By NFDR model loading & consumption for the national wildfire inventory (t/a)
")
13
Data files and documentation: http://www.airsci.com/wrap/inter-rpo/ Regional fire days, acres, consumption & emissions for the national wildfire inventory (t/a)
")
14
RPO 2002 Wildfire emissions estimate

15
Overview of fire modeling issues Predicting fire potential: Predicting fire potential: – Changes in fuels: PnET generated landscape; PnET generated landscape; Effects of management; Effects of management; Extraordinary disturbances. Extraordinary disturbances. – “Critical” fire weather scenarios: MACSIP generated regional meteorology; MACSIP generated regional meteorology; “Critical” weather /climatic events: “Critical” weather /climatic events: – Fuel moisture & drought; – Winds & storms. – Identifying fire grid cells: Spatial links - fuels & weather – fire cells Spatial links - fuels & weather – fire cells

16
Overview of fire modeling issues Simulating fire activity: Simulating fire activity: – Ignitions: Date & time of fire starts; Date & time of fire starts; Locations on the landscape; Locations on the landscape; – Intensity; – Duration; – Natural vs. anthropogenic fire: Wildfire, wildland fire use, prescribed fire Wildfire, wildland fire use, prescribed fire

17
Overview of fire modeling issues What are contemporary fire contributions to regional air quality? What are contemporary fire contributions to regional air quality? – Apportionment analysis from IMPROVE: OC/EC ratio OC/EC ratio Trajectory/emissions mass balance. Trajectory/emissions mass balance. – Regional modeling (2002) WRAP / RMC results. WRAP / RMC results.
 WRAP / RMC results. WRAP / RMC results..")
18
Fire Apportionment: OC/EC Edge analysis: OC/EC Edge analysis: – IMPROVE Data suggest: Urban ratio ~ 2-4 Urban ratio ~ 2-4 Fire (& SOA) dominated ratio ~ 9 or higher. Fire (& SOA) dominated ratio ~ 9 or higher. – Setting urban = 2.3 & fire = 9 & calculating % of fire OC – Likely to be upper bound because fire OC includes SOA. Trajectory mass balance regression (TrMB): Trajectory mass balance regression (TrMB): – Obtain fire occurrence data (location, size, time); Parameterize fire’s contribution to site OC by summing distance weighted trajectory fire grids intersections;Parameterize fire’s contribution to site OC by summing distance weighted trajectory fire grids intersections; Regress OC against the fire surrogate variable;Regress OC against the fire surrogate variable; Calculate Fire OC contribution;Calculate Fire OC contribution; Likely to be lower bound because of limited fire occurrence data & transport approximations.Likely to be lower bound because of limited fire occurrence data & transport approximations.
 dominated ratio ~ 9 or higher. – Setting urban = 2.3 & fire = 9 & calculating % of fire OC – Likely to be upper bound because fire OC includes SOA. Trajectory mass balance regression (TrMB): Trajectory mass balance regression (TrMB): – Obtain fire occurrence data (location, size, time); Parameterize fire’s contribution to site OC by summing distance weighted trajectory fire grids intersections;Parameterize fire’s contribution to site OC by summing distance weighted trajectory fire grids intersections; Regress OC against the fire surrogate variable;Regress OC against the fire surrogate variable; Calculate Fire OC contribution;Calculate Fire OC contribution; Likely to be lower bound because of limited fire occurrence data & transport approximations.Likely to be lower bound because of limited fire occurrence data & transport approximations..")
19
Maps of annual OC/EC ratios for 2000 – 2002. Maps are scaled the same in all years, black is where OC/EC is less than 2.3, red where it is greater than 9. 2000 2001 2002 OC/EC Edge analysis: OC/EC ratios

20
TrMB calculations Gridded fire occurrence data serve as surrogates for fire emissions IMPROVE data provide known receptor aerosol mass concentrations ATAD back trajectories select fires that impact IMPROVE sites Blue hatched regions indicate the area swept by four daily back trajectories arriving at Gila Cliffs National Monument on IMPROVE sampling days in August, 2000. IMPROVE sites Fire grids ATAD Trajectories

21
Fire Apportioned OC Results:Fire Apportioned OC Results: OC/EC edge analysis (all biogenics):OC/EC edge analysis (all biogenics): West ~ 0.6; East ~ 0.9West ~ 0.6; East ~ 0.9 TrMB Regression (wildfires):TrMB Regression (wildfires): West ~ 0.3; East ~ 0.4West ~ 0.3; East ~ 0.4 Current OC from IMPROVE:Current OC from IMPROVE: West ~ 1.0; East ~ 1.7West ~ 1.0; East ~ 1.7 Fire contribution to OC:Fire contribution to OC: West ~ 30-60%; East ~ 24-54%West ~ 30-60%; East ~ 24-54% Apportioning Fire’s contribution: results (ug/m 3) OCM = 1.4*OC, avg. organic ~ 70%C

22
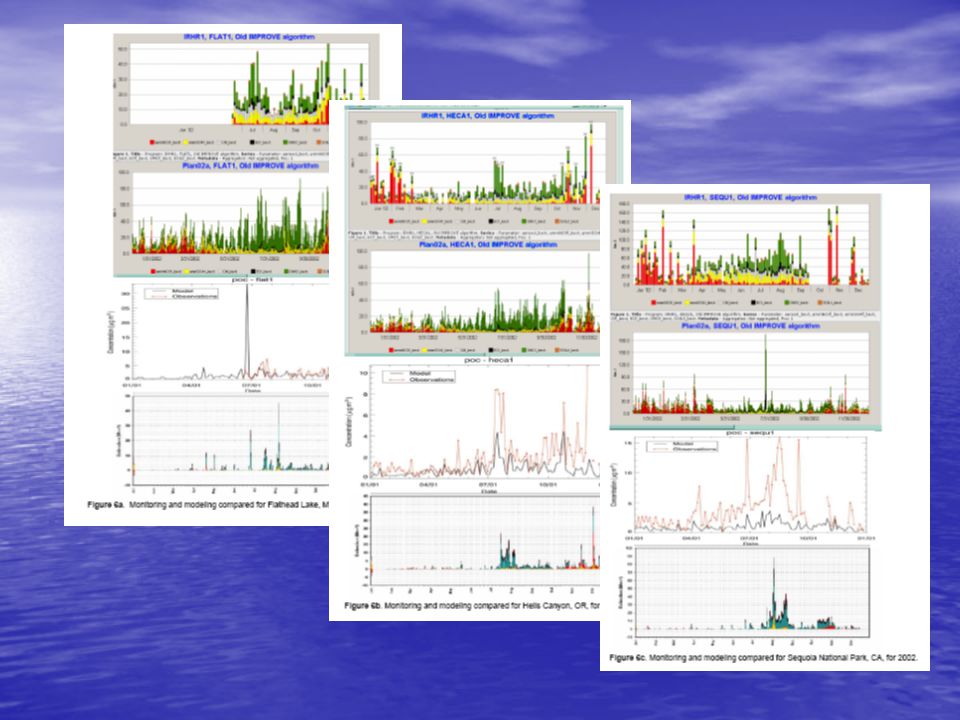
WRAP TSS results for Crater Lake NP

23
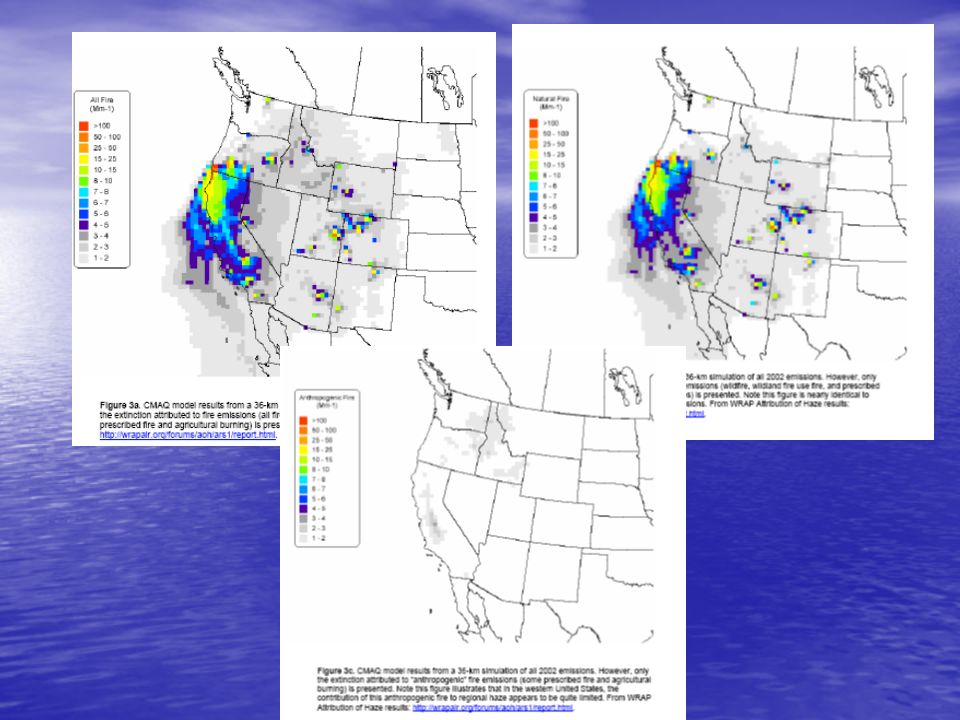
Anthropogenic fire component

26
Questions?

Similar presentations
 Russell 1 1 School.>")
 Thompson G. Pace, PE U.S. EPA Research Triangle Park, NC.>")


