Download presentation
Presentation is loading. Please wait.

1
Group Intervention Meetings

2
Partnerships Pick someone near you to be your partner. The person with the next birthday is bacon. The other person is eggs. Call back routine.

3
What comes off the plate? With your district team list all of the reasons that schools meet to discuss the academic and behavioral needs of students

4
“But I’m not a going to these meetings...” Principals – School Psychologist Teachers District Office

5
How’s your herd?

6
Strong core instruction

7
Despite our strong efforts...

8
Group Intervention meetings help decide if the cows are fed the right food

9
CONSENSUS

12
Start with the Why Why How What Simon Sinek

13
To determine which students are in need of interventions, decide what intervention best fits each student’s needs, determine the effectiveness of current interventions, and make decisions about whether to continue, discontinue, or change an intervention.

18
Painting the wall

19
Blue is core Red is ELD Yellow is intervention So What color is the outcome?

20
Be sure to coordinate your instruction to avoid curricular chaos!

22
Talk time Review the purpose of the Group Intervention Meeting. How does the team work together to avoid curricular chaos? With extra time please switch questions

24
Start with the Why Why How What Simon Sinek

25
Teaming is hard!! Having strong and effective teams is the MOST DIFFICULT thing to pull together!

26
Teaming is hard!!

27
Keep in mind... Teamwork is an Individual Skill (Avery, 2001) Every team performs to the level of its least invested member.
 Every team performs to the level of its least invested member..")
28
The least invested member...

29
Who sits at the table? Principal Literacy Specialist/Title I Counselor (if talking behavior) Grade level team May also include –S–Special Education teacher –E–ELL teacher –S–School Psychologist –T–Teacher representatives from other grade levels –P–Paraprofessionals
 Grade level team May also include –S–Special Education teacher –E–ELL teacher –S–School Psychologist –T–Teacher representatives from other grade levels –P–Paraprofessionals.")
30
Facilitator Data manager Communicator Recorder One person may have several roles Roles may change based on topic of conversation (i.e. literacy, behavior, etc) Roles
 Roles.")
31
Facilitator Data manager Communicator Recorder Calls the meeting Directs the meeting agenda Keeps track of time Roles

32
Facilitator Data manager Communicator Recorder Collects the data that is discussed at the meeting Roles

33
Facilitator Data manager Communicator Recorder Notifies team of location and time of meeting Tells people what they may need to bring Reviews norms Roles

34
Facilitator Data manager Communicator Recorder Takes notes on action items Sends notes to team members within 1 day Roles

35
Norms Why are team norms important? – Reduces Conflict & Stress within the Team. – Enables Team Members to Hold Each Other Responsible – Early Resolution of Issues – Enables Team Members to Focus On their Goals & Objectives

36
Talk time Review who should be at the table, the roles and the importance of norms. What does your team do well with the infrastructure of our meetings? What do you still need to work on? With extra time please switch questions

38
A solid agenda will...... guide your team’s decision making... keep you focused on decision rules... keep you solution focused... help to avoid storytelling

39
Agenda Each school should create an agenda that works for them Decide what you want to get done Timelines

40
Guiding Question

41
Sample Agenda

43
Talk time Why have an agenda? What do you believe is MOST important to be on an agenda? With extra time please switch questions

45
Calendar of Meetings SundayMondayTuesdayWednesdayThursdayFridaySaturday 123 K/1/2 EBIS 4 Staff Meeting 56 3/4 Data due 7 8910 3/4 EBIS 11 P.D. 1213 5 Data due 14 151617 5 EBIS 18 Staff Meeting 192021 222324 Leadership 25 P.D. 26 PBIS team 27 K/1/2 Data due 28 2930

47
Weekly PLC schedule Grade Attendance and behavior Special EdELLLiteracyRTI team k1X 2X 3X 4X 5X 6 Week 1

48
Weekly PLC schedule Grade Attendance and behavior Special EdELLLiteracyRTI team k1 2X 3X 4X 5X 6X Week 2

49
Intervention Schedule

50
Talk time How are things currently scheduled in your building/district? What barriers do you believe you will need to overcome to create the needed schedule? With extra time please switch questions

52
Tracking over time Track through the year Track year to year Track school to school Elementary to Middle to High

53
Have a way to organize Create paperwork that works for your system This is kept in your district handbook Who completes the paperwork?

54
Notifying Parents

55
Note taking

56
Tracking Attendance

57
System Check

58
Talk time Which components of a tracking and communication system do you believe are most essential? What do you believe is the next piece of the tracking and communication system that your district should work on? With extra time please switch questions

60
As a Leadership team work on your implementation plan on the topic of Group Intervention Review Meetings.

61
The “What” of Group Intervention Teaming OR Doing the Most Good for the Most Students

62
Start with the Why Why How What Simon Sinek

63
Group Intervention Data Meeting Agenda Purpose of Meeting: To determine which students are in need of interventions, decide what intervention best fits each student’s needs, determine the effectiveness of current interventions, and make decisions about whether to continue, discontinue, or change an intervention.

64
Advanced Organizer Decision making models: ATI & RTI Purposes of DBDM Three types of decisions: – Place – Change/Intensify Apply Decision Rules – Exit Changing Instruction – ICEL – Alterable Variables

65
Decision Making Models: ATI Aptitude by Treatment Interaction asks: How can we predict what treatment will work? Heavy front loading of assessment and resources Difficult to predict how a given student will respond Studies of ATI generally based on GROUPs

66
Decision Making Models: ATI Snow and Cronbach (1977) concluded that: " an understanding of cognitive abilities considered alone would not be sufficient " to explain learning, individual differences in learning, and aptitude treatment interactions. Snow (1989) summarizes Cronbach & Snow (1977) as: Many ATI combinations are complex and difficult to demonstrate clearly, and no particular ATI effect is sufficiently understood to be the basis for instructional practice. ATIs vary within individuals as a function of task and situation variables. Snow, R. (1989). Aptitude-Treatment Interaction as a framework for research on individual differences in learning. In P. Ackerman, R.J. Sternberg, & R. Glaser (ed.), Learning and Individual Differences. New York: W.H. Freeman.
 summarizes Cronbach & Snow (1977) as: Many ATI combinations are complex and difficult to demonstrate clearly, and no particular ATI effect is sufficiently understood to be the basis for instructional practice. ATIs vary within individuals as a function of task and situation variables. Snow, R. (1989). Aptitude-Treatment Interaction as a framework for research on individual differences in learning. In P. Ackerman, R.J. Sternberg, & R. Glaser (ed.), Learning and Individual Differences. New York: W.H. Freeman..")
67
Decision Making Models: RTI Response to Intervention asks: How do we know if what we are doing is working? Greater emphasis on assessing results Time and resources distributed systematically across screening, progress monitoring, and diagnostics only as needed

68
Purposes of DBDM Is what we are doing working? Instructional Design – Time – Design – Delivery System Variables – Standardization – Efficiency – Effectiveness

70
Implementation Plan Driver: Decision Support Data System Driver: Facilitative administration

71
Before doing all the work

73
Check your data....

74
Who is Placed into Intervention? Decision Rule: Based on Screener: DIBELS, easy CBM, etc – All students who are strategic or intensive OR – Lowest 20% (10%, 15%) of students Consider: Resources (time & people) Balance of CORE and INTERVENTIONS
 of students Consider: Resources (time & people) Balance of CORE and INTERVENTIONS.")
75
Example of Placement Decision Rule: TTSD Place students in the 20% group and begin weekly progress monitoring when: Academic skills fall below benchmark and place them in the lowest 20% compared to their peers on one or more of the following measures: DIBELS, IDEL, Reading curriculum based assessments, OAKS

76
Deficit: Big 5 of Reading Phonemic Awareness Phonics Fluency Vocabulary Comprehension Intervention Program from Protocol Time Design Delivery Matching Intervention to Need

77
4 Box This Slide Moved Up

78
Intervention Resources TTSD EBIS Handbook reading Protocol What Works Clearing House (http://ies.ed.gov/ncee/wwc/)http://ies.ed.gov/ncee/wwc/ National Center on Response to Intervention (http://www.rti4success.org/instructionTools) (http://www.rti4success.org/instructionTools New Slide

79
DIBELS 4 th Grade

80
easyCBM 3 rd Grade

81
Talk Time With your Team: 1.Using the DIBELS data or the easyCBM data 2.Decide what you would do with each of the circled students; i.e., target of intervention, additional information, etc.

82
Say “yes” to P.D.A.s

83
Classroom Data

84
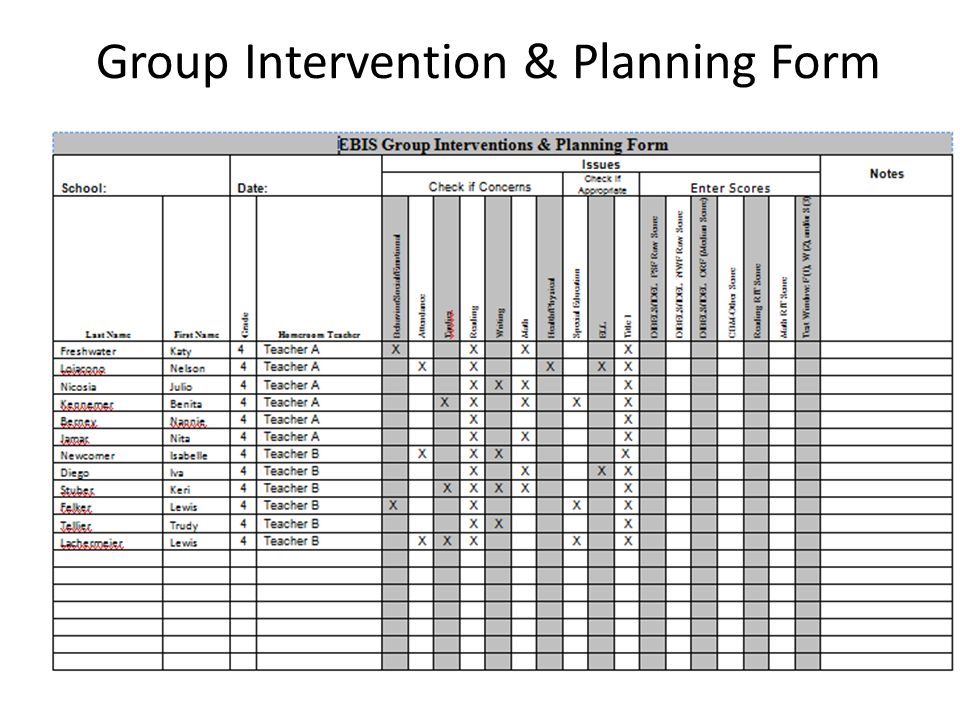
Group Intervention & Planning Form

86
Intervention Needs BenchmarkStrategicIntensive ILG 1ILG 2ILG 3ILG 4ILG 5AILG 5BILG 6AILG 6B Instructional Learning GroupsILG Benchmark FluencyStrategic FluencyIntensive Fluency ILG1= Theme Test 90% and aboveILG4=95% AccuracyILG6A=95% Accuracy ILG2= Theme Test 70%-89%ILG5A=80- 95% AccuracyILG6B=Below 95% Accuracy ILG3= Theme Test Below 70%ILG5B=Below 80% Accuracy *Check Accuracy*Check Comp. with Theme Test for Groups 4 and 5

87
Intervention Needs BenchmarkStrategicIntensive ILG 1ILG 2ILG 3ILG 4ILG 5AILG 5BILG 6AILG 6B Jerri Troiano Lilia Bodie Kenya Krider Allan Leep Kathrine Bergevin Javier Farhat Katy Freshwater Julio Nicosia Javier Carnley Kenya Capito Cody Filippone Earnestine Quandt Clayton Yule Lenore Limbaugh Nelson Loiacono Benita Kennemer Allan Pursell Selena Kam Jamie Yelvington Kelly Janik Jamie Heras Edwina Hosier Nannie Berney Sofia Thistle Javier Delorey Darryl Reider Nita Jamar Darryl SeldersSteve Berenbaum Lance Scotto Instructional Learning GroupsILG Benchmark FluencyStrategic FluencyIntensive Fluency ILG1= Theme Test 90% and aboveILG4=95% AccuracyILG6A=95% Accuracy ILG2= Theme Test 70%-89%ILG5A=80- 95% AccuracyILG6B=Below 95% Accuracy ILG3= Theme Test Below 70%ILG5B=Below 80% Accuracy *Check Accuracy*Check Comp. with Theme Test for Groups 4 and 5

88
Implementation Plan

90
Driver: Performance Assessment Driver: Decision Support Data System

91
Decision Rules Decision rules guide how we decide if our interventions are working—and when to move on Your decision rules create consistency across grade levels and schools Determine how to intensify and individualize interventions Standardizes process for eligibility decision making

92
Key features of decision rules Set the grade levels for the decision rules (K, 1-6) Number of points below the aimline Give direction if the data is highly variable – Trendline analysis Duration of intervention /frequency of monitoring (Length of time in between meetings (6 to 8 weeks) Define success
 Number of points below the aimline Give direction if the data is highly variable – Trendline analysis Duration of intervention /frequency of monitoring (Length of time in between meetings (6 to 8 weeks) Define success")
93
Example from TTSD Change interventions when: Progress monitoring indicates 4 consecutive data points below the aimline. If data are highly variable (points are above and below the aimline), maintain the current intervention until 6 data points have been collected, analyze aimline and trendline.. Change intervention if the slope is flat or decreasing and the scores are below benchmark. Each time the intervention is changed the aimline should be redrawn using the median of the three data points prior to the intervention change as the starting point for the new aimline. For ELL Students, check the progress of the cohort group after each 8-week period to determine whether an individual student’s progress is significantly different from the group.
, maintain the current intervention until 6 data points have been collected, analyze aimline and trendline.. Change intervention if the slope is flat or decreasing and the scores are below benchmark. Each time the intervention is changed the aimline should be redrawn using the median of the three data points prior to the intervention change as the starting point for the new aimline. For ELL Students, check the progress of the cohort group after each 8-week period to determine whether an individual student’s progress is significantly different from the group..")
94
Example from Roseburg (Cont.) Change and intensify interventions when: Progress monitoring indicates 4 consecutive data points below the aimline. If data are highly variable, (points above and below the aimline), maintain the current intervention until 6 data points have been collected. Analyze aimline and trendline. Change intervention if the slope is flat or decreasing and the scores are below benchmark.
, maintain the current intervention until 6 data points have been collected. Analyze aimline and trendline. Change intervention if the slope is flat or decreasing and the scores are below benchmark..")
95
Example from Roseburg Change and intensify interventions when: Each time the intervention is changed, the aimline should be re-drawn using the median of the three data points prior to the intervention change as the starting point for the new aimline. For ELL students, check the progress of the co- hort group after each 6-week period to determine whether an individual student’s progress is significantly different from the group.

96
Example from North Clackamas Progress monitoring indicates three or more data points below the aimline after 20+ instructional sessions If data is highly variable, maintain the current intervention for another month to establish a trendline Progress is monitored weekly or biweekly.

97
Work Time

98
Evaluating Interventions: Is What We Are Doing Working? AAA Apply Decision Rules: Is the student making adequate progress based on decision rules? Analyze: Is it an individual or a group problem? Action: Determine what to change

99
Apply: Is the Student Making Adequate Progress? 99 Aimline Chase

100
Analyze: Is it an Individual or a Group Problem? Cohort Group Analysis: Students who have similar literacy programming: – Grade level – Intervention program – Time – ELD level

101
101 Aimline Amy Chase Mary Isaiah Cohort Data

102
102 Aimline Amy Mary Isaiah Cohort Data Chase Driver: Performance Assessment

103
Action: Determine What to Change Listen to the data Gather additional data if necessary Focus on instructional variables that you can control!

104
What do we change? Time Group Size Different Program Individual Problem- Solving Time/ Engagement

105
Additional Diagnostic Assessment Phonics Screener Core Program Assessment Intervention Placement Test DRA QRI

106
Quick Phonics Screener

107
Changing Instruction GOING D E E P E R

108
ICEL Instruction Curriculum Environment Learner

109
Instruction Fidelity to program Appropriate instructional level Clarity of instruction Pace presentation of new content

110
Curriculum Instructional philosophy/approach Arrangement of the content and instruction Cultural relevancy Balance of skills vs. concepts

111
Environment Rules, routines and expectations Physical arrangement of the room, furniture, equipment, proximity to distractions, temperature, light, organization, noise

112
Learner Ability to attend or focus Special needs of learners Basic needs – sleep, food, shelter Last domain to consider when planning intervention

113
Variables Related to Student Achievement Desire to learn Strategies for learning Knowledge Skills Prior content knowledge Self-efficacy/helplessness Race Genetic potential Gender Birth Order Disposition Physical difference IQ Disability category Personal history Quality of instruction Pedagogical knowledge Content knowledge Quality of curriculum Quality of learning environment Quality of evaluation Quality and quantity of time/content Family income and resources Family housing Parent years of schooling Mobility Members of family Family values Socioeconomic status Family history Alterable Unalterable (hard to change) Within the studentExternal to the student
 Within the studentExternal to the student")
114
Alterable Variables Chart 114 http://oregonreadingfirst.uoregon.edu/downloads/Alt_Var_Chart_2.pdf Intensity Time Group Size Different program Fidelity Time/ Engagement

115
Implementation Plan

117
Should I Stay or Should I Go?

118
Example from TTSD Consider Exiting students from interventions when: The student has met the DIBELS grade level goal at the next benchmark three times consecutively. Core reading assessments and intervention assessments indicate grade-level proficiency. Student has met the benchmark goal on OAKS (for students in grades 3 to 5).
..")
119
What comes off the plate? With your district team list all of the reasons that schools meet to discuss the academic and behavioral needs of students Cross off the meetings that can serve the same needs during a well run tier 2 meeting.

120
Talk time With extra time please switch questions

121
Talk time With extra time please switch questions

Similar presentations


 & The IST Process>")


 in Primary Grades>")


>")


