Download presentation
Presentation is loading. Please wait.

1
Data Study Strategies Shawna Moran – School Improvement
Jon Potter – Oregon RTIi August 5th, 2015

2
The Problem Solving Process
1. Problem Identification How is it working? What is the problem? Improved Student Achievement 4. Plan Implementation & Evaluation 2. Problem Analysis What are we going to do about the problem? Why is the problem occurring? 3. Plan Development

3
1. Problem Identification
There is a difference between where we are and where we want to be Where we are Where we want to be

4
District/School Grade Level Where we want to be Where we are
Intervention Group Where we are Individual Student

5
1. Problem Identification
Do your teachers “trust the data? How clearly are you currently defining “problems” in your district? Do you primarily rely on the data? “I think…” “I feel like…” “I believe…” “Our data/evidence indicates…” VS.

6
2. Problem Analysis: Why is the problem happening?
Focus on “the water”- __________ E I C THE WATER ANALOGY COMES FROM OUR DEAR FRIENDS IN PASCO COUNTY FLORIDA. AMELIA HAS EMBEDDED IN HER TRAINING THE VISUAL OF CLEAR/HEALTHY WATER THAT ALLOW “FISH” TO GROW… THE BALANCES WITHIN THE WATER MUST REMAIN JUST RIGHT, FOR THE FISH TO HAVE A HEALTHY “ENVIRONMENT”… CHILDREN ARE THE SAME WAY… INSTEAD OR WORRYING ABOUT THE INDIVIDUAL “FISH” , ONE SHOULD FIRST START WITH THE “WATER” TO MAKE SURE IT IS BALANCED AND CONTAINS EVERYTHING IT SHOULD! :) IN MY OPINION, THE IOWA CORE CURRICULUM IS GOING TO HELP US CONCENTRATE ON THE WATER! :)
 IN MY OPINION, THE IOWA CORE CURRICULUM IS GOING TO HELP US CONCENTRATE ON THE WATER! :)")
7
ICEL How you teach What you teach Where you teach Who you teach
Instruction: Curriculum: Environment: Learner: How you teach What you teach When analyzing problems, we focus on the ICE Where you teach Who you teach

8
What impacts student achievement?
Effective teaching variables Effect size Other variables Formative Evaluation +0.90 Socioeconomic Status +0.57 Comprehensive interventions for students with LD +0.77 Parental Involvement +0.51 Teacher Clarity +0.75 Computer based instruction +0.37 Reciprocal Teaching +0.74 School Finances +0.23 Feedback +0.73 Family Structure +0.17 Teacher-Student Relationships +0.72 Whole Language +0.06 Direct Instruction +0.59 Retention -0.16 *Effect of computer based instruction not any higher as technology has increased *There is no research support for ATI’s. Kids benefits from instruction that uses multiple modalities Talk time – With a partner, talk about one variable that makes sense, and one variable that is a surprise. John Hattie, Visible Learning, 2009

9
District/School Grade Level Curriculum needs? Intervention Group
Curriculum & Instruction? Intervention Group Instruction & Environment? Individual Student Instruction, Environment, & Learner?

10
3. Plan Development What action steps are needed to address the problem? What can we do about the problem?

11
District/School Grade Level Supplement curriculum? Intervention Group
Train on Instructional Strategies? Intervention Group Increase explicitness & add behavior management? Individual Student Highly individualized plan including instruction, behavior plan, and additional supports?

12
4. Plan Implementation & Evaluation
Implement the plan & evaluate frequently

14
Looking at Benchmarking/Screening Data
100% Meetings

15
The Problem Solving Process
1. Problem Identification How is it working? What is the problem? Improved Student Achievement 4. Plan Implementation & Evaluation 2. Problem Analysis What are we going to do about the problem? Why is the problem occurring? 3. Plan Development

16
The water…. E Focus on “the water”- Instruction Curriculum I
Environment E I C THE WATER ANALOGY COMES FROM OUR DEAR FRIENDS IN PASCO COUNTY FLORIDA. AMELIA HAS EMBEDDED IN HER TRAINING THE VISUAL OF CLEAR/HEALTHY WATER THAT ALLOW “FISH” TO GROW… THE BALANCES WITHIN THE WATER MUST REMAIN JUST RIGHT, FOR THE FISH TO HAVE A HEALTHY “ENVIRONMENT”… CHILDREN ARE THE SAME WAY… INSTEAD OR WORRYING ABOUT THE INDIVIDUAL “FISH” , ONE SHOULD FIRST START WITH THE “WATER” TO MAKE SURE IT IS BALANCED AND CONTAINS EVERYTHING IT SHOULD! :) IN MY OPINION, THE IOWA CORE CURRICULUM IS GOING TO HELP US CONCENTRATE ON THE WATER! :)
 IN MY OPINION, THE IOWA CORE CURRICULUM IS GOING TO HELP US CONCENTRATE ON THE WATER! :)")
17
Purpose: 100% Data Meetings
Determine if the grade level is benefiting from core instruction AND Refine core instruction to better meet the needs of ALL students at the grade level. Don’t talk about individual students

18
Why do we look at whole grade level core instruction for 100% meetings?
50% 25% 85% 10% 5% vs Should we use slide 5 or 6 I like this slide better. I wasn’t sure about which picture to use. Is this a whole grade level need or a some students need?

19
General Features When: Who: What: Outcomes:
2-3 times per year (following collection of your schoolwide screening data) Who: Principal, Literacy Specialist/Title I, Grade level team Could include SPED, ELL, School Psychologist/Counselor, Paraprofessionals What: Use schoolwide screening data to answer questions about core instruction Outcomes: Identify the skills/strategies (curriculum) that need additional focus AND Develop a common plan (with a goal) for improving grade level achievement (Instruction, Curriculum, & Environment)
 Who: Principal, Literacy Specialist/Title I, Grade level team. Could include SPED, ELL, School Psychologist/Counselor, Paraprofessionals. What: Use schoolwide screening data to answer questions about core instruction. Outcomes: Identify the skills/strategies (curriculum) that need additional focus. AND. Develop a common plan (with a goal) for improving grade level achievement (Instruction, Curriculum, & Environment)")
20
Is it a most kids need or a some kids need?
1. Problem Identification: Is the grade level where we want them to be? 15% 25% 60% 5% 15% At least 80% -20% difference Is it a most kids need or a some kids need? Not sure how to fit the questions…. How do we answer this question for 100% meetings on this slide? Where we are Where we want to be

21
2. Problem Analysis: Focus on the ICE
Instruction: Curriculum: Environment: Learner: How you teach What you teach Where you teach Who you teach

22
Vocabulary What skills are your students currently lacking?
Reading Comprehension Reading Comprehension Vocabulary Foundational Skills Fluency (Accuracy, Prosody & Rate) Phonics and Word Recognition If we can fill in the gaps, we can decrease the gap between our current performance and our expected or hoped for performance Phonemic Awareness Print Concepts
 Phonics and Word. Recognition. If we can fill in the gaps, we can decrease the gap between our current performance and our expected or hoped for performance. Phonemic Awareness. Print Concepts.")
23
3. Plan Development: Focus on the ICE
Instruction: Curriculum: Environment: Learner: How you teach What you teach Where you teach Who you teach

24
Instruction

25
Importance of Active Engagement How we keep students involved
How many times it takes to learn something new Above Average Learner Average Truly disabled student Jo Robinson (2008) 4-14 times times times How we keep students involved Oral Responses Written Responses Action Responses
 4-14 times times times. How we keep students involved. Oral Responses. Written Responses. Action Responses.")
26
Common Environmental Supports

27
4: Plan Implementation & Evaluation
At the next benchmarking we ask… Did we improve?

28
Was our plan implemented?
How do we ensure that we implement our plan? Make it public Revisit the agreements at regular PLC/PLT times Principal Walkthroughs

29
4: Plan Evaluation Next Benchmarking Period
34% 17% 49% 12% 18% 70% Where we were Where we are now

30
Progress Monitoring: What information does it give you?
The ultimate goal is not for student’s to be successful inside your classroom. The ultimate goal is for them to be successful outside your classroom. progress monitoring (In-curriculum assessments) Progress Monitoring (General Outcome Measures)
 Progress Monitoring. (General Outcome Measures)")
31
What is an intervention?
Scientifically, research-based instructional intervention An intervention matched to student need that has been demonstrated through scientific research and practice to produce high learning rates for most students (NASDSE, 2008) It’s about odds Research-based programs have a high probability of success
 It’s about odds. Research-based programs have a high probability of success.")
32
Social Studies/Science
30-60 minutes of isolated intervention is necessary but not sufficient. Our most at-risk learners need the most coordinated instruction and support in generalizing skills across their day. Writing Specials ELD Core Reading Open Lunch & Recess Social Studies/Science Math 4 hours 15 min Intervention 45 min 1 hour

33
Using Progress Monitoring Data
20% or Group Intervention Review Meetings

34
What are Group Intervention Review Meetings?
Grade level teachers and specialists meet on a regular schedule (e.g., every 6-8 weeks) to use data (e.g., progress monitoring, diagnostic, classroom) and standardized decision rules to determine if interventions are working or need to be modified.
 to use data (e.g., progress monitoring, diagnostic, classroom) and standardized decision rules to determine if interventions are working or need to be modified.")
35
Why do we meet every 6 to 8 weeks?
Research-based interventions do not always work immediately. In 6-8 weeks, we do not necessarily expect that the intervention has worked, but we expect that the intervention is “working”.

36
School Psych/Counselor
Who sits at the table? Literacy “Guru”/ Title I Grade Level Teacher Grade Level Teacher Grade Level Teacher Principal SPED Teacher May also include: ELL Teacher School Psych/Counselor Parapro’s

37
How often and When do we meet?
Every 6-8 weeks, depending on… Your decision rules Your weekly schedule When: After school? Before school? During school?

38
Sample Meeting Schedule: 6 Week Cycle
Sunday Monday Tuesday Wednesday Thursday Friday Saturday Week 1 Kinder 1st Grade Data due Week 2 1st Grade Professional Development 2nd Grade Data due Week 3 2nd Grade Staff Meeting 3rd Grade Data due Week 4 3rd Grade PBIS Meeting 4th Grade Data due Week 5 4th Grade 5th Grade Data due Week 6 5th Grade Kinder Data due

39
Have an Agenda or Guiding Questions

40
Group Intervention Review process
Use Decision Rules 1. Problem Identification What’s the problem

41
Data-Based Decision Rules
Decision rules guide how we decide if what WE are doing is working Use your progress monitoring data Your decision rules create consistency across grade levels and schools Determine how to intensify and individualize interventions Decision rules won’t make the decision for you, but they will tell you when you need to make a decision

42
Key features of decision rules
Set the grade levels for the decision rules (K, 1-6) Define success Number of points below/above the aimline What if the data is highly variable Trendline analysis Balance the duration of intervention & the frequency of monitoring (Length of time in between meetings (6 to 8 weeks)
 Define success. Number of points below/above the aimline. What if the data is highly variable. Trendline analysis. Balance the duration of intervention & the frequency of monitoring (Length of time in between meetings (6 to 8 weeks)")
43
Example from North Clackamas
Modify interventions when: Progress monitoring indicates three or more data points below the aimline after 20+ instructional sessions If data is highly variable, maintain the current intervention for another month to establish a trendline Progress is monitored weekly or biweekly.

44
Exit Rules: Example from TTSD
Consider Exiting students from interventions when: The student has met the DIBELS Next grade level goal at the next benchmark three times consecutively. Core reading assessments and intervention assessments indicate grade-level proficiency. Student has met the benchmark goal on OAKS (for students in grades 3 to 5).
.")
45
Group Intervention Review process
Use Decision Rules Group or Individual problem? 1. Problem Identification What’s the problem

46
Group or Individual Problem?
1 2 3 4 D e c . S o r s F b J a n M h A p i l y u 6 5 Isaiah Mary Aimline Amy Chase

47
Group or Individual Problem?
1 2 3 4 D e c . S o r s F b J a n M h A p i l y u 6 5 Aimline Isaiah Amy Mary Chase

48
Starting with intervention groups helps to…
Increases your efficiency Can discuss more kids in less time Identify a group vs. individual problem Requires different solutions Keep the focus on what we are doing

49
Group Intervention Review process
Use Decision Rules Group or Individual problem? 1. Problem Identification What’s the problem GROUP INDIVIDUAL 2. Problem Analysis Why is the problem occurring? Check ICEL for group Start with FIDELITY 3. Plan Development What are we going to do about the problem? 4. Plan Implementation & Evaluation How it it working?

50
Why might the problem be occurring? The Group
Instruction: Curriculum: Environment: Learner: Not explicit enough? Not enough student opportunities to respond? Not enough instructional time? Not enough corrective feedback? Wrong lesson placement? Wrong focus skill? FIDELITY Jon Distracting setting? Group size too large? Behavior management needs? Other things to consider?

51
Group Intervention Review process
Use Decision Rules Group or Individual problem? 1. Problem Identification What’s the problem GROUP INDIVIDUAL 2. Problem Analysis Why is the problem occurring? Check ICEL for GROUP Start with FIDELITY Check ICEL for Individual 3. Plan Development What are we going to do about the problem? 4. Plan Implementation & Evaluation How it it working?

52
Why might the problem be occurring? The Individual
Instruction: Curriculum: Environment: Learner: Not explicit enough? Not individual student opportunities to respond? Not enough instructional time? Not enough corrective feedback? Wrong lesson placement? Wrong focus skill? More explicit curriculum? FIDELITY What additional data do you need to answer these questions? Distracting setting? Group size too large? Individual behavior plan needed? Other things to consider?

53
Group Intervention Review process
Use Decision Rules Group or Individual problem? 1. Problem Identification What’s the problem GROUP INDIVIDUAL 2. Problem Analysis Why is the problem occurring? Check ICEL for GROUP Start with FIDELITY Check ICEL for INDIVIDUAL 3. Plan Development What are we going to do about the problem? Decision Rules Make a change for the GROUP Make a change for the INDIVIDUAL 4. Plan Implementation & Evaluation How it it working?

54
What can we change? FIDELITY Instruction: Curriculum: Environment:
Learner: More instructional time Refine instructional delivery (with assistance from a reading “expert”) Change lesson # Change curriculum Add curriculum FIDELITY Jon Reduce group size Add behavior plan Other things to consider
 Change lesson # Change curriculum. Add curriculum. FIDELITY. Jon. Reduce group size. Add behavior plan. Other things to consider.")
55
Example from TTSD: What do we change?
INSTRUCTION ENVIRONMENT CURRICULUM INSTRUCTION

56
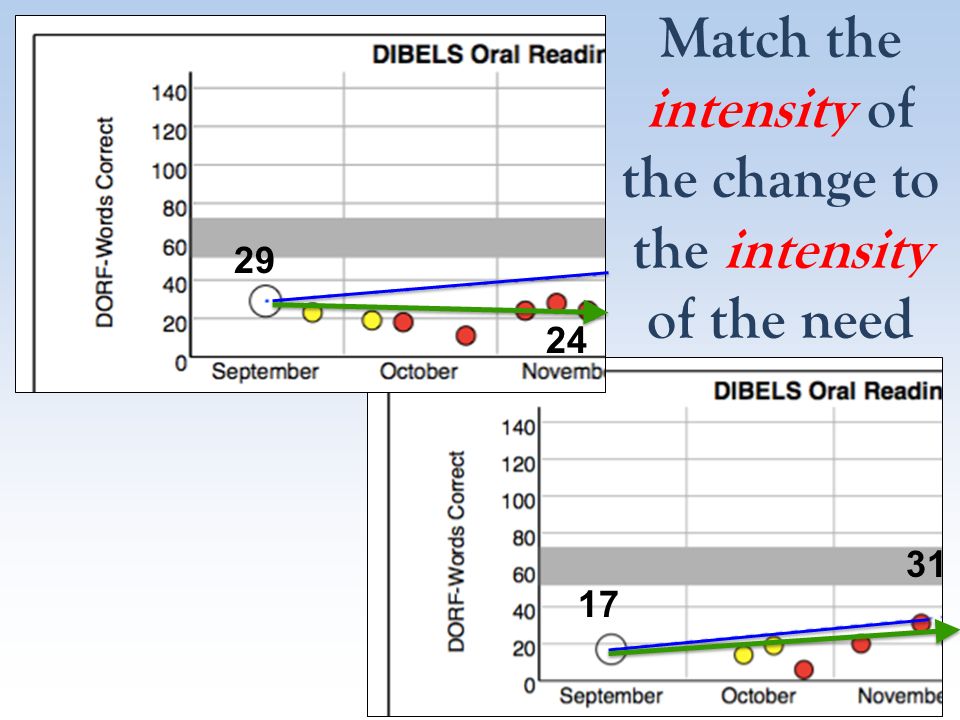
A change of intervention does not necessarily mean a change of intervention curriculum. It means a change in intensity matched to need.

57
Match the intensity of the change to the intensity of the need
29 24 31 17
58
Group Intervention Review process
Use Decision Rules Group or Individual problem? 1. Problem Identification What’s the problem GROUP INDIVIDUAL 2. Problem Analysis Why is the problem occurring? Check ICEL for GROUP Start with FIDELITY Check ICEL for INDIVIDUAL 3. Plan Development What are we going to do about the problem? Make a change for the GROUP Make a change for the INDIVIDUAL 4. Plan Implementation & Evaluation How it it working? Implement for 6-8 weeks

Similar presentations


 in Primary Grades>")


: A Schoolwide Framework for Student Success.>")

 Lindenhurst Schools>")

>")

 Presented by Ashley Adamo and Brian Mitchell January 6, 2012.>")


