Download presentation
Presentation is loading. Please wait.

1
Ch 35 Population/ Community Ecology

2
35.1 Population Density Population density is the number of individuals of a particular species per unit area or volume. Examples: 35 alligators per square km of a swamp 1,000,456 bacteria per cm2 of an agar plate 120 earthworms m2 of soil

3
Population density problems
On rare occasions you can count all the individuals in a population, such as the number of beech trees in a forest measuring 50 square kilometers (km2). Population density = Individuals = trees = 20 trees Unit area km km2 Population density is a helpful measurement for comparing populations in different locations.
. Population density = Individuals = 1000 trees = 20 trees. Unit area 50 km2 km2. Population density is a helpful measurement for comparing populations in different locations.")
4
Population Dispersion

5
35.2 There are limits to a population’s growth
Exponential growth: growth of a population that multiplies by constant factor Limiting factor:condition that restricts a population’s growth, such as space, disease and food availability. Carrying capacity: number of organisms in a population that an environment can maintain.

6
Exponential Growth Figure 35-5 This table shows how many bacteria are in a population that doubles every 20 minutes. The graph is another way to show the same data.

7
CARRYING CAPACITY Figure 35-6 Figure 35-6 Before the early 1900s, hunting kept this population of fur seals below the carrying capacity of the environment. Then, after hunting was reduced, the population grew almost exponentially for two decades. The population began to level off as it reached the carrying capacity.

8
Changes in Population Size
Growth factors (increase in pop.) Immigration: individuals moving into a population Births Shrinking factors (decrease in pop.) Emigration: individuals moving out of a population Deaths
 Immigration: individuals moving into a population. Births. Shrinking factors (decrease in pop.) Emigration: individuals moving out of a population. Deaths.")
9
Exponential Growth= J curve
Early phase of growth High availability of resources Little competition Little predation

10
Logistic Growth= S curve represent Carrying capacity
Limits on growth appear Competition for resources Predation Parasitism Illness

11
35.3 Human Population Growth
The human population is now growing at a rate of about: 3 people/second or 260 thousand/day or 1.8 million per week or 93 million/year Earth’s Carrying Capacity about 50 Billion

12
Human Population Growth
Are humans in exponential or logistic growth?

13
Competition Between Species
35.4 Interactions in Communities Competition Between Species An elephant, cannot survive without other organisms. elephant herd of elephants (population) an elephant’s community An elephant’s community = gazelles, giraffes, birds, ants, beetles, fungi, bacteria, grasses, trees Members of a population compete for limited resources in the environment. -Competition within a single species limits the growth of the population. Interspecific competition: when two or more species rely on the same limited resource (competition between 2 different species) example:during times of drought in an African savanna community, grasses may be in short supply, and competition becomes intense.
 an elephant’s community. An elephant’s community = gazelles, giraffes, birds, ants, beetles, fungi, bacteria, grasses, trees. Members of a population compete for limited resources in the environment. -Competition within a single species limits the growth of the population. Interspecific competition: when two or more species rely on the same limited resource. (competition between 2 different species) example:during times of drought in an African savanna community, grasses may be in short supply, and competition becomes intense.")
14
Competitive Exclusion
Competitive exclusion: One species succeeding over another, when the growth of both species is limited by the same resource. Figure Two similar species may each thrive in separate locations, but one may exclude the other when they are placed together. The results of an experiment with two Paramecium species demonstrate this principle of competitive exclusion.

15
NICHE Niche: a unique living arrangement of an organism defined by its living place (habitat), its food sources, the time of day it is most active, and other factors The local loss of a species is likely to occur if 2 species have niches that are very similar niches are rarely identical. Example: one lizard in a tropical forest feeds on insects in low shrubs, while a similar lizard may eat insects high in the trees.
, its food sources, the time of day it is most active, and other factors The local loss of a species is likely to occur if 2 species have niches that are very similar. niches are rarely identical. Example: one lizard in a tropical forest feeds on insects in low shrubs, while a similar lizard may eat insects high in the trees.")
17
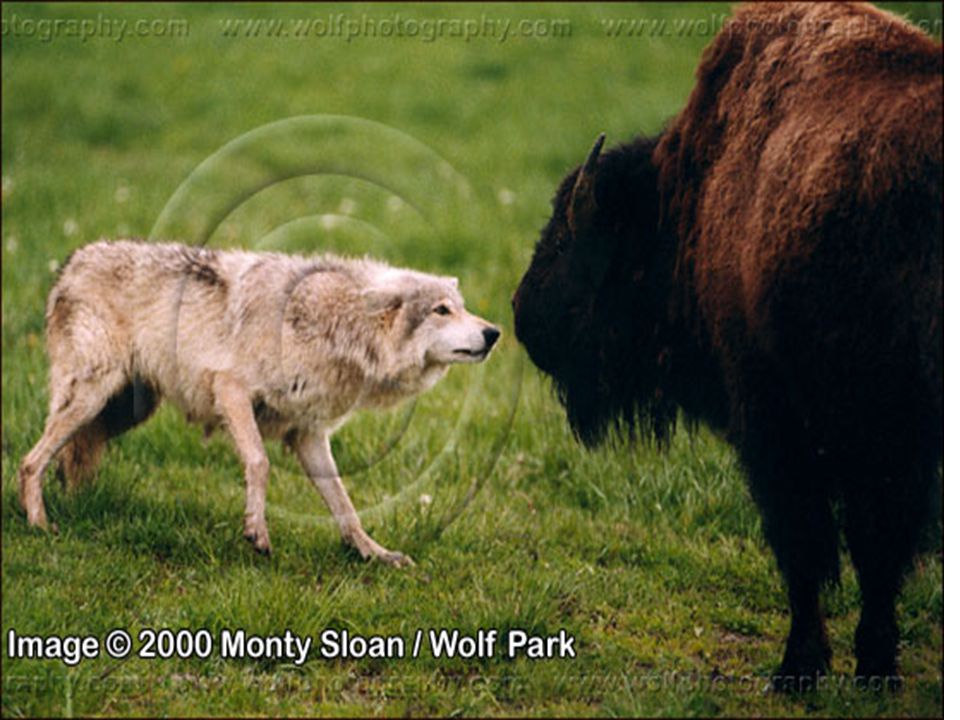
Predation Predation: an interaction in which one organism eats another. The lion attacks and eats an injured zebra or an egret catches and eats a fish. Predator: the organism that kills/ eats the prey. Prey: the organism that gets eaten. eating and avoiding being eaten are important to survival, many effective adaptations have evolved in both predators and prey.

18
Predator/ Prey

20
Predator Adaptations fast and agile camouflage
teaming up in packs acute senses claws, teeth, fangs, and stingers Ex. Rattlesnakes locate their prey with heat-sensing organs located between each eye and nostril.

21
Prey Adaptations retreat to safe locations flee from predators
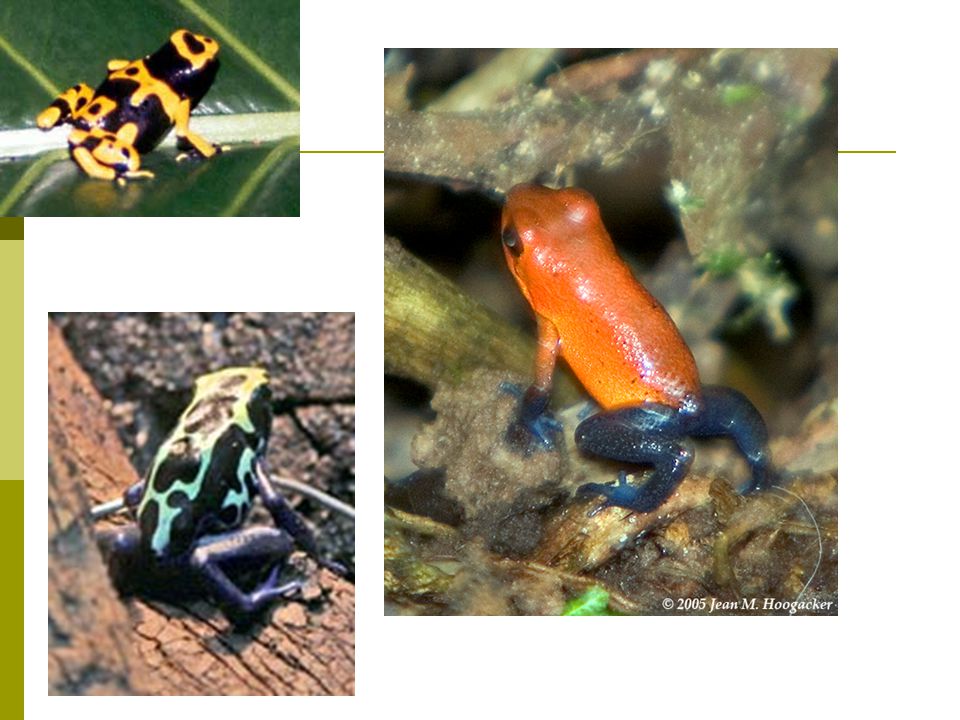
camouflage to hide "warning coloration" is a caution to predators. mimicry -look like organisms that are poisonus or dangerous. Plants have poisonous chemicals and structures such as spines and thorns.

22
Warning Coloration

24
Monarch w/ warning coloration

25
Viceroy Butterfly- mimics Monarch

26
Symbiotic Relationships
Symbiotic relationship is a close interaction between species in which one of the species lives in or on the other. 3 main types of symbiotic relationships: parasitism, mutualism, and commensalism. 1.) Parasitism is a relationship in which the parasite obtains its food at the expense of the host. Usually the parasite is smaller than the host. (blood-sucking mosquitoes and tapeworms)
 Parasitism is a relationship in which the parasite obtains its food at the expense of the host. Usually the parasite is smaller than the host. (blood-sucking mosquitoes and tapeworms)")
27
Ticks

28
Mutualism: both organisms benefit from the symbiotic relationship.
Your large intestine is inhabited by millions of bacteria. The bacteria benefit by having a warm, moist home and food. Intestinal bacteria produce vitamin K. Vitamin K is essential for blood clotting. Both you and the bacteria benefit from this relationship.

29
Mutualism Manta Ray with Remoras Pair of Coleman Shrimp on fire urchin

30
Commensalism is a relationship in which one organism benefits, while the other organism is neither harmed nor helped significantly. Example: A spider crab may place seaweed on its back. The crab benefits by being camouflaged from its predators. The seaweed is not affected. commensalism in nature is rare, since most interactions harm one species (parasitism) or help both species (mutualism) to some degree.
 or help both species (mutualism) to some degree.")
31
Commensalism

32
35.5 Disturbances are common in communities

33
Ecological Succession
Ecological succession. Series of changes in the species of a community, often followed by a disturbance. Primary Succession- process by which a community arises in a lifeless area that has no soil barren ground lichen/mosses grass shrubs pine trees hardwood trees Examples: Forest devastated by a fire, or volcano new islands created by erupting volcanoes bare rock left behind a retreating glacier.

34
Primary Succession The establishment and development of an ecosystem in an area that was previously uninhabited Lichens and mosses Grasses And small shrubs Large shrubs and small trees Large trees

35
Primary Succession

36
Surtsey: A Case Study The island of Surtsey formed by volcanic eruption off of the coast of Iceland during the period from

37
Surtsey – Post Eruption

38
Surtsey Today

39
Secondary Succession Secondary succession when a disturbance damages an existing community but leaves the soil intact Grasses shrubs trees similar to the original forest. Example: when a forested area is cleared for farming and then abandoned.

40
Secondary Succession The recovery of a damaged ecosystem in an area where the soil was left intact Fireweed Sequoia seedling

41
Case Study: Yellowstone National Park
1988 – Devastating forest fires burn much of Yellowstone National Park. Photo: National Parks Service

42
Yellowstone National Park
1988 – Park map showing areas (1.6 million acres) burned by the series of fires.
 burned by the series of fires.")
43
Yellowstone National Park
1988 fires – The immediate aftermath. Photo: National Parks Service

44
Yellowstone National Park
One year after the fires Note the appearance of fireweed Photo: National Parks Service

45
Yellowstone National Park
Ten years after the fires (1998) Photo: National Parks Service
 Photo: National Parks Service.")
46
Yellowstone National Park
Twenty years after the fires (2008)
")
47
Case Study - Chernobyl In April, 1986, a nuclear power plant in the former USSR experienced a core meltdown and a catastrophic release of radioactivity into the environment.

48
Chernobyl Surrounding towns and villages had to be immediately, permanently abandoned.

49
Chernobyl – Twenty Years Later

50
Chernobyl – Twenty Years Later
Pripyat town square.

51
Chernobyl – Twenty Years Later
Pripyat Soccer Stadium opened in 1986.

52
Chernobyl – Twenty Years Later
A local highway.

53
Secondary succession: trees are colonizing uncultivated fields and meadows

54
Human Activities and Species Diversity
humans have had the greatest impact on communities worldwide. 60 % Earth's land is used by humans, mostly as cropland or rangeland. Human disturbances have a negative effect on species diversity Clearing the Land for lumber land for farming Land for building. paved over or eventually recolonized by weeds and shrubs, as in abandoned city lots.

55
Invasive Species Courtesy

56
Invasive Species Introduced species: any organism that was brought to an ecosystem as the result of human actions Invasive species: A species that takes advantage of an unoccupied niche, or that successfully out-competes native species Kudzu: an invasive vine

57
Introduced Species Introduced species are organisms that humans move from the species' native locations to new geographic areas, either intentionally or accidentally (exotic species). Kudzu, a Japanese plant planted widely in the American South (1930s) to help control erosion. especially along irrigation canals. But kudzu soon grew out of control, taking over vast expanses of landscape. Some introduced species gain a foothold and may disrupt their new community. Some introduced species prey on native species or outcompete native species
. Kudzu, a Japanese plant planted widely in the American South (1930s) to help control erosion. especially along irrigation canals. But kudzu soon grew out of control, taking over vast expanses of landscape. Some introduced species gain a foothold and may disrupt their new community. Some introduced species prey on native species or outcompete native species.")
58
Invasive species Invasive species are "alien” species whose introduction does or is likely to cause economic or environmental harm or harm to human health"

59
U.S. Invasive Aquatic Plants
Partial list: Brazilian Waterweed Caulerpa, Mediterranean Clone Common Reed Eurasian Watermilfoil Didymo Giant Reed Giant Salvinia Hydrilla Melaleuca Purple Loosestrife Water Chestnut Water Hyacinth Water Lettuce Water Spinach Hydrilla

60
U.S. Invasive Aquatic Animals
Partial list: Alewife New Zealand Mud Snail Northern Snakehead Asian Carps Nutria Asian Swamp Eel Quagga Mussel Bullfrog Round Goby Chinese Mitten Crab Rusty Crayfish Eurasian Ruffe Sea Lamprey European Green Crab Sea Squirt Flathead Catfish Spiny Water Flea Lionfish Veined Rapa Whelk Zebra Mussel Zebra Mussel

61
U.S. Invasive Invertebrates
Partial list: Africanized Honeybee Asian Citrus Psyllid Asian Long-Horned Beetle Asian Tiger Mosquito Cactus Moth Emerald Ash Borer European Gypsy Moth European Spruce Bark Beetle Formosan Subterranean Termite Giant African Snail Glassy-Winged Sharpshooter Hemlock Woolly Adelgid Light Brown Apple Moth Mediterranean Fruit Fly Mexican Fruit Fly Pink Hibiscus Mealybug Red Imported Fire Ant Russian Wheat Aphid Silverleaf Whitefly Sirex Woodwasp Soybean Cyst Nematode

62
U.S. Invasive Vertebrates
Partial list: At Risk of Widespread Brown Tree Snake Intrusion Cane Toad Constrictor snakes European Starling Boiga snakes Wild Boar Gambian pouch rat House Sparrow Nutria European Starling Cane Toad

63
U.S. Invasive Plants Yellow Star Thistle
Autumn Olive Beach Vitex Canada Thistle Chinese Tallow Cogongrass Common Teasel Dalmatian Toadflax Diffuse Knapweed Downy Brome Garlic Mustard Giant Hogweed Hairy Whitetop Houndstongue Japanese Honeysuckle Japanese Knotweed Johnsongrass Kudzu Leafy Spurge Medusahead Mile-A-Minute Weed Multiflora Rose Musk Thistle Old World Climbing Fern Oriental Bittersweet Purple Star Thistle Quackgrass Russian Knapweed Russian Olive Saltcedar St. Johnswort Scotch Broom Scotch Thistle Spotted Knapweed Tree-of-Heaven Tropical Soda Apple Whitetop Yellow Star Thistle Yellow Toadflax Yellow Star Thistle

64
U.S. Invasive Microbes West Nile Virus Citrus Canker Animal Pathogens
Avian Influenza Exotic Newcastle Disease Fowlpox Viral Hemorrhagic Septicemia West Nile Virus Whirling Disease Plant Pathogens Citrus Canker Citrus Greening Plum Pox Southern Bacterial Wilt Soybean Rust Sudden Oak Death West Nile Virus Citrus Canker

65
Kudzu vines

67
Zebra Mussels clogging pipes
Zebra mussels clogging pipe

68
35.5 DISTURBANCES

69
Definitions Bioaccumulation: is the process by which substances not readily broken down or excreted can build up and be stored in living tissue (usually in fatty tissue.) Biomagnification: is the process by which substances become more concentrated in the bodies of consumers as one moves up the food chain (trophic levels).
 Biomagnification: is the process by which substances become more concentrated in the bodies of consumers as one moves up the food chain (trophic levels).")
70
PCBs, or polychlorinated biphenyls, are a group of man-made chemicals.
Introduced in 1929 and widely used in electrical transformers, cosmetics, varnishes, inks, carbonless copy paper, pesticides and for general weatherproofing and fire-resistant coatings to wood and plastic. The federal government banned the production of PCBs in 1976 PCBs can effect the immune system, fertility, child development and possibly increase the risk of certain cancers Case Study: PCBs

71
Case Study: DDT DDT is a pesticide that was widely used until being banned in the U.S. in 1972 DDT accumulates in living tissue, particularly in fat tissue High concentrations in some bird species caused failure of eggs by thinning the shells

72
Case Study: Methyl Mercury
What makes methylmercury so dangerous? Methylmercury is rapidly taken up but only slowly eliminated from the body by fish and other aquatic organisms, so each step up in the food chain (bio)magnifies the concentration from the step below. Bioaccumulation factors (BAF's) of up to 10 million in largemouth bass have been reported for the Everglades. Fish-eating birds, otters, alligators, raccoons and panthers can have even higher bioaccumulation factors. U.S. Department of the Interior, U.S. Geological Survey, Center for Coastal Geology This page is:
magnifies the concentration from the step below. Bioaccumulation factors (BAF s) of up to 10 million in largemouth bass have been reported for the Everglades. Fish-eating birds, otters, alligators, raccoons and panthers can have even higher bioaccumulation factors. U.S. Department of the Interior, U.S. Geological Survey, Center for Coastal Geology This page is:")
73
Mercury Health Effects

Similar presentations


 Mrs. Paul. All species interact and a change in the relationships may change a population and thus the food web. Relationships:>")


