Download presentation
Presentation is loading. Please wait.

1
Measuring what you manage The presentation is broken into three parts Part One: Why Create Metrics Part Two: How to Create Metrics Part Three: How to Analyze, Trend and Report Metrics John Parker: Data Center Operations Management - Esri

2
Part One: Why are Metrics Important “How can you manage what you can’t measure” Benchmark your goals Did you meet your goals? Creates efficiencies Cost savings Eliminate subjectivity Manageability of resources and workloads

3
Part Two: How to Create Metrics I. Understand what is important to measure II. Metrics formula - Workload + Performance = Goals or Results (see Table One) III. Know your audience
 III. Know your audience.")
4
How do I do this Stuff ! Tangible Day to day activities(workloads) Tickets Incidents, requests, changes Facilities testing and PM’s Monitoring and Alerts On call Intangible Cost savings Time savings Proactive initiatives
 Tickets Incidents, requests, changes Facilities testing and PM’s Monitoring and Alerts On call Intangible Cost savings Time savings Proactive initiatives.")
5
I. What to Measure Workload Performance( SLA’s) Goals Subjectivity to Objectivity
 Goals Subjectivity to Objectivity")
6
II. The Metrics Formula Workload + Performance = (SLA’s or Goals) Workload Metrics (what you do) Performance Metrics (how well you do it) SLA’s or Goal Metrics (Are you meeting or exceeding expectations?)
 Workload Metrics (what you do) Performance Metrics (how well you do it) SLA’s or Goal Metrics (Are you meeting or exceeding expectations ).")
7
III. Know Your Audience Customize metrics for yourself, your colleagues and your customers based on: Your requirements (what is important to you?) Their requirements (what is important to them) Toot your Whistle… It’s time to prove with numbers how well you provide services
 Their requirements (what is important to them) Toot your Whistle… It’s time to prove with numbers how well you provide services.")
8
Part Three: Analyze, Trend and Report Weekly Metrics Monthly Metrics Quarterly Metrics Annual Metrics

9
Weekly Metrics Tickets Ticket Type C/F from Last week New Created Escalations during week Total Worke d ResolvedUnresolvedWeekly Resolutio n score YTD Resolutio n Score Incidents07737471395.95% 92.34% User Requests 22412523292.00% Scheduled31401714382.35% Total51154116108893.10% Other (Not Considere d) 760136746.15% Change Type Total Changes Completed Successfully Success Rate (ROC) Comments Scheduled6583%RFC-2387, 2429, 2426, 2421, 2433, 2418 Standard66100%RFC-2435, 2437, 2436, 2432, 2440, 2438 Emergency00NA Totals 121192% 1.RFC Totals (Production)
 % Change Type Total Changes Completed Successfully Success Rate (ROC) Comments Scheduled6583%RFC-2387, 2429, 2426, 2421, 2433, 2418 Standard66100%RFC-2435, 2437, 2436, 2432, 2440, 2438 Emergency00NA Totals % 1.RFC Totals (Production)")
10
Part one –Metrics building blocks – How well you do it (Monthly) Support Weekly “workload” numbers combined Applications & Hardware Users & customers Data centers Projects Completed Performance Availability Service Level Agreements (SLA’s) Target and Stretch
 Support Weekly workload numbers combined Applications & Hardware Users & customers Data centers Projects Completed Performance Availability Service Level Agreements (SLA’s) Target and Stretch")
11
Monthly Metrics Item JulAugSepOctNovDec Hosted Applications 43 44434542 Web Applications 3029 30 29 Services 899902915 921903 Physical Servers 101106 Virtual Servers 173175 165 Cloud Instances 5067 68 71 DeliverablesJulAugSepOctNovDecAVG YTD Events & Alerts181462252725612247902162618465 21884 Incident Tickets358388331346418251 352 User Request Tickets93120127106128107 152 Response SLA (%)97.56%99.02%100.00%99.26%99.27%98.84%98.76% Average time to respond (in min) 7:012:481:092:064:021:352:59 Tickets Escalated3.55%4.72%5.46%2.09%4.31%0:81%6.06% Ticket Resolved99.07%97.64%98.54%97.22%98.63%99.60%98.05% Ticket Resolved within SLA 98.13%95.72%97.57%95.36%95.69%95.97%96.08% Basis Support Alerts1742421432573438- Basis Tickets243681- Afterhours Helpdesk Call/Tickets 225370-
97.56%99.02%100.00%99.26%99.27%98.84%98.76% Average time to respond (in min) 7:012:481:092:064:021:352:59 Tickets Escalated3.55%4.72%5.46%2.09%4.31%0:81%6.06% Ticket Resolved99.07%97.64%98.54%97.22%98.63%99.60%98.05% Ticket Resolved within SLA 98.13%95.72%97.57%95.36%95.69%95.97%96.08% Basis Support Alerts Basis Tickets Afterhours Helpdesk Call/Tickets")
12
Quarterly Metrics MonthAprMayJun Total Ticket in GOC scope526581593 Tickets Resolved520568576 Tickets Resolved within SLA519565567 Month No KBRestricted Access Out of IOG Scope (DB) Out of GOC scope (In IOG Scope) Hardware restrictions Training Gaps Apr 110628100 May 0583300 Jun 13103200 Total 2182493100
 Out of GOC scope (In IOG Scope) Hardware restrictions Training Gaps Apr May Jun Total")
13
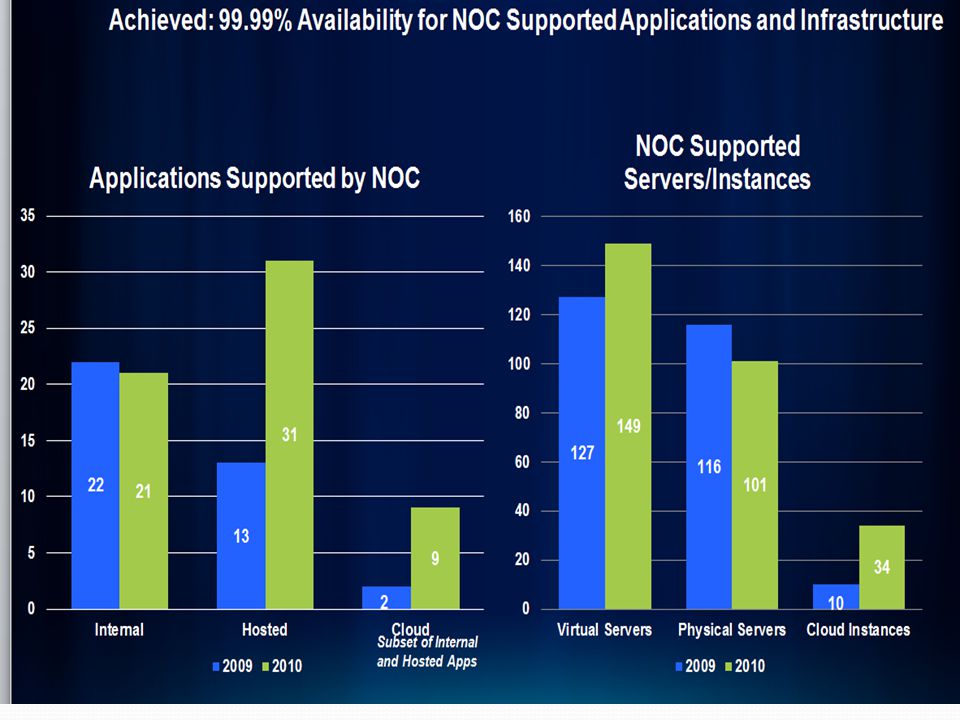
Annual Metrics Reports Summarize: Easy to read Workload Year to year comparisons Performance Goals/SLA’s

15
Summary Workload + Performance = SLA’s or Goals Weekly Metrics meetings Centralized Metrics repository Delegate tasks Automation Accuracy

16
How to use Metrics to advance your career How can metrics help you Accuracy and consistency Creates visibility for yourself and your team(s) To toot your whistle Job performance Add/promote Staff Grow teams
 To toot your whistle Job performance Add/promote Staff Grow teams")
Similar presentations

?>")


>")


