Download presentation
Presentation is loading. Please wait.

1
The Management Cycle in a Public Institution System Planning Institution System Institution Resource Allocation System Assessment Institution

2
Client Expectations—The State Expansion and Diversification of the Economy Improving Performance of K-12 Education Contributing to Solution of Problems Normally Addressed in Other Agencies of State Government Social Services Corrections Environmental Quality Labor/Commerce Etc.

3
Student Pipeline: Of 100 9 th Graders – the number who graduate from high school within four years, go directly to college, return their second year, and graduate within 150% of program time (2000) 84 58 28 38.8 67 38 26 18 26.7 78 45 33 22 25.4 42 0 20 40 60 80 100 Graduate from High School Enter CollegeEnroll Sophomore Year Graduate within 150% 25 to 44 with a Bachelor's Best Performing StateU.S. AverageWisconsin

4
Interstate Migration of Adults with a Bachelor’s Degree or Higher: Change in Stock of Adults with a Bachelor’s Degree or Higher Minus Number of Bachelor’s Degrees Awarded (1990 to 2000) – 25- to 64-Year-Olds Source: U.S. Census Bureau, IPEDS Completions Survey, Tom Mortenson, Postsecondary Opportunity 193 167 106 82 74 67 64 58 44 33 21 20 15 2 -4 -7 -8 -9 -12 -13 -14 -17 -19 -24 -27 -30 -37 -49 -50-51 -53 -57 -72 -75 -79 -80 -88 -93 -109 -120 -124 -138 -173 -281 -380 -51 -46 -10 -400 -200 0 200 Florida Georgia Colorado New Jersey Washington Arizona Nevada North Carolina Texas Virginia Oregon Maryland Idaho Alaska New Mexico Wyoming TennesseeMinnesota Hawaii Montana South Carolina DelawareArkansas South Dakota Maine Vermont New Hampshire Kentucky North Dakota Nebraska Mississippi Kansas Connecticut West Virginia Utah Illinois Rhode Island California WisconsinOklahomaAlabama Iowa LouisianaMissouriIndiana Michigan Massachusetts Ohio Pennsylvania New York (In Thousands) From 1990 to 2000, Wisconsin Produced 272,629 Bachelor’s Degrees – While the Number of Adults 25-64 with a Bachelor’s Degree or Higher Rose by 197,940
 From 1990 to 2000, Wisconsin Produced 272,629 Bachelor’s Degrees – While the Number of Adults with a Bachelor’s Degree or Higher Rose by 197,940.")
5
The Flow of Funds Economy State and Local Government Federal Government Donors Foundations Corporations Tax Revenues Appropriations/GrantsStudent Aid Tuition Scholarships & Waivers Research and Other Grants (Restricted)Student Aid (Restricted) Gifts Income K-12 Corrections Health Care Other Govt. Higher Education StudentsInstitutions

6
Change in Resident Undergraduate Student Charges and State Appropriations, Public Colleges and Universities, 1990-91 to 2001-02 Source: AASCU/NASULGC 2001 1990-911991-92 1992-931994-951995-961996-97 1997-981998-991999-20002001-012000-20012001-02 0.125 0.038 0.037 0.039 0.05 0.071

7
State Comparisons: Index Scores—Affordability *Weights within the Family Ability to Pay indicators are based on enrollment by type of institution. The zero score for Wyoming on Family Ability to Pay at Private 4-Year Colleges is weighted at zero, and as a result does not affect the state’s overall grade for affordability. **Actual Index Score is over 100. Notes: Numbers in bold refer to best-performing states. Category Grade Category Index Score At Community Colleges* At Public 4-Yr Colleges* At Private 4-Yr Colleges* Need-Based Financial Aid (20%) Low-Priced Colleges (20%) Low Student Debt (10%) Category Grade Category Index Score At Community Colleges* At Public 4-Yr Colleges* At Private 4-Yr Colleges* Need-Based Financial Aid (20%) Low-Priced Colleges (20%) Low Student Debt (10%) STATE Family Ability to Pay (50%) STATE Family Ability to Pay (50%) AlabamaF5778757414791 AlaskaD638383 100 05996 ArizonaD-627169592 97 82 ArkansasC749588 83 326796 CaliforniaA 100 68624244 293 83 ColoradoC-72888753397481 ConnecticutC-71837153 89 6478 DelawareF5475607886072 FloridaD-60717752156495 GeorgiaD6591 95 5807188 HawaiiD658472702 92 84 IdahoD+6994898117292 IllinoisB85887663 123 7087 IndianaD+69747261725193 IowaC738590705651 100 KansasC-72979278167194 KentuckyC749592803462 98 LouisianaD6397823917091 MaineF56706951374091 MarylandD-62807056395479 MassachusettsD-62787141835277 MichiganD+688368 85 456097 MinnesotaB85 100100 68 100 4997 MississippiD64857875166 102 MissouriD+67 98 8168187191 MontanaF5165676763793 NebraskaD66908070126797 NevadaD+68757661258285 New HampshireF4567615663178 New JerseyC-72746462 98 4987 New MexicoC-70837743248498 New YorkF56555942863083 North CarolinaC7589885529 100 87 North DakotaD658787 118 346 105 OhioF55686159354387 OklahomaC74 98102 71156795 OregonF53666044215485 PennsylvaniaD+67765951 102 4485 Rhode IslandF43585040184673 South CarolinaD+67916871336789 South DakotaF59838773035 100 TennesseeD-61797460196291 TexasD+67817259178991 UtahB86 103108156 37598 VermontF56594752843274 VirginiaB-81 102 857542 100 84 WashingtonC-70807757635885 West VirginiaF57636857274395 WisconsinC7694 95 65614995 WyomingD668587006698 **
 Low-Priced Colleges (20%) Low Student Debt (10%) Category Grade Category Index Score At Community Colleges* At Public 4-Yr Colleges* At Private 4-Yr Colleges* Need-Based Financial Aid (20%) Low-Priced Colleges (20%) Low Student Debt (10%) STATE Family Ability to Pay (50%) STATE Family Ability to Pay (50%) AlabamaF AlaskaD ArizonaD ArkansasC CaliforniaA ColoradoC ConnecticutC DelawareF FloridaD GeorgiaD HawaiiD IdahoD IllinoisB IndianaD IowaC KansasC KentuckyC LouisianaD MaineF MarylandD MassachusettsD MichiganD MinnesotaB MississippiD MissouriD MontanaF NebraskaD NevadaD New HampshireF New JerseyC New MexicoC New YorkF North CarolinaC North DakotaD OhioF OklahomaC OregonF PennsylvaniaD Rhode IslandF South CarolinaD South DakotaF TennesseeD TexasD UtahB VermontF VirginiaB WashingtonC West VirginiaF WisconsinC WyomingD **.")
8
Percentage Change in Spending to Maintain Current Services H.E. 8-Year Spending Growth Rate 1 2 3 4 5 6 7 8 9 10 11 12 13 14 15 16 17 18 19 20 21 22 23 24 Nevada New Jersey Virginia Connecticut Massachusetts Illinois Arizona Pennsylvania Delaware Colorado Maryland Rhode Island Michigan California North Carolina Florida New York Alaska United States Ohio New Hampshire Missouri Tennessee Indiana Wisconsin RankState Annual Avg. Advantage for Higher Ed. All Programs 1.9 1.3 0.6 0.4 0.3 0.1 -0.1 -0.2 -0.3 -0.6 -0.7 -0.9 -1.1 67.5 39.5 47.4 40.0 39.9 39.2 59.9 37.5 42.6 50.3 42.6 38.9 37.5 52.2 55.3 57.5 44.1 41.8 47.4 40.2 46.8 43.6 51.9 45.8 38.9 93.6 54.1 54.3 44.6 43.6 42.5 63.1 38.3 41.9 48.5 40.8 37.0 34.2 48.5 51.3 51.0 37.4 34.7 40.0 32.7 39.1 35.6 41.5 35.3 27.9 H.E. 8-Year Spending Growth Rate 25 26 27 28 29 30 31 32 33 34 35 36 37 38 39 40 41 42 43 44 45 46 47 48 49 50 Georgia Kentucky Texas Iowa Minnesota South Carolina Washington Kansas Oklahoma Arkansas Hawaii West Virginia Oregon Nebraska Montana Alabama Maine Utah Idaho Mississippi Vermont Louisiana North Dakota South Dakota New Mexico Wyoming RankState Annual Avg. Advantage for Higher Ed. All Programs -1.1 -1.2 -1.5 -1.4 -1.5 -1.7 -1.9 -2.0 -1.9 -2.1 -2.2 -2.0 -2.2 -2.1 -2.2 -2.9 -2.7 -3.3 -3.2 -3.0 -4.5 59.2 47.9 56.1 41.7 42.1 59.4 51.0 39.3 40.5 46.9 43.9 43.7 52.5 40.8 36.8 49.6 42.5 51.2 54.9 52.9 37.8 46.7 33.7 38.1 53.4 44.1 47.3 35.5 42.7 26.6 27.0 43.8 34.5 22.6 23.5 28.5 23.9 22.7 31.4 19.5 15.1 27.8 20.1 28.7 31.0 28.9 10.2 18.8 3.3 7.2 21.9 1.6 Source: Rockefeller Institute of Government 2002

9
State and Local Surplus or Shortfall as a Percent of Baseline Revenues in Year 2010 1 2 3 4 5 6 7 8 9 10 11 12 13 14 15 16 17 Vermont3.1 North Dakota2.2 Maine1.3 New Jersey0.6 Delaware0.2 Wisconsin0.0 Kansas-0.3 Montana-0.4 Maryland-0.5 New Hampshire-0.6 Arizona-0.7 Massachusetts-0.8 Utah-0.8 Oklahoma-1.3 Oregon-1.3 Nebraska-1.4 Ohio-1.4 RankStatePercent 18 19 20 21 22 23 24 25 26 27 28 29 30 31 32 33 South Dakota-1.7 Michigan-1.7 Rhode Island-1.9 Minnesota-1.9 Colorado-2.3 Alaska-2.4 California-2.5 Connecticut-2.9 West Virginia-2.9 Pennsylvania-2.9 Virginia-3.0 Georgia-3.2 United States-3.4 Kentucky-3.4 Arkansas-3.5 Hawaii-3.6 New Mexico-3.6 RankStatePercent 34 35 36 37 38 39 40 41 42 43 44 45 46 47 48 49 50 Iowa-3.7 New York-3.8 Illinois-4.2 Missouri-4.7 Washington-4.9 Idaho-5.0 Indiana-5.2 North Carolina-5.6 Texas-5.7 Florida-5.7 South Carolina-6.3 Wyoming-7.8 Mississippi-8.6 Louisiana-8.8 Alabama-9.2 Nevada-9.2 Tennessee-9.7 RankStatePercent Source: Rockefeller Institute of Government 2002

10
State Tax Capacity and Effort (Index Scores) - Wisconsin Source: State Higher Education Executive Officers, Kent Halstead
 - Wisconsin Source: State Higher Education Executive Officers, Kent Halstead")
11
State Appropriations for Higher Education vs. Family Share of Higher Education Funding (Index Scores) - Wisconsin Source: State Higher Education Executive Officers, Kent Halstead
 - Wisconsin Source: State Higher Education Executive Officers, Kent Halstead.")
12
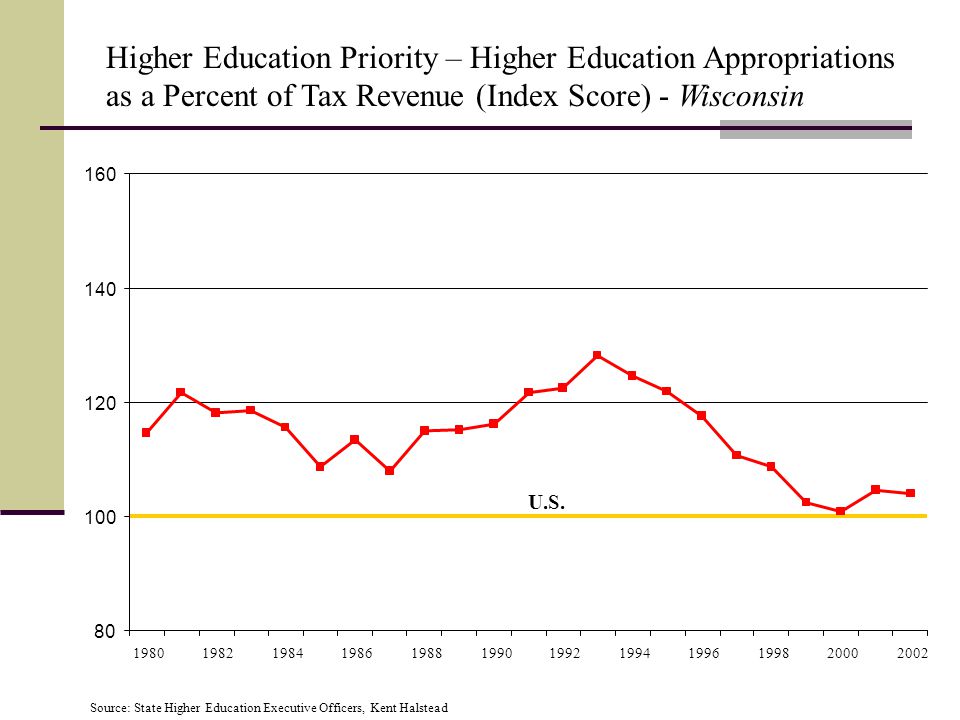
Higher Education Priority – Higher Education Appropriations as a Percent of Tax Revenue (Index Score) - Wisconsin Source: State Higher Education Executive Officers, Kent Halstead U.S. 80 100 120 140 160 198019821984198619881990199219941996199820002002
13
State Strategies Used to Reduce Budget Gaps, Fiscal Year 2002 Source: NASBO 6 11 3 26 7 10 1 22 38 4 0 10 20 30 40 Fees Layoffs Furloughs Early Retirement Cuts Reduce Local Aid Reorganize Privatization Rainy Day Fund Tuition/Fee Increases

14
Total Research and Development Expenditures Per Capita ($) - 2001 Source: National Science Foundation, US Census Bureau
 Source: National Science Foundation, US Census Bureau")
15
Federal Research and Development Expenditures Per Capita ($) – 2001 Source: National Science Foundation, US Census Bureau
 – 2001 Source: National Science Foundation, US Census Bureau")
16
State, Local, and Institutional (Internal) Research and Development Expenditures Per Capita ($) – 2001 Source: National Science Foundation, US Census Bureau
 Research and Development Expenditures Per Capita ($) – 2001 Source: National Science Foundation, US Census Bureau")
Similar presentations

 Arkansas Michigan CALIFORNIA MINNESOTA COLORADO NEVADA CONNECTICUT New Hampshire.>")


 While LIHEAP is intended to assist low-income families with their year-round home energy needs,>")


