Download presentation
Presentation is loading. Please wait.

1
Selected Data for West Virginia Higher Education J. Michael Mullen WVFAA November 6, 2003

2
Projected Population Growth

3
Projected Change in the Population 2000 to 2020 Projected Change in the Population 2000 to 2020 38.4 14.7 0.6 2.3 0 10 20 30 40% Hawaii Wyoming New Mexico California Alaska Idaho Washington Utah Texas Florida Oregon Montana Arizona Georgia Colorado Virginia Tennessee Alabama Nation Maryland New Hampshire Oklahoma North Carolina South Dakota South Carolina Kansas Nevada Arkansas Louisiana North Dakota Nebraska Vermont Minnesota New Jersey Missouri Maine Mississippi Delaware Wisconsin Indiana Connecticut Massachusetts Kentucky Illinois Rhode Island Iowa Ohio Pennsylvania West Virginia New York Michigan Source: US Census Bureau

4
Projection of 18-24 Year Olds (Traditional College Age – from 2000 to 2025) Projection of 18-24 Year Olds (Traditional College Age – from 2000 to 2025) Source: US Census Bureau 172,431 140,402 120,000 140,000 160,000 180,000 200020052010201520202025 -18.6 % Decline The Largest Decrease of all 50 States -18.6 % Decline The Largest Decrease of all 50 States
 Projection of Year Olds (Traditional College Age – from 2000 to 2025) Source: US Census Bureau 172, , , , , , % Decline The Largest Decrease of all 50 States % Decline The Largest Decrease of all 50 States")
5
Projection of High School Graduates (from 2002 to 2012) Projection of High School Graduates (from 2002 to 2012) Source:Knocking at the Door: Projections of High School Graduates, 1996-2012 Western Interstate Commission for Higher Education 18,868 17,473 16,000 17,000 18,000 19,000 20,000 2001-022003-042005-062007-082009-102011-12 -7.4 % Decline The 10 th Largest Decrease of all 50 States -7.4 % Decline The 10 th Largest Decrease of all 50 States
 Projection of High School Graduates (from 2002 to 2012) Source:Knocking at the Door: Projections of High School Graduates, Western Interstate Commission for Higher Education 18,868 17,473 16,000 17,000 18,000 19,000 20, % Decline The 10 th Largest Decrease of all 50 States -7.4 % Decline The 10 th Largest Decrease of all 50 States")
6
Source: US Census Bureau Projected West Virginia Population Growth Number Change from 2000 to 2020 – By Race -52,439 -28,968 -86,299 35,468 119,575 14 -31 -1,151 4,308 1,6061,592 835 2,258 3,101 1,872 -90,000 -60,000 -30,000 0 30,000 60,000 90,000 120,000 0 to 1718 to 2425 to 4445 to 6465 and Older WhiteBlackHispanic

7
ENROLLMENT PATTERNS

8
Educational Attainment

9
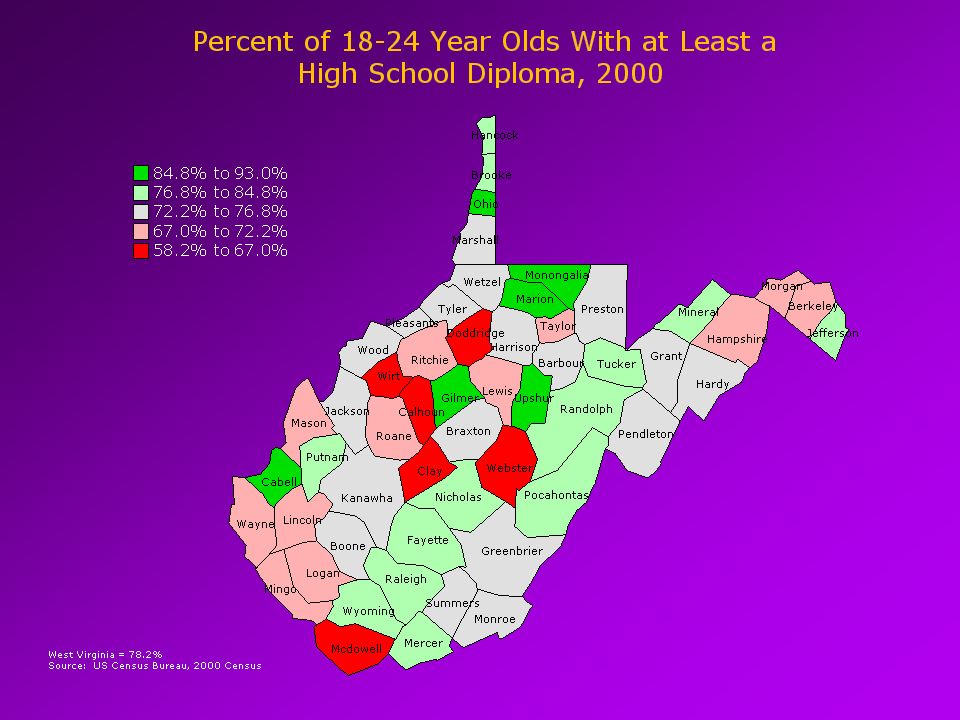
Percent of 18 to 24 Year Olds with at Least a High School Diploma - 2000 (%) 85.8 78.2 74.7 40% 90% Hawaii North Dakota Vermont Massachusetts Iowa Rhode Island Utah Nebraska Pennsylvania Maryland Virginia Minnesota Wyoming Maine Wisconsin Montana Kansas Connecticut South Dakota West Virginia New Hampshire Delaware Idaho Alaska Ohio Indiana Michigan Missouri New Jersey New York Illinois Arkansas Washington Colorado Tennessee Kentucky Oklahoma Nation South Carolina North Carolina Oregon Louisiana Alabama Florida Mississippi California New Mexico Georgia Arizona Texas Nevada 66.7 Source: US Census Bureau
 % 90% Hawaii North Dakota Vermont Massachusetts Iowa Rhode Island Utah Nebraska Pennsylvania Maryland Virginia Minnesota Wyoming Maine Wisconsin Montana Kansas Connecticut South Dakota West Virginia New Hampshire Delaware Idaho Alaska Ohio Indiana Michigan Missouri New Jersey New York Illinois Arkansas Washington Colorado Tennessee Kentucky Oklahoma Nation South Carolina North Carolina Oregon Louisiana Alabama Florida Mississippi California New Mexico Georgia Arizona Texas Nevada 66.7 Source: US Census Bureau")
10
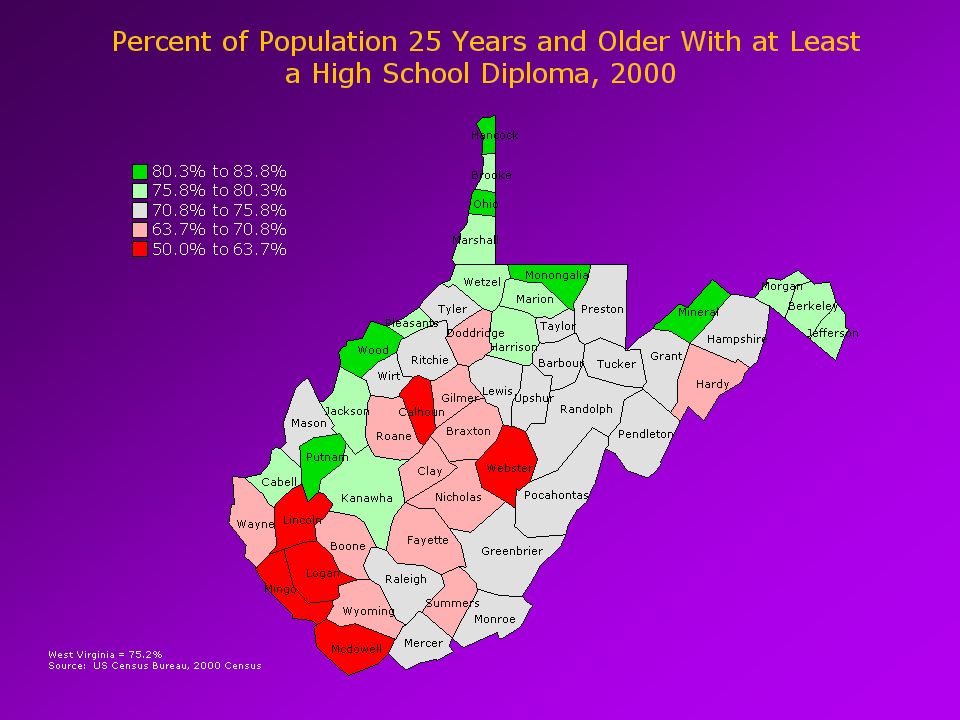
Percent of Adults 25 and Older with at Least a High School Diploma – 2000 (%) 88.3 75.2 80.4 72.9 40% 100% Alaska Wyoming Minnesota Utah New Hampshire Montana Washington Colorado Nebraska Vermont Iowa Kansas Maine Oregon Wisconsin Massachusetts Idaho Hawaii South Dakota Connecticut North Dakota Maryland Michigan Ohio Delaware Indiana New Jersey Pennsylvania Virginia Illinois Missouri Arizona Nevada Oklahoma Nation Florida New York New Mexico Georgia North Carolina Rhode Island California South Carolina Tennessee Texas Arkansas Alabama West Virginia Louisiana Kentucky Mississippi Source: US Census Bureau
 % 100% Alaska Wyoming Minnesota Utah New Hampshire Montana Washington Colorado Nebraska Vermont Iowa Kansas Maine Oregon Wisconsin Massachusetts Idaho Hawaii South Dakota Connecticut North Dakota Maryland Michigan Ohio Delaware Indiana New Jersey Pennsylvania Virginia Illinois Missouri Arizona Nevada Oklahoma Nation Florida New York New Mexico Georgia North Carolina Rhode Island California South Carolina Tennessee Texas Arkansas Alabama West Virginia Louisiana Kentucky Mississippi Source: US Census Bureau")
11
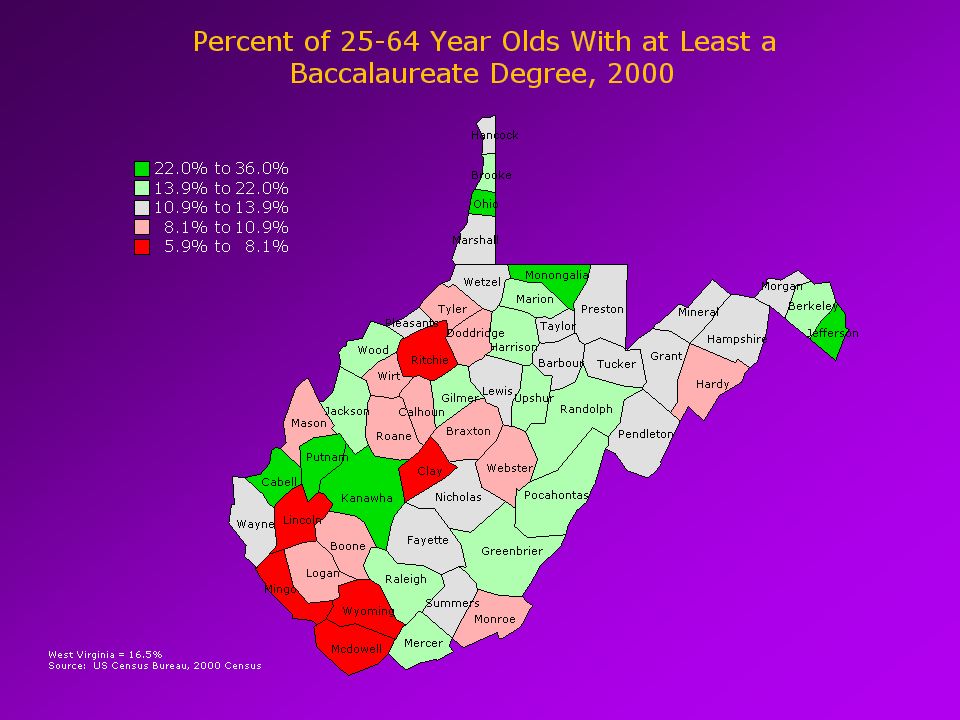
Percent of Adults 25 to 64 with a Bachelor’s Degree or Higher - 2000 37.1 26.5 16.5 0 10 20 30 40 Massachusetts Colorado Connecticut Maryland New Jersey Virginia Vermont New Hampshire Minnesota New York Washington Illinois Rhode Island Hawaii Kansas California Utah Nebraska Oregon Delaware Montana Nation Georgia North Dakota Alaska Pennsylvania Wisconsin Maine Arizona Texas New Mexico South Dakota Missouri North Carolina Iowa Florida Michigan Wyoming Idaho Ohio Oklahoma South Carolina Indiana Tennessee Alabama Louisiana Nevada Kentucky Arkansas Mississippi West Virginia Source: US Census Bureau

12
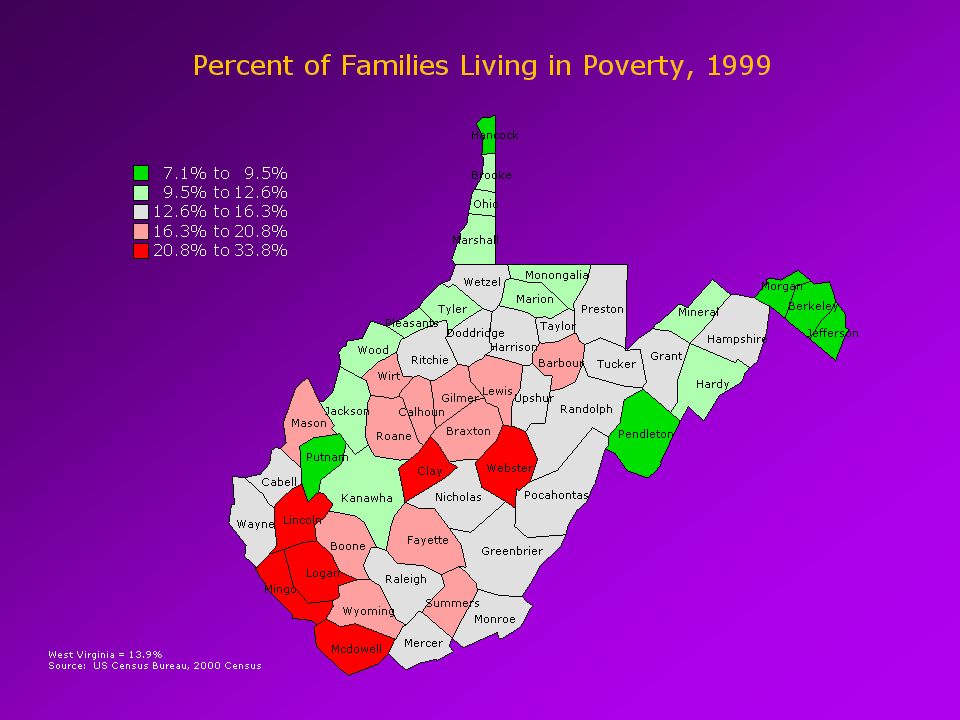
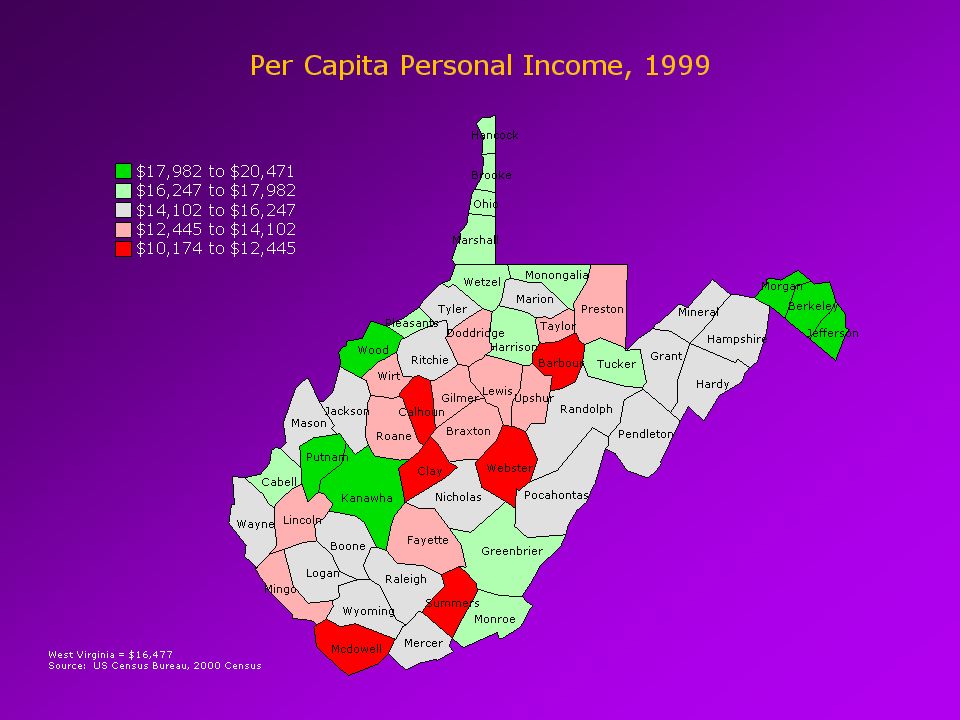
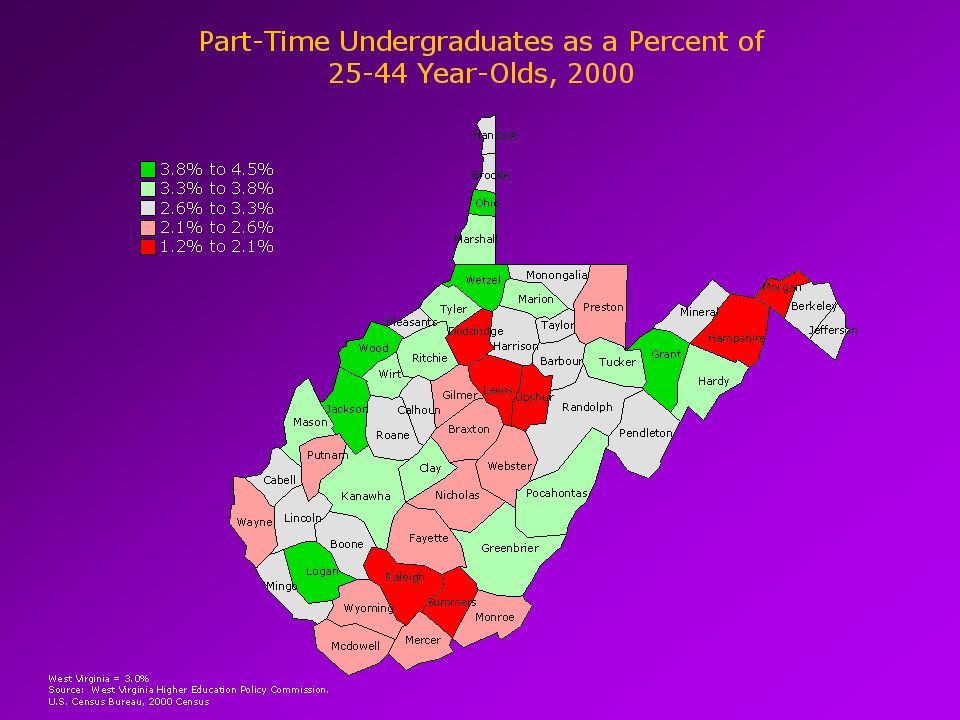
Disparities in Educational Attainment, Income, and Poverty by County

18
Transition and Completion Rates – From High School to College Completion

19
High School Graduation Rates – Public HS Graduates as a Percent of 9 th Graders Four Years Earlier (%) - 2000 Source: Tom Mortenson, Postsecondary Opportunity
 Source: Tom Mortenson, Postsecondary Opportunity")
20
Source: NCES-IPEDS, Graduation Rate Survey Graduation Rates – Percent of Bachelor’s Students Graduating within Six Years (%) - 2000
")
21
Source: NCES-IPEDS, Graduation Rate Survey Graduation Rates – Percent of Associate Students at Two-Year Colleges Graduating within Three Years (%) - 2000
")
22
Student Pipeline Of 100 9 th Graders, How Many... Of 100 9 th Graders, How Many... Student Pipeline Of 100 9 th Graders, How Many... Of 100 9 th Graders, How Many... 84 58 28 38.8 67 38 26 18 26.7 75 39 27 15 16.6 42 0 100 Graduate from High School DirectlyEnroll Sophomore Year Graduate within 150% 25 to 44 with a Bachelor's Best Performing State US Average West Virginia Within 4 Years Enter College Population Sources: Tom Mortenson, ACT, NCES-IPEDS Graduation Rate Survey, US Census Bureau

23
College Participation

24
West Virginia = 43.7% Source: West Virginia Higher Education Policy Commission

26
Part-Time Undergraduate Enrollment as a Percent of 25 to 44 Year Olds (%) - 2000 Source: NCES-IPEDS, US Census Bureau 10.8 3.6 6.2 3.3 0 3 6 9 12 Arizona California Utah New Mexico Kansas Alaska Wyoming Nevada Illinois Oregon Michigan Nebraska Colorado Florida Missouri Washington Rhode Island Wisconsin Nation Maryland Texas Minnesota Virginia Iowa Oklahoma Delaware Maine North Carolina Hawaii Massachusetts Alabama Connecticut Idaho Ohio South Dakota Vermont Indiana South Carolina New Hampshire New Jersey Tennessee Arkansas New York Kentucky Georgia Louisiana Mississippi North Dakota West Virginia Pennsylvania Montana
 Source: NCES-IPEDS, US Census Bureau Arizona California Utah New Mexico Kansas Alaska Wyoming Nevada Illinois Oregon Michigan Nebraska Colorado Florida Missouri Washington Rhode Island Wisconsin Nation Maryland Texas Minnesota Virginia Iowa Oklahoma Delaware Maine North Carolina Hawaii Massachusetts Alabama Connecticut Idaho Ohio South Dakota Vermont Indiana South Carolina New Hampshire New Jersey Tennessee Arkansas New York Kentucky Georgia Louisiana Mississippi North Dakota West Virginia Pennsylvania Montana")
Similar presentations

 Arkansas Michigan CALIFORNIA MINNESOTA COLORADO NEVADA CONNECTICUT New Hampshire.>")


 While LIHEAP is intended to assist low-income families with their year-round home energy needs,>")


44% b)53%>")


