Download presentation
Presentation is loading. Please wait.

1
Selected Data for West Virginia Higher Education National Center for Higher Education Management Systems Presented on October 15, 2003 National Collaborative on Postsecondary Education

2
High School Graduation Rates – Public HS Graduates as a Percent of 9 th Graders Four Years Earlier (%) - 2000 Source: Tom Mortenson, Postsecondary Opportunity
 Source: Tom Mortenson, Postsecondary Opportunity")
3
College Going Rates – First-Time Freshmen Directly Out of HS as a Percent of Recent HS Graduates (%) - 2000 Source: Tom Mortenson, Postsecondary Opportunity
 Source: Tom Mortenson, Postsecondary Opportunity")
4
Source: NCES-IPEDS, Graduation Rate Survey Graduation Rates – Percent of Bachelor’s Students Graduating within Six Years (%) - 2000
")
5
Source: NCES-IPEDS, Graduation Rate Survey Graduation Rates – Percent of Associate Students at Two-Year Colleges Graduating within Three Years (%) - 2000
")
6
Student Pipeline Of 100 9 th Graders, How Many... Of 100 9 th Graders, How Many... Student Pipeline Of 100 9 th Graders, How Many... Of 100 9 th Graders, How Many... 84 58 28 38.8 67 38 26 18 26.7 75 39 27 15 16.6 42 0 100 Graduate from High School DirectlyEnroll Sophomore Year Graduate within 150% 25 to 44 with a Bachelor's Best Performing State US Average West Virginia Within 4 Years Enter College Population Sources: Tom Mortenson, ACT, NCES-IPEDS Graduation Rate Survey, US Census Bureau

7
Improvement in Preparation from the 2000 to 2002 Measuring Up Report Cards

8
Percent of Secondary Teachers Majored in the Subject Field They Teach – 1999-2000 Source: NCES, Schools and Staffing Survey

9
Percent of Secondary Students Taught by Teachers with At Least a Minor in the Subject Field They Teach – 1999-2000

10
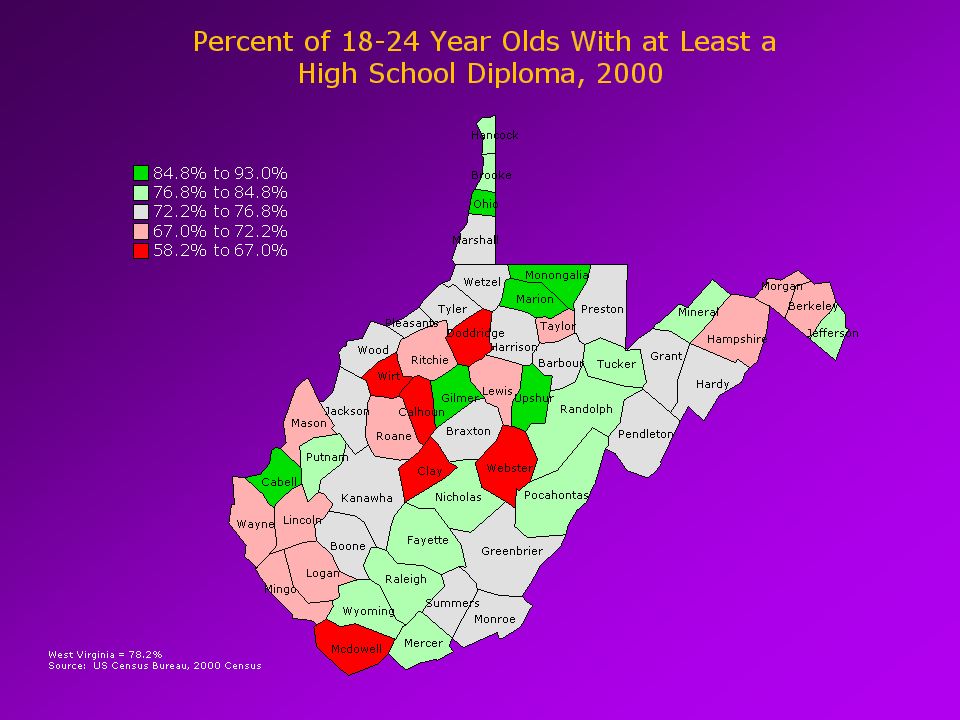
Percent of 18 to 24 Year Olds with at Least a High School Diploma - 2000 (%) 85.8 78.2 74.7 40% 90% Hawaii North Dakota Vermont Massachusetts Iowa Rhode Island Utah Nebraska Pennsylvania Maryland Virginia Minnesota Wyoming Maine Wisconsin Montana Kansas Connecticut South Dakota West Virginia New Hampshire Delaware Idaho Alaska Ohio Indiana Michigan Missouri New Jersey New York Illinois Arkansas Washington Colorado Tennessee Kentucky Oklahoma Nation South Carolina North Carolina Oregon Louisiana Alabama Florida Mississippi California New Mexico Georgia Arizona Texas Nevada 66.7 Source: US Census Bureau
 % 90% Hawaii North Dakota Vermont Massachusetts Iowa Rhode Island Utah Nebraska Pennsylvania Maryland Virginia Minnesota Wyoming Maine Wisconsin Montana Kansas Connecticut South Dakota West Virginia New Hampshire Delaware Idaho Alaska Ohio Indiana Michigan Missouri New Jersey New York Illinois Arkansas Washington Colorado Tennessee Kentucky Oklahoma Nation South Carolina North Carolina Oregon Louisiana Alabama Florida Mississippi California New Mexico Georgia Arizona Texas Nevada 66.7 Source: US Census Bureau")
11
Change in Percent of 18 to 24 Year Olds with at Least a High School Diploma – from 1990 to 2000 (%) 3.1 -1.7 -6 -4 -2 0 2 4% West Virginia California Arkansas Tennessee Idaho Rhode Island MontanaVermont Virginia Kentucky Utah MarylandWyoming Louisiana North Dakota Maine Alabama Indiana Massachusetts Florida Hawaii Ohio South Carolina Pennsylvania Missouri Nation Michigan Mississippi Texas Oregon New York Washington Iowa New Hampshire Illinois New Mexico New Jersey Oklahoma Connecticut Kansas Wisconsin North Carolina Georgia Nebraska South Dakota Delaware Alaska Minnesota Arizona Colorado Nevada -5.3 Source: US Census Bureau
 % West Virginia California Arkansas Tennessee Idaho Rhode Island MontanaVermont Virginia Kentucky Utah MarylandWyoming Louisiana North Dakota Maine Alabama Indiana Massachusetts Florida Hawaii Ohio South Carolina Pennsylvania Missouri Nation Michigan Mississippi Texas Oregon New York Washington Iowa New Hampshire Illinois New Mexico New Jersey Oklahoma Connecticut Kansas Wisconsin North Carolina Georgia Nebraska South Dakota Delaware Alaska Minnesota Arizona Colorado Nevada -5.3 Source: US Census Bureau")
13
Number of 18-24 Year-Olds With Less Than a High School Diploma, 2000 Number of 18-24 Year-Olds With Less Than a High School Diploma, 2000 West Virginia = 37,710 Source: US Census Bureau

14
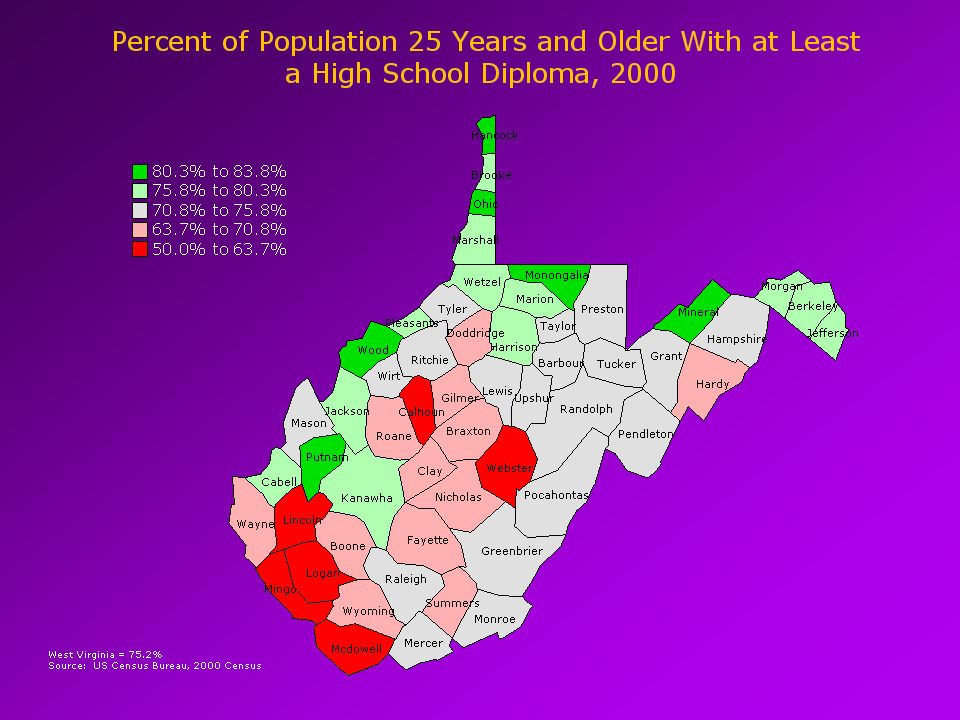
Percent of Adults 25 and Older with at Least a High School Diploma – 2000 (%) 88.3 75.2 80.4 72.9 40% 100% Alaska Wyoming Minnesota Utah New Hampshire Montana Washington Colorado Nebraska Vermont Iowa Kansas Maine Oregon Wisconsin Massachusetts Idaho Hawaii South Dakota Connecticut North Dakota Maryland Michigan Ohio Delaware Indiana New Jersey Pennsylvania Virginia Illinois Missouri Arizona Nevada Oklahoma Nation Florida New York New Mexico Georgia North Carolina Rhode Island California South Carolina Tennessee Texas Arkansas Alabama West Virginia Louisiana Kentucky Mississippi Source: US Census Bureau
 % 100% Alaska Wyoming Minnesota Utah New Hampshire Montana Washington Colorado Nebraska Vermont Iowa Kansas Maine Oregon Wisconsin Massachusetts Idaho Hawaii South Dakota Connecticut North Dakota Maryland Michigan Ohio Delaware Indiana New Jersey Pennsylvania Virginia Illinois Missouri Arizona Nevada Oklahoma Nation Florida New York New Mexico Georgia North Carolina Rhode Island California South Carolina Tennessee Texas Arkansas Alabama West Virginia Louisiana Kentucky Mississippi Source: US Census Bureau")
15
Change in Percent of Adults 25 and Older with at Least a High School Diploma – from 1990 to 2000 (%) 9.5 9.2 5.2 0.6 0 2 4 6 8 10% Kentucky West Virginia Arkansas Tennessee Mississippi Alabama North Carolina South Carolina Georgia South Dakota Missouri Ohio North Dakota Pennsylvania Maine Michigan Wisconsin Indiana Louisiana Virginia Montana Iowa Oklahoma Rhode Island Vermont Minnesota Florida Maryland New Jersey New Hampshire Illinois Nation Delaware Idaho Wyoming Nebraska Massachusetts Connecticut Kansas Hawaii New York New Mexico Oregon Texas Washington Utah Colorado Arizona Nevada Alaska California Source: US Census Bureau
 % Kentucky West Virginia Arkansas Tennessee Mississippi Alabama North Carolina South Carolina Georgia South Dakota Missouri Ohio North Dakota Pennsylvania Maine Michigan Wisconsin Indiana Louisiana Virginia Montana Iowa Oklahoma Rhode Island Vermont Minnesota Florida Maryland New Jersey New Hampshire Illinois Nation Delaware Idaho Wyoming Nebraska Massachusetts Connecticut Kansas Hawaii New York New Mexico Oregon Texas Washington Utah Colorado Arizona Nevada Alaska California Source: US Census Bureau")
17
GEDs Awarded to 18-24 Year Olds Per 1,000 18-24 Year Olds with Less than a High School Diploma - 2000 Source: GED Testing Service, US Census Bureau 140.7 39.6 51.0 5.8 0 30 60 90 120 150 Maine Wyoming Alaska Montana Kentucky Rhode Island Oregon Utah Indiana Vermont Iowa Kansas New Hampshire North Dakota West Virginia New Mexico Florida Wisconsin Colorado Washington Tennessee Minnesota South Dakota Nebraska Hawaii New York Arkansas Ohio Massachusetts Oklahoma GeorgiaVirginia Nation Mississippi Michigan Missouri Illinois Maryland Pennsylvania Connecticut Alabama Nevada North Carolina Texas Louisiana Arizona South Carolina New Jersey Delaware California Idaho

18
GEDs Awarded to Adults 25 and Older Per 1,000 Adults 25 and Older with Less than a High School Diploma - 2000 Source: GED Testing Service, US Census Bureau 13.2 3.6 1.3 4.2 0 3 6 9 12 15 Maine Alaska Kentucky Wyoming Utah Washington Colorado Oregon Oklahoma Montana Iowa Indiana Kansas New Missouri South Dakota Illinois Arizona Arkansas Ohio Wisconsin Texas Minnesota Nevada Tennessee Georgia New Mexico Rhode Island Connecticut New York Nation Virginia Michigan North West Virginia Florida Maryland North Dakota Vermont Nebraska Pennsylvania Massachusetts Alabama Louisiana California New Jersey South Carolina Mississippi Hawaii Delaware Idaho

19
Percent of Adults 25 to 64 with a Bachelor’s Degree or Higher - 2000 37.1 26.5 16.5 0 10 20 30 40 Massachusetts Colorado Connecticut Maryland New Jersey Virginia Vermont New Hampshire Minnesota New York Washington Illinois Rhode Island Hawaii Kansas California Utah Nebraska Oregon Delaware Montana Nation Georgia North Dakota Alaska Pennsylvania Wisconsin Maine Arizona Texas New Mexico South Dakota Missouri North Carolina Iowa Florida Michigan Wyoming Idaho Ohio Oklahoma South Carolina Indiana Tennessee Alabama Louisiana Nevada Kentucky Arkansas Mississippi West Virginia Source: US Census Bureau

20
Change in Percent of Adults 25 to 64 with a Bachelor’s Degree or Higher – 1990 to 2000 (%) 5.8 3.9 2.7 1.7 0 6% Massachusetts Colorado Minnesota Vermont Nebraska North Carolina Virginia Illinois Maryland Georgia New Jersey Kansas Wisconsin South Dakota Pennsylvania Iowa Michigan Montana Washington North Dakota Ohio Rhode Island Oregon New Hampshire Maine Indiana Idaho New York Nation Connecticut South Carolina Florida Missouri Delaware Kentucky Utah Tennessee Hawaii Alabama Arkansas Wyoming Arizona New Mexico California West Virginia Texas Nevada Louisiana Oklahoma Mississippi Alaska Source: US Census Bureau
 % Massachusetts Colorado Minnesota Vermont Nebraska North Carolina Virginia Illinois Maryland Georgia New Jersey Kansas Wisconsin South Dakota Pennsylvania Iowa Michigan Montana Washington North Dakota Ohio Rhode Island Oregon New Hampshire Maine Indiana Idaho New York Nation Connecticut South Carolina Florida Missouri Delaware Kentucky Utah Tennessee Hawaii Alabama Arkansas Wyoming Arizona New Mexico California West Virginia Texas Nevada Louisiana Oklahoma Mississippi Alaska Source: US Census Bureau")
23
Part-Time Undergraduate Enrollment as a Percent 25 to 44 Year Olds (%) - 2000 Source: NCES-IPEDS, US Census Bureau 10.8 3.6 6.2 3.3 0 3 6 9 12 Arizona California Utah New Mexico Kansas Alaska Wyoming Nevada Illinois Oregon Michigan Nebraska Colorado Florida Missouri Washington Rhode Island Wisconsin Nation Maryland Texas Minnesota Virginia Iowa Oklahoma Delaware Maine North Carolina Hawaii Massachusetts Alabama Connecticut Idaho Ohio South Dakota Vermont Indiana South Carolina New Hampshire New Jersey Tennessee Arkansas New York Kentucky Georgia Louisiana Mississippi North Dakota West Virginia Pennsylvania Montana
 Source: NCES-IPEDS, US Census Bureau Arizona California Utah New Mexico Kansas Alaska Wyoming Nevada Illinois Oregon Michigan Nebraska Colorado Florida Missouri Washington Rhode Island Wisconsin Nation Maryland Texas Minnesota Virginia Iowa Oklahoma Delaware Maine North Carolina Hawaii Massachusetts Alabama Connecticut Idaho Ohio South Dakota Vermont Indiana South Carolina New Hampshire New Jersey Tennessee Arkansas New York Kentucky Georgia Louisiana Mississippi North Dakota West Virginia Pennsylvania Montana")
25
WV Change in Gross State Product and Comparison to the US Source: US Bureau of Economic Analysis 1% 11% 4% 18% 12% 5% 10% 13% 1% 6% 5% 11% 6% 1% 0% 19% 22% 11% 15% 14% 10% 12% 19% 17% 7% 9% 8% 5% 16% 12% 0% 25% Agriculture, forest., fish Mining Construction Manufacturing Transportation & utilities Wholesale trade Retail trade F.I.R.E. Services Government 19902000Nation in 2000

26
Employment by Job Type (1998-2001) Source: Tony Carnevale, Donna Deroschers (ETS) 3.0% 18.9% 23.0% 6.5% 8.8% 33.3% 6.4% 1.3% 21.1% 5.6% 10.1% 38.5% 6.9% 16.6% 0.0% 5.0% 10.0% 15.0% 20.0% 25.0% 30.0% 35.0% 40.0% 45.0% Natural Resources FactoryLow-Skilled Service HealthcareEducation, Public Service OfficeHigh Tech West VirginiaUS
 Source: Tony Carnevale, Donna Deroschers (ETS) 3.0% 18.9% 23.0% 6.5% 8.8% 33.3% 6.4% 1.3% 21.1% 5.6% 10.1% 38.5% 6.9% 16.6% 0.0% 5.0% 10.0% 15.0% 20.0% 25.0% 30.0% 35.0% 40.0% 45.0% Natural Resources FactoryLow-Skilled Service HealthcareEducation, Public Service OfficeHigh Tech West VirginiaUS")
27
Percent of Employees with a College Degree by Job Type (1998-2001) Source: Tony Carnevale, Donna Deroschers (ETS) 7.7% 7.5% 13.0% 50.3% 30.6% 57.8% 26.3% 10.3% 17.1% 62.6% 43.0% 66.2% 36.1% 12.3% 0% 20% 40% 60% 80% Natural Resources FactoryLow-Skilled Service Education and Healthcare OfficeHigh TechAll Jobs West VirginiaUS
 Source: Tony Carnevale, Donna Deroschers (ETS) 7.7% 7.5% 13.0% 50.3% 30.6% 57.8% 26.3% 10.3% 17.1% 62.6% 43.0% 66.2% 36.1% 12.3% 0% 20% 40% 60% 80% Natural Resources FactoryLow-Skilled Service Education and Healthcare OfficeHigh TechAll Jobs West VirginiaUS")
28
Earnings by Job Type (1998-2001) Source: Tony Carnevale, Donna Deroschers (ETS) $36,425 $27,878 $14,423 $31,259 $28,059 $29,835 $36,551 $26,485 $20,765 $17,517 $39,701 $31,153 $40,807 $49,689 $33,221 $28,853 $0 $10,000 $20,000 $30,000 $40,000 $50,000 $60,000 Natural Resources FactoryLow-Skilled Service HealthcareEducation, Public Service OfficeHigh TechAll Jobs West VirginiaUS
 Source: Tony Carnevale, Donna Deroschers (ETS) $36,425 $27,878 $14,423 $31,259 $28,059 $29,835 $36,551 $26,485 $20,765 $17,517 $39,701 $31,153 $40,807 $49,689 $33,221 $28,853 $0 $10,000 $20,000 $30,000 $40,000 $50,000 $60,000 Natural Resources FactoryLow-Skilled Service HealthcareEducation, Public Service OfficeHigh TechAll Jobs West VirginiaUS")
29
13,520 24,200 25,000 31,500 40,000 55,125 75,000 100,000 10,000 19,760 20,000 25,000 33,000 42,000 58,000 63,000 9,777 17,000 16,000 20,000 29,000 35,000 51,000 50,000 $0 $100,000 Less Than HSHS or Equivalent Some CollegeAssociateBachelor'sMastersDoctorateProfessional Top StateUSWest Virginia Median Earnings by Degree-Level ($) Source: US Census Bureau, Current Population Survey – 1998 to 2001
 Source: US Census Bureau, Current Population Survey – 1998 to 2001")
30
Difference in Median Earnings from a High School Diploma to a Bachelor’s Degree ($) Source: US Census Bureau, Current Population Survey – 1998 to 2001
 Source: US Census Bureau, Current Population Survey – 1998 to 2001")
31
Difference in Median Earnings from a High School Diploma to an Associates Degree ($) Source: US Census Bureau, Current Population Survey – 1998 to 2001
 Source: US Census Bureau, Current Population Survey – 1998 to 2001")
32
Percent Employment in Professional and Management Occupations – 2000 Source: US Census Bureau

33
Interstate Migration of Adults with a Bachelor’s Degree or Higher: Change in the Stock of Adults with a Bachelor’s Degree or Higher Minus the Number of Bachelor’s Degrees Awarded (1990 to 2000) – 25 to 64 Year Olds Source: US Census Bureau, IPEDS Completions Survey 193 167 106 82 74 67 64 58 44 33 21 20 15 2 -4 -7 -8 -9 -12 -13 -14 -17 -19 -24 -27 -30 -37 -49 -50-51 -53 -57 -72 -75 -79 -80 -88 -93 -109 -120 -124 -138 -173 -281 -380 -51 -46 -10 -400 -200 0 200 Florida Georgia Colorado New Jersey Washington Arizona Nevada North Carolina Texas Virginia Oregon Maryland Idaho Alaska New Mexico Wyoming TennesseeMinnesota Hawaii Montana South Carolina DelawareArkansas South Dakota Maine Vermont New Hampshire Kentucky North Dakota Nebraska Mississippi Kansas Connecticut West Virginia Utah Illinois Rhode Island California WisconsinOklahomaAlabama Iowa LouisianaMissouriIndiana Michigan Massachusetts Ohio Pennsylvania New York (In Thousands) From 1990 to 2000, West Virginia Produced 84,106 Bachelor’s Degrees – While the Number of Adults 25-64 with a Bachelor’s Degree or Higher Rose by Only 33,577
 – 25 to 64 Year Olds Source: US Census Bureau, IPEDS Completions Survey Florida Georgia Colorado New Jersey Washington Arizona Nevada North Carolina Texas Virginia Oregon Maryland Idaho Alaska New Mexico Wyoming TennesseeMinnesota Hawaii Montana South Carolina DelawareArkansas South Dakota Maine Vermont New Hampshire Kentucky North Dakota Nebraska Mississippi Kansas Connecticut West Virginia Utah Illinois Rhode Island California WisconsinOklahomaAlabama Iowa LouisianaMissouriIndiana Michigan Massachusetts Ohio Pennsylvania New York (In Thousands) From 1990 to 2000, West Virginia Produced 84,106 Bachelor’s Degrees – While the Number of Adults with a Bachelor’s Degree or Higher Rose by Only 33,577")
34
Ratio of Net Migration of Bachelor’s Degrees to the Number of Bachelor’s Degrees Produced (%) Source: US Census Bureau, IPEDS Completions Survey, Tom Mortenson, Postsecondary Opportunity
 Source: US Census Bureau, IPEDS Completions Survey, Tom Mortenson, Postsecondary Opportunity")
35
Corporation for Enterprise Development – “Development Report Card for the States” 2001 2001

36
Progressive Policy Institute – “State New Economy Index” (2002)
")
37
States Ability to Produce Graduates vs. Ability to Keep and Attract Graduates Student Pipeline (Of 100 9 th Graders – the Number Graduating from HS on time, Going Directly to College, Returning Their Second Year, and Completing College within 150 Percent of Degree Time) Educational Capital Percent of 25-44 Year Olds with a Bachelor’s Degree or Higher - 2000 30 20 10 7.51522.530 40 AK NV TX NM GA OK LA AR MS HI KY AL TN OR ID SC AZ FL WV WA MT MD IL VA IN UT CA OH NC MI CO NY MO DE VT KS SD WI NE ME US ND MN CT NH PA IA NJ RI MA Regression Line 0 State New Economy Index Scores (2002) Top Tier Middle Tier Low Tier
 Educational Capital Percent of Year Olds with a Bachelor’s Degree or Higher AK NV TX NM GA OK LA AR MS HI KY AL TN OR ID SC AZ FL WV WA MT MD IL VA IN UT CA OH NC MI CO NY MO DE VT KS SD WI NE ME US ND MN CT NH PA IA NJ RI MA Regression Line 0 State New Economy Index Scores (2002) Top Tier Middle Tier Low Tier.")
38
Total Research and Development Expenditures Per Capita (2000) Source: National Science Foundation, US Census Bureau
 Source: National Science Foundation, US Census Bureau")
39
Federal Research and Development Expenditures Per Capita (2000) Source: National Science Foundation, US Census Bureau
 Source: National Science Foundation, US Census Bureau")
40
Projected Change in the Population 2000 to 2020 Projected Change in the Population 2000 to 2020 Source: US Census Bureau

41
Projection of 18-24 Year Olds (Traditional College Age – from 2000 to 2025) Projection of 18-24 Year Olds (Traditional College Age – from 2000 to 2025) Source: US Census Bureau 172,431 140,402 120,000 140,000 160,000 180,000 200020052010201520202025 -18.6 % Decline The Largest Decrease of all 50 States -18.6 % Decline The Largest Decrease of all 50 States
 Projection of Year Olds (Traditional College Age – from 2000 to 2025) Source: US Census Bureau 172, , , , , , % Decline The Largest Decrease of all 50 States % Decline The Largest Decrease of all 50 States")
42
Projection of High School Graduates (from 2002 to 2012) Projection of High School Graduates (from 2002 to 2012) Source:Knocking at the Door: Projections of High School Graduates, 1996-2012 Western Interstate Commission for Higher Education 18,868 17,473 16,000 17,000 18,000 19,000 20,000 2001-022003-042005-062007-082009-102011-12 -7.4 % Decline The 10 th Largest Decrease of all 50 States -7.4 % Decline The 10 th Largest Decrease of all 50 States
 Projection of High School Graduates (from 2002 to 2012) Source:Knocking at the Door: Projections of High School Graduates, Western Interstate Commission for Higher Education 18,868 17,473 16,000 17,000 18,000 19,000 20, % Decline The 10 th Largest Decrease of all 50 States -7.4 % Decline The 10 th Largest Decrease of all 50 States")
43
Source: US Census Bureau Projected West Virginia Population Growth Number Change from 2000 to 2020 – By Race -52,439 -28,968 -86,299 35,468 119,575 14 -31 -1,151 4,308 1,6061,592 835 2,258 3,101 1,872 -90,000 -60,000 -30,000 0 30,000 60,000 90,000 120,000 0 to 1718 to 2425 to 4445 to 6465 and Older WhiteBlackHispanic

44
Next Steps More data analysis by county and region to develop more information about intrastate variationsMore data analysis by county and region to develop more information about intrastate variations Work with the Leadership group to determine a set of “key issues” facing West VirginiaWork with the Leadership group to determine a set of “key issues” facing West Virginia Policy auditPolicy audit

Similar presentations


 of 30 or higher. Body Mass.>")
 Florida (FL) Georgia (GA) Mississippi (MS) Louisiana (LA) Arkansas (AR) Tennessee (TN)>")


