Download presentation
Presentation is loading. Please wait.

1
Ecosystem Ecology Chapter 54. Ecosystem ecology emphasizes energy flow and chemical cycling. An ecosystem consists of all of the organisms in a community as well as the abiotic components they interact with.

2
Ecosystems and physical laws Ecosystems follow established physical laws. Energy can neither be created nor destroyed it can only be converted from one form to another. The amount of entropy (or disorder) in a system increases (i.e at every step in energy conversion some energy is dissipated as heat, which is not available for work).
 in a system increases (i.e at every step in energy conversion some energy is dissipated as heat, which is not available for work)..")
3
Energy from the sun underpins global ecosystems The Earth is not a closed system. Energy comes in from outside (i.e., from the sun), moves through ecosystems and ultimately is dissipated into space as heat.
, moves through ecosystems and ultimately is dissipated into space as heat..")
4
Nutrients Unlike energy, nutrients are constantly recycled from one form to another and pass through multiple trophic levels to decomposers to abiotic forms and back to living organisms again.

5
Ecosystem ecologists deal with large-scale processes and so group organisms into broad classes (primary producers [e.g. plants, primary consumers [e.g. grazing animals], etc.). Detritivores (or decomposers) are a group of major interest to ecosystem ecologists as these break down non-living organic material (e.g., dead leaves, wood, carrion) releasing their components.
. Detritivores (or decomposers) are a group of major interest to ecosystem ecologists as these break down non-living organic material (e.g., dead leaves, wood, carrion) releasing their components..")
7
Detritivores Main decomposers are fungi and bacteria. These break down organic matter and release chemical elements into the soil, water and air where producers can recycle them into organic compounds. Without the action of decomposers life would cease because essential nutrients would remain locked up in detritus and unavailable to organisms.

8
Fungal decomposition of a tree stump

9
Primary Production About 1% of the visible light that strikes earth is converted by photosynthesis into chemical energy. This is enough energy to create about 170 billion tons of organic matter annually.

10
Gross and net primary productivity In an ecosystem gross primary productivity (GPP) is the amount of light energy converted into chemical energy per unit time. Net primary productivity (NPP) is gross primary productivity minus the energy used by the primary producers for respiration.
 is gross primary productivity minus the energy used by the primary producers for respiration..")
11
Net primary productivity Net primary productivity indicates how much energy is available for use by other trophic levels. It is measured as biomass of vegetation added to the ecosystem per unit area per unit time (g/m 2 /yr).
..")
12
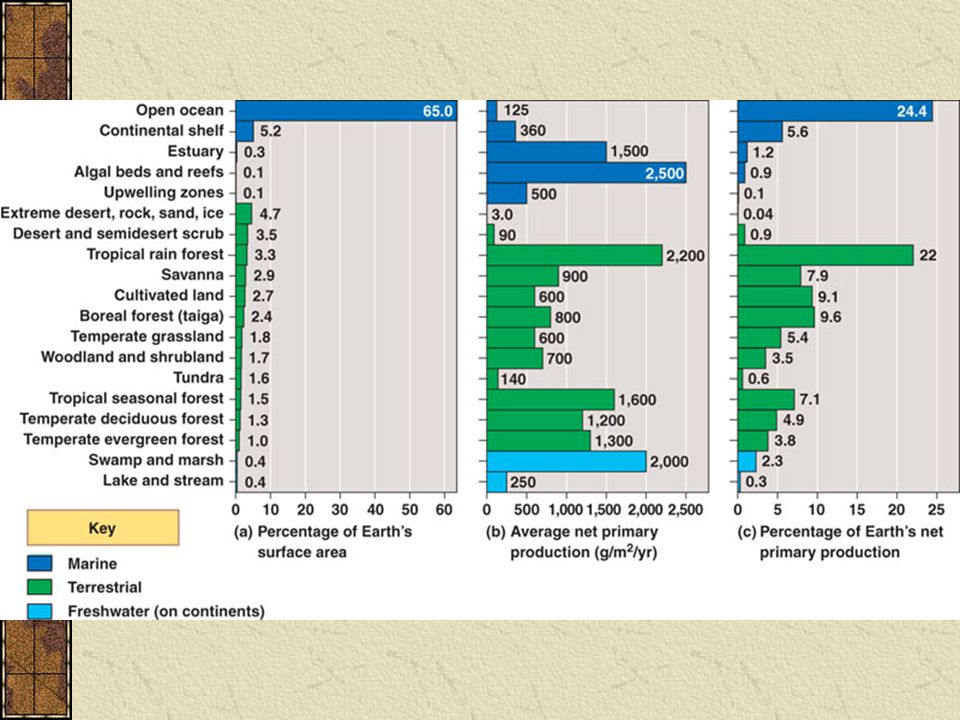
Net primary productivity NPP is influenced by light and nutrient availability and differs among ecosystems. Tropical rain forests have high NPP as do estuaries and coral reefs. Lakes, tundra and the open ocean have relatively low NPP.

14
Global net primary productivity Tropical rainforests contribute about 22% of the Earth’s total NPP and open ocean about 24%. The open ocean has a much lower rate of NPP, but covers a far larger area. Various temperate forests and grasslands and the continental shelf (shallow continental waters) contribute most of the rest.
 contribute most of the rest..")
15
Global net primary productivity Overall, terrestrial ecosystems contribute about 66% of NPP and marine ecosystems the remainder.

17
Limits on primary productivity In marine and freshwater ecosystems both light and nutrients are important in controlling NPP. The inability of light to penetrate the water limits photosynthesis to the upper layers. More than 50% of solar radiation is absorbed in the first meter. Even in clear water, only about 5-10% of radiation reaches a depth of 20m.

18
Limits on primary productivity Even though there is a gradient in light energy from tropics to poles there is no corresponding gradient in NPP. Suggests light not only factor limiting NPP

19
Regional annual net primary production for Earth

20
Limits on primary productivity Nutrient limitation is a major factor affecting NPP in aquatic biomes. In marine environments the nutrients limiting primary productivity are usually nitrogen and phosphorus, which are scarce in the photic zone.

21
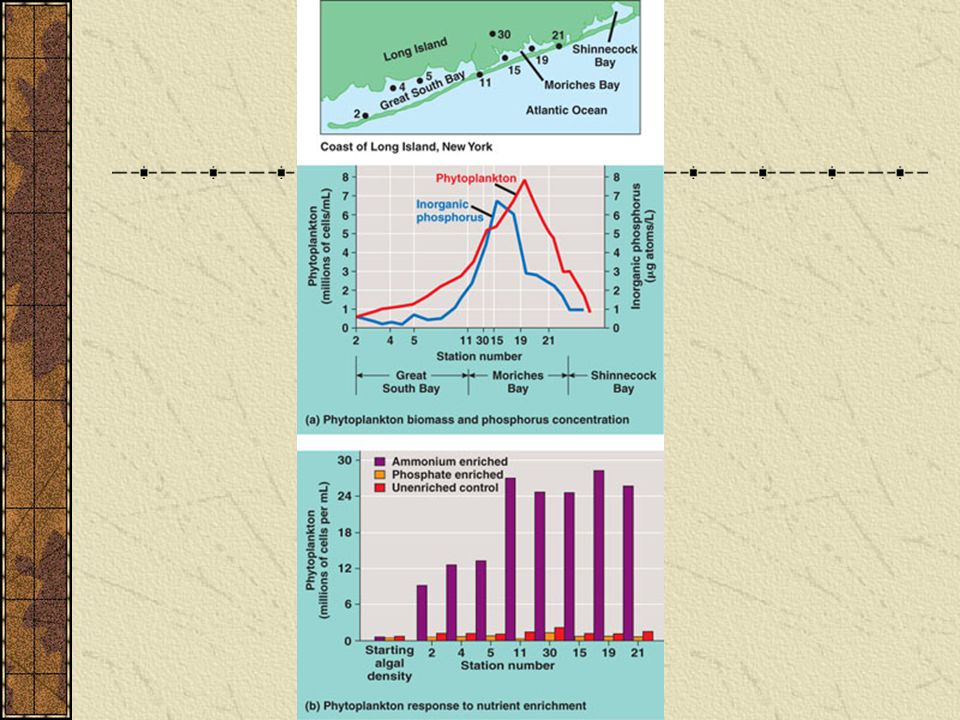
Limits on primary productivity Duck farms on Long Island add nitrogen and phosphorus to the ocean water. Phytoplankton growth parallels levels of inorganic phosphorus, but nitrogen is the limiting nutrient because adding nitrogen (in the form of ammonium) increases phytoplankton growth but adding phosphorus does not.
 increases phytoplankton growth but adding phosphorus does not..")
23
Limits on primary productivity Consistent with the hypothesis that nutrients limit NPP in the ocean is the observation that areas of upwelling, where deep nutrient-rich waters are brought to the surface are the most productive. The world’s great fisheries are all located in such areas: Peruvian Anchovy Fishery, Grand Banks.

24
Chemical Cycling Nutrients move between organic and inorganic parts of the ecosystem in biogeochemical cycles. Cycles may be global or local. Nutrient cycles with a gaseous component (carbon, sulfur, nitrogen) are global whereas phosphorus, potassium and calcium cycle more locally (at least on short time scales).
 are global whereas phosphorus, potassium and calcium cycle more locally (at least on short time scales)..")
25
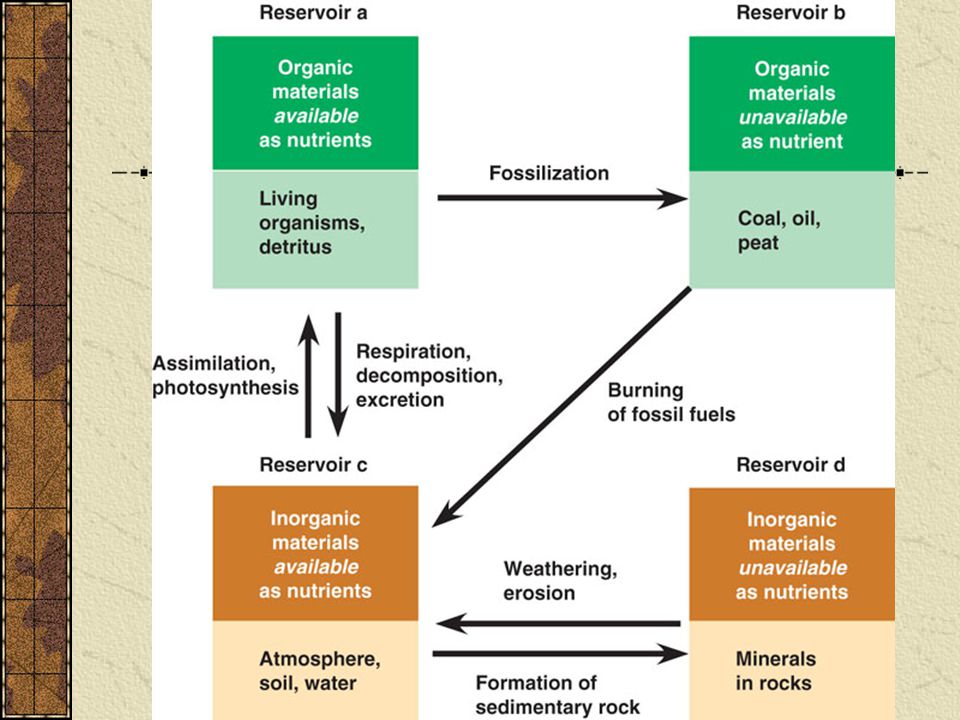
General Structure of Nutrient Cycles There are four basic reservoirs for any nutrient each defined by two characteristics: whether it is organic or inorganic and whether or not nutrients are directly available for use by living organisms.

27
General Structure of Nutrient Cycles Nutrients can move from one reservoir to another by a variety of processes. For example: available inorganic nutrients can become available organic nutrients by assimilation and photosynthesis. Conversely, available organic nutrients can become available inorganic nutrients through respiration, decomposition and excretion.

28
General Structure of Nutrient Cycles Unavailable nutrients can become available from both organic sources such as oil and coal by burning fossil fuels (releasing e.g. CO 2 ) and inorganic sources by weathering and erosion of rocks.
 and inorganic sources by weathering and erosion of rocks..")
30
Major Nutrient Cycles Major nutrient cycles include: Water Carbon Nitrogen Phosphorus

31
Carbon Cycle Carbon forms the basis of all organic molecules (organic chemistry is the study of carbon chemistry). Fats, sugars, DNA, proteins etc. all contain carbon. Photosynthetic organisms take in CO 2 from the air and using energy from sunlight join carbon atoms to make sugars (energy is stored in the chemical bonds).
..")
32
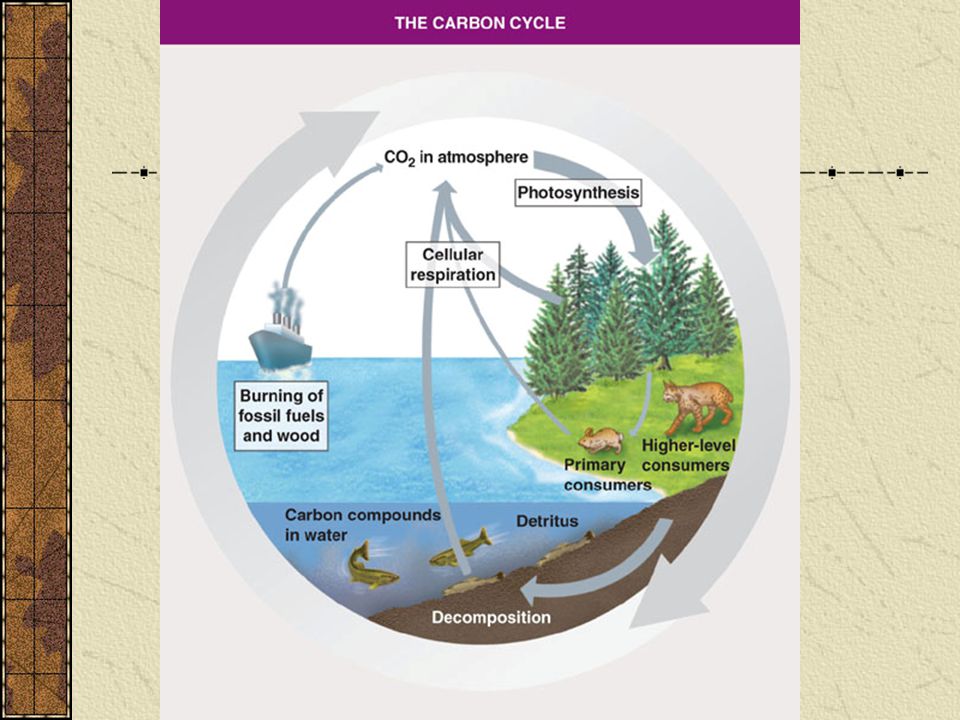
Carbon Cycle Major reservoirs of carbon include: atmospheric CO 2, ocean (dissolved carbon compounds), biomass of organisms, fossil fuels and sedimentary rocks.
, biomass of organisms, fossil fuels and sedimentary rocks.")
33
Carbon Cycle Photosynthesis removes large amounts of atmospheric CO 2 An approximately equal amount of CO 2 is returned to atmosphere by cellular respiration. Burning of fossil fuels adds large amounts CO 2 to the atmosphere.

35
Decomposition and nutrient cycling rates The rates at which nutrients cycle is strongly affected by the rates at which decomposers work. In the tropics, warmer temperatures and abundant moisture cause organic material to decompose 2-3 times faster than it does in temperate regions.

36
54.18

37
Decomposition and nutrient cycling rates High rate of decomposition means little organic material accumulates as leaf litter. In tropical forest about 75% of nutrients are in woody trunks of trees and only about 10% in soil. In temperate forest about 50% of nutrients are in the soil because decomposition is slower.

38
Decomposition and nutrient cycling rates In aquatic ecosystems decomposition in anaerobic sediments can be very slow (50 years or more). As a result sediments are often a nutrient sink and only when there is upwelling are marine ecosystems highly productive.

39
Human effects on nutrient cycles Agriculture and nutrient cycling. Soils differ in the amount of nutrients stored in organic matter that they contain. Soils with large stores (e.g. prairie soils) can be used for agriculture for many years before requiring fertilization. In tropical forest soils, however, there are few stored nutrients and the soil quickly becomes exhausted.
 can be used for agriculture for many years before requiring fertilization. In tropical forest soils, however, there are few stored nutrients and the soil quickly becomes exhausted..")
40
Human effects on nutrient cycles Nitrogen is main nutrient removed through agriculture (when the biomass is removed from the field). The removed nitrogen needs to be replaced and industrially produced fertilizers are used.

42
Human effects on nutrient cycles Recent studies suggest that human activities (fertilization and increased planting of legumes) have approximately doubled the supply of nitrogen available to plants. A major problem with intensive farming is that fertilizer runoff.

43
Human effects on nutrient cycles Fertilizers that are applied in amounts greater than plants can use or that are applied when plants are not in the fields leach into groundwater or run off into streams and rivers.

44
Human effects on nutrient cycles The heavy supply of nutrients causes blooms of algae and cyanobacteria as well as explosive growth of water weeds.

45
Human effects on nutrient cycles Because respiration by plants depletes the oxygen levels at night this process of eutrophication can cause fish kills. Eutrophication of Lake Erie, for example, wiped out commercially important populations of fish including lake trout, blue pike and whitefish in the 1960’s.

46
Acid rain Burning wood, coal and other fossil fuels releases oxides of sulfur and nitrogen that react with water in the atmosphere to form sulphuric and nitric acid. These acids fall to Earth as acid precipitation (rain, snow, sleet), which has a pH of less than 5.6.
, which has a pH of less than")
47
Acid rain Pollutants produced by power plants travel large distances on the prevailing winds before falling to the Earth. As a result, the areas harmed by acid rain are usually far from the pollution’s source. Acid rain in Eastern U.S. caused by power plants in midwest.

48
Fig. 54.21

49
Acid rain In terrestrial ecosystems the acid rain can leach nutrients from the soil and stunt plant growth. Freshwater lakes very vulnerable to effects of acid rain especially where bedrock is granite. Such lakes lack a buffering capacity because bicarbonate levels are low.

50
Acid rain Many fish are intolerant of low pH levels (e.g. at <pH 5.4 newly hatched trout die). Thus, acid rain has had major effects on fish communities.
. Thus, acid rain has had major effects on fish communities..")
51
54.22

52
Acid rain Environmental regulation and new technology have reduced sulfur dioxide emissions over the past 30 years in the U.S. and they fell 31% between 1993 and 2002. Water chemistry in eastern U.S. is improving, but will require another 10-20 years to recover even if emissions continue to decrease.

53
Environmental toxins Huge variety of toxic chemicals are produced and move through food webs. Some are excreted, but other accumulate in fat and become more concentrated in upper levels of the food chain (a process called Biomagnification).
..")
54
Environmental toxins Chlorinated hydrocarbons (which include pesticides such as DDT and industrial chemicals such as PCBs) are well known to biomagnify. PCB levels in herring gulls in Great Lakes are 5,000 times greater than in phytoplankton

55
54.23

56
Environmental toxins At higher levels chlorinated hydrocarbons can be toxic or severely affect hormone levels. Story of DDT is well known. Widely sprayed after WWII to kill mosquitoes and agricultural pests.

57
Environmental toxins DDT accumulated in tissues of predatory birds and interfered with deposition of calcium in eggshells so eggs were brittle and could not be incubated. DDT was banned in U.S. in 1971 after public outcry inspired by Rachel Carson’s Silent Spring. Still used elsewhere on the globe.

58
Increases in atmospheric CO 2 levels Since the industrial revolution carbon dioxide levels in atmosphere have increased due to burning of fossil fuels and burning of forests. Since 1958 CO 2 levels have increased 17%. By 2075, at current rates of increase, CO 2 levels will be double what they were in the mid 1800’s.

59
Increases in atmospheric CO 2 levels Consequences of increased CO 2 levels include: effects on growth of plants changes in plant distributions effects on global climate

60
Increases in atmospheric CO 2 levels Most plants grow better with higher levels of CO 2. However, the growth of one group of plants called C3 plants is more limited by low atmospheric CO 2 levels. Under hot dry conditions, when they must limit water loss by closing the air exchange pores in their leaves (stomata), the CO 2 levels in their leaves falls so much that photosynthesis almost shuts down.
, the CO 2 levels in their leaves falls so much that photosynthesis almost shuts down..")
61
Increases in atmospheric CO 2 levels If global CO 2 levels increase, these plants may spread into areas where they have not previously occurred displacing the other group (C4 plants), which are more efficient at photosynthesis under low CO 2 levels. Major agricultural crops include both C3 plants (rice, wheat and soybeans) and C4 plants (corn) so changes in CO 2 levels may affect which plants farmers choose to plant.
 and C4 plants (corn) so changes in CO 2 levels may affect which plants farmers choose to plant..")
62
Increases in atmospheric CO 2 levels Effects of increased CO 2 levels on forests are being explored in a large-scale experiment at the Duke University Forest. In the long-term work high levels of CO 2 are being pumped into the air over forest plots. In the experimental plots CO 2 levels are increased to 1.5X current CO 2 levels.

64
Increases in atmospheric CO 2 levels Comparison of tree growth in experimental and control plots has shown higher rates of photosynthesis in experimental plots, higher soil respiration, and that pine seeds are heavier in experimental plots.

65
Increases in atmospheric CO 2 levels Concerns have been raised about effects of increased CO 2 levels on global climate. CO 2 and water vapor in atmosphere trap some heat radiated from Earth and reflect it back. This greenhouse effect keeps the planet warm.

66
Increases in atmospheric CO 2 levels There is widespread concern that increased CO 2 levels is causing global warming. Temperature data show a great deal of variation and there is debate about how much warming has occurred and how fast it it occurring. However, there is a general consensus that warming has occurred.

68
Increases in atmospheric CO 2 levels An increase of one or two degrees Celsius in global average temperature could have major consequences. For example, melting of the polar icecaps could raise sea levels dramatically.

69
Increases in atmospheric CO 2 levels Models of climate change are complex and include a lot of assumptions, but global climate changes might be dramatic. For example a shift in the direction of the Gulf Stream caused by changes in sea temperatures would cause the western European climate to become much colder.

70
Increases in atmospheric CO 2 levels Many models also predict an increase in the frequency and strength of hurricanes as warmer sea temperatures provide energy that feeds these storms. Increases in atmospheric CO 2 levels may also increase the acidity of oceans as some CO 2 is converted to acids such as carbonic acid. Increased acidity may have drastic effects on coral reefs, which may dissolve.

71
Increases in atmospheric CO 2 levels Efforts to reduce CO 2 emissions are underway, but there is considerable political wrangling because of economic concerns. Whether the current trends will be reversed is thus unclear.

72
Depletion of ozone levels A protective layer of ozone (O 3 ) shields the earth from harmful levels of UV radiation. However, the ozone layer has been thinning since the mid 1970’s especially over the southern hemisphere.

75
Depletion of ozone levels Cause of the depletion appears to be accumulation of chlorfluocarbons (CFCs, which are used as refrigerants and aerosol propellants). When CFC breakdown products rise into the stratosphere, chlorine contained in them breaks down ozone and produces oxygen.

77
Depletion of ozone levels Cold temperatures over Antarctic facilitate these atmospheric reactions. Ozone hole over Australia has resulted in higher incidences of skin cancer. CFCs have now been widely banned and the rate of ozone depletion has slowed, but the chlorine already in the atmosphere will continue to exert an effect for at least a century.

Similar presentations


 and all the abiotic factors that they interact with. Ecosystems receive.>")
