Download presentation
Presentation is loading. Please wait.

1
UNCE, Reno, NV Nutrients Phosphorus Nitrogen

2
The biggest concern with excess nutrients is eutrophication Results in: impacts on lake/stream ecology webs; toxins; drinking water treatment problems; other changes in lake chemistry

3
Dead plants decay Excess nutrients Excess aquatic plants Fish kills Low dissolved oxygen Freshwater Life Image Archive

4
Plants require Oxygen, Carbon, Nitrogen and Phosphorus in a fixed ratio 212 : 106 : 16 : 1 (by molarity –eg moles/liter) 109 : 41 : 7.2 : 1 (by weight- eg mg / liter) Redfield Ratio
 109 : 41 : 7.2 : 1 (by weight- eg mg / liter) Redfield Ratio")
5
Nutrient Limitation Typically N or P is “limiting” to aquatic plant production (not present at Redfield ratio) Adding more of the limiting nutrient increased biological production until another nutrient or other factor limits growth 212 : 106 : 16 : 1 (by atoms) 109 : 41 : 7.2 : 1 (by weight)
 Adding more of the limiting nutrient increased biological production until another nutrient or other factor limits growth 212 : 106 : 16 : 1 (by atoms) 109 : 41 : 7.2 : 1 (by weight)")
6
To determine limiting nutrient measure the ratio of N:P in a water body and compare to Redfield ratio 16 : 1 (by atoms) = molar ratio 7.2 : 1 (by weight) Ratios of Total N to Total P < 10 (by weight) => N limits algal growth Ratios > 20 (by weight) => P limits algal growth Ratios in between – “co-limitation” – response hard to predict
 = molar ratio 7.2 : 1 (by weight) Ratios of Total N to Total P < 10 (by weight) => N limits algal growth Ratios > 20 (by weight) => P limits algal growth Ratios in between – co-limitation – response hard to predict")
7
Why focus on phosphorus? “Traditional” view (which many question): Phosphorus assumed to be limiting in many pristine waters in mid- latitudes Many studies have demonstrated relationship between phosphorus loading to lakes and increased algae Practical view (which fewer question): In many cases, reducing phosphorus reduces algae Phosphorus removal much more feasible and less expensive
: Phosphorus assumed to be limiting in many pristine waters in mid- latitudes Many studies have demonstrated relationship between phosphorus loading to lakes and increased algae Practical view (which fewer question): In many cases, reducing phosphorus reduces algae Phosphorus removal much more feasible and less expensive.")
8
Phosphorus Cycle

9
Natural phosphorus sources: Terrestrial rocks Marine sediments Sediment Guano Organic material Atmospheric deposition Human phosphorus sources (often more biologically available) Sediment (agriculture, logging, construction) Fertilizers Animal waste Septic tanks Wastewater treatment
 Sediment (agriculture, logging, construction) Fertilizers Animal waste Septic tanks Wastewater treatment")
10
Aquatic phosphorus cycle: Animal tissue Plant tissue Water: Dissolved inorganic P (DIP) Dissolved / Particulate Organic P (POP, DOP) Bacterial tissue Lake Sediment Phosphate- bearing rock
 Dissolved / Particulate Organic P (POP, DOP) Bacterial tissue Lake Sediment Phosphate- bearing rock")
11
Phosphorus in water occurs in many mineral forms and in biological material Dissolved total phosphorus inorganic + organic Orthophosphate (orthophosphate = PO 4 ) inorganic Total phosphorus = all phosphorus in water dissolved and particulate, inorganic and organic
 inorganic Total phosphorus = all phosphorus in water dissolved and particulate, inorganic and organic")
12
Dissolved Total Phosphorus Filter the sample in the field, test for total P in filtered sample Total Particulate Phosphorus Subtract that amount from total P Dissolved (<.45 um): Phosphate ions (PO4) Organic molecules Other? Particulate (>.45 um): Mineral Organic Total Phosphorus (TP) = all phosphorus in the field sample (“digest” entire sample)
: Mineral Organic Total Phosphorus (TP) = all phosphorus in the field sample ( digest entire sample).")
13
Inorganic P: digest away organic phosphorus, test the remaining sample Organic P: subtract Inorganic P from total Organic: phosphorus incorporated into plant or animal materials phosphorus in organic molecules Inorganic: mineral forms phosphate ions (PO4) poly-phosphates Phosphorus can also be divided into organic and inorganic fractions
 poly-phosphates Phosphorus can also be divided into organic and inorganic fractions")
14
Phosphorus forms source, transport and fate Particulate forms May be very abundant in sediments. Impact on water quality depends on local conditions. Dissolved forms are more biologically “available”. Phosphorus may be extremely soluble under certain chemical conditions (high pH, low oxygen) but comes out of solution in presence of iron, aluminum, magnesium, calcium in soil
 but comes out of solution in presence of iron, aluminum, magnesium, calcium in soil.")
15
Phosphate ion (PO 4 3- ) is the form utilized by plants (AKA: Orthophosphate, Soluble Reactive Phosphorus) Highly reactive, usually very low free concentrations Reacts with iron oxides, calcium, mg, aluminum
 is the form utilized by plants (AKA: Orthophosphate, Soluble Reactive Phosphorus) Highly reactive, usually very low free concentrations Reacts with iron oxides, calcium, mg, aluminum")
16
Vertical distribution of oxidized and reduced conditions in lake sediments (Mortimer, 1942) Depth (cm) “Old” paradigm: (Mortimer 1942) Redox condition of sediments controls P release pH affects phosphate adsorption with Fe(OH) 3
 Depth (cm) Old paradigm: (Mortimer 1942) Redox condition of sediments controls P release pH affects phosphate adsorption with Fe(OH) 3")
17
We now understand that soluble versus particulate phosphorus may be controlled be chemical make-up of sediments and inflow water. Dominance of one form over another depends on rates, mixing, residence times. Oxygen concentration of sediments and overlying water– Controlled by iron, aluminum compounds Microbial decomposition of organic bound P Dissolution of calcium-bound or manganese bound P pH of water Temperature

18
Epilimnetic phosphorus settles into hypolimnion where it is transformed further and may increase due to sediment release. When lakes turn over, phosphorus is mixed back into entire water column

19
Variability in phosphorus in natural waters: Higher concentrations of TP during high flows (associated with high sediment) Biologically available forms may be extremely low during growing season Daily and seasonal fluctuations in DO, pH may result in fluctuations of some forms of phosphorus Extent of internal loading in reservoirs and lakes.
 Biologically available forms may be extremely low during growing season Daily and seasonal fluctuations in DO, pH may result in fluctuations of some forms of phosphorus Extent of internal loading in reservoirs and lakes.")
20
Nitrogen Cycle

21
Natural nitrogen sources: Fixed atmospheric nitrogen lightning biologically mediated Decomposition of organic materials Human nitrogen sources Synthetic fertilizers Nitric and nitrous oxides in atmosphere (from burning fossil fuels) Animal waste Septic tanks Wastewater treatment
 Animal waste Septic tanks Wastewater treatment")
22
Nitrogen is found in different inorganic forms Ammonia/ Nitrite Nitrate Nitrogen gas Nitrous oxide Ammonium (NH 3 )(NO 2 - ) (NO 3 - )(N 2 )(N 2 O) (NH 4 + ) Very soluble Move rapidly through soils into groundwater Nitrate / nitrite can be toxic at high concentrations Ammonia toxicity depends on pH and temperature and how long fish are exposed.
(NO 2 - ) (NO 3 - )(N 2 )(N 2 O) (NH 4 + ) Very soluble Move rapidly through soils into groundwater Nitrate / nitrite can be toxic at high concentrations Ammonia toxicity depends on pH and temperature and how long fish are exposed.")
23
Nitrogen cycle: Animal (Proteins) Plants (proteins) Water: NO 3 and NH 3 Soils (clay surfaces) Detritus and Manure: Organic N and NH 3 Atmospheric N: N 2, N x O, and NH3 Nitrogen Fixation N 2 NH 3 (aerobic bacteria) Nitrification NH 3 NO 2 NO 2 - NO 3 (aerobic bacteria) Denitrification NO 3 N 2 O or N 2 (anaerobic bacteria)
 Plants (proteins) Water: NO 3 and NH 3 Soils (clay surfaces) Detritus and Manure: Organic N and NH 3 Atmospheric N: N 2, N x O, and NH3 Nitrogen Fixation N 2 NH 3 (aerobic bacteria) Nitrification NH 3 NO 2 NO 2 - NO 3 (aerobic bacteria) Denitrification NO 3 N 2 O or N 2 (anaerobic bacteria)")
24
Nitrogen often described according to common chemical tests: Nitrate + nitrite (NO3 + NO2) Ammonia (NH3) Total Kjeldahl Nitrogen (TKN) = organic N + ammonia nitrogen Total Nitrogen = TKN + Nitrate + Nitrite
 Ammonia (NH3) Total Kjeldahl Nitrogen (TKN) = organic N + ammonia nitrogen Total Nitrogen = TKN + Nitrate + Nitrite")
25
Other common “fractions” of nitrogen Oxidized nitrogen = nitrate + nitrite Inorganic nitrogen = oxidized nitrogen + ammonia Organic nitrogen = TKN – ammonia Total nitrogen = TKN + oxidized nitrogen

26
Variability in nitrogen concentrations in natural waters May have higher concentrations of TN during high flows (associated with runoff) Generally ammonia and nitrite very low in unpolluted waters Nitrate may decline during growing season BUT DIN may increase in concentration during base flow Toxic forms of ammonia (NH3+) may vary due to daily and seasonal fluctuations in pH and temperature
 Generally ammonia and nitrite very low in unpolluted waters Nitrate may decline during growing season BUT DIN may increase in concentration during base flow Toxic forms of ammonia (NH3+) may vary due to daily and seasonal fluctuations in pH and temperature")
27
PhosphorusNitrogen Geochemical CyclingSlowFast Human-caused sourcesHuman /animal waste, fertilizer, sediment Human/animal waste, fertilizer, burning fossil fuels Gaseous form?NoYes Soluble forms Orthophosphate Dissolved organic Nitrate / nitrite / ammonia Movement through soil / groundwater? Often noYes Atmospheric deposition?DustNOx, Ammonia Toxic?NOSome forms Causes eutrophication?Yes Limiting nutrient?Sometimes

28
Impacts of Excess Nutrients

29
Problems caused by oxygen depletion Loss of fish and other aquatic life Enhanced phosphorus release from sediments

30
Problems caused by excess plants Loss of aesthetic value Loss of recreational value Loss of fish habitat University of Michigan photo

31
Harmful algal blooms Toxicity Liver toxins Neurotoxins Rashes

32
Drinking water impacts – surface water sources (1986,1987 average water use, figure from UDNR)
")
33
Bob Clement, EPA Region 8 Drinking water treatment issues

34
Nitrates in groundwater (1986,1987 average water use, figure from UDNR) Blue baby syndrome At concentrations above above 10 ppm Young ruminants and other livestock also susceptible
 Blue baby syndrome At concentrations above above 10 ppm Young ruminants and other livestock also susceptible")
35
Ammonia toxicity Ammonium (ionized) form is not toxic fish Unionized form is very toxic Ratio of the two depends on pH and temperature Reef Central http://www.reefcentral.com/forums/index.php?s=
 form is not toxic fish Unionized form is very toxic Ratio of the two depends on pH and temperature Reef Central s=")
36
Eutrophication –ecosystem effects

37
Zooplankton may be selective grazers diatoms, green algae more edible algae Cyanobacteria (blue green algae) – less edible – may be in large colonies, gelatinous, toxic
 – less edible – may be in large colonies, gelatinous, toxic")
38
Phosphorus impacts – Nutrient concentrations, algal abundance (Chl a) and water transparency
 and water transparency")
39
Sewage diverted Limnology and Oceanography, 1981 The Lake Washington Story http://www.kingcounty.gov/envi ronment/waterandland/lakes/http://www.kingcounty.gov/envi ronment/waterandland/lakes/lak es-of-king-county/lake- washington/lake-washington- story.aspx

40
Industrial scale fixation of atmospheric N to ammonia Today, this process responsible for deeding ~ 1/3 of earth’s population. Process consumes ~ 1% of world’s energy use On average 50% of nitrogen in human body is synthetic Haber-Bosch process

41
1 kg N /ha = 100 mg/m 2 Estimated total reactive nitrogen deposition from the atmosphere (wet and dry) – early 1990s. Biggest increases in industrialized nations – automobile exhaust, agricultural fertilization, other sources www.cbd.int/doc/gbo2/cbd-gbo2.pdf

42
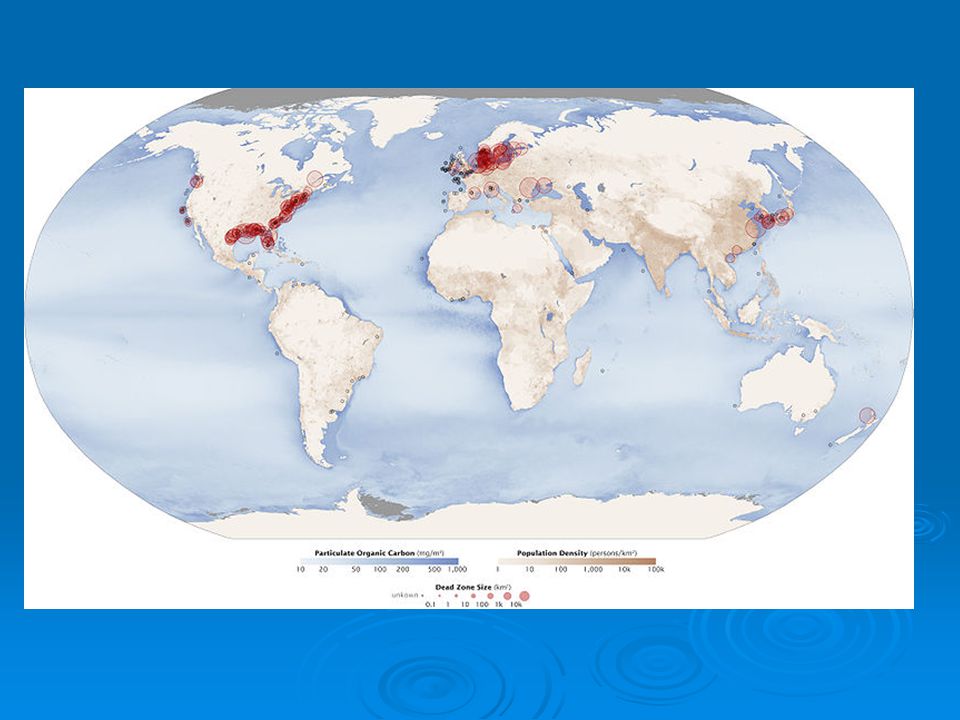
Nitrogen impacts - Drainage from Mississippi River Basin Hypoxia Zone in Gulf of Mexico

43
Areal extent of Gulf of Mexico bottom water hypoxia Mississippi River nitrates at St. Francisvile... Nitrate-N (mg/liter) __ Nitrate_N flux (million MT/yr) Estimated nitrogen fertilizer use in the Mississippi River Basin Estimated land drainage in Mississippi River Basin 1900 1920 1940 1960 1980 2000 From USDA 1987, Goolsby et al 1999, Rabalais et al 1999
 __ Nitrate_N flux (million MT/yr) Estimated nitrogen fertilizer use in the Mississippi River Basin Estimated land drainage in Mississippi River Basin From USDA 1987, Goolsby et al 1999, Rabalais et al")
45
Humans are adding 125 MT/Year to N Cycle Total addition to terrestrial regions is 390 MT/Year Total denitrification is 317 MT /Year By one estimate, balance could be reached by reducing human additions to 52 MT/Year

47
Controlling nutrients – Which nutrient? What sources?

48
Directly Measuring Nutrient Limitation Whole-lake bioassay: Lake 226 in Canadian Experimental Lakes Area http://www.umanitoba.ca/institutes/fisheries/226curt.jpg Added N + C N + P + C Schindler concluded that P limited algal growth in Lake 226 Lake 226 North Lake 226 South

49
P-limitation and N-Fixation Schindler’s argument David Schindler argued that N should never be limiting, because if it were, then N-fixing cyanobacteria would invade and fix readily available nitrogen gas (N 2 ) into ammonia: N 2 + energy (photosynthesis) NH 3
 into ammonia: N 2 + energy (photosynthesis) NH 3")
50
Bottle/or Microcosm Nutrient addition bioassays for assessing nutrient limitation

51
Elser, J.J. et al. 2007. Nitrogen and phosphorus limitation of primary producers in freshwater, marine and terrestrial ecosystems. Ecol. Letters 10:1-8. Response Ratio Meta-analysis of hundreds of bioassays

52
Regional Differences in N vs P limitation

53
3 general approaches for managing nutrient loading Reduction in nutrient inflow Reduction in nutrient inflow

54
Approaches for Managing Nutrient Loading Disruption of internal nutrient cycles Disruption of internal nutrient cycles

55
Approaches for Managing Nutrient Loading in aquatic systems Acceleration of nutrient outflow Acceleration of nutrient outflow

57
Vollenweider loading model Sedimentation rate, r s ≈ r f 0.5 (unitless) Hydraulic flushing r f ≈ outflow volume / Lake volume (unitless) But see: Brett, MT & MM Benjamin. 2008. A review and reassessment of lake phosphorus retention and the nutrient loading concept. Freshwat. Biol. 53: 194-211

58
Tropic State Index (TSI) Carlson (dipin.kent.edu/tsi.htm) Continuous index from 0-100 based on either: Chlorophyll Secchi depth TP
 Carlson (dipin.kent.edu/tsi.htm) Continuous index from based on either: Chlorophyll Secchi depth TP")
59
Defining Eutrophication Arbitrary scales

61
Run thru an example of loading model / vollenweider… In class.

62
Phosphorus criteria in Utah : Although TMDLs are site specific, often…. 0.05 mg/liter probably will be stream concentration end point 0.025 mg/liter probably will be lake concentration end point With no TMDL, these concentrations are “indicators” Relationship between TP and algae holds in many regions In Utah, probably over-estimates “bioavailable” phosphorus

63
Nitrogen criteria in Utah : Ammonia Criteria established for specific pH and temperature conditions Nitrate No criteria set for most uses Indicator concentration of 4 mg/liter Nitrate drinking water source criteria = 10 mg/liter

65
Nitrogen cycle: Animal (Proteins) Plants (proteins) Water: NO 3 and NH 3 Soils (clay surfaces) Detritus and Manure: Organic N and NH 3 Atmospheric N: N 2, N x O, and NH3 Nitrogen Fixation N 2 NH 3 (bacteria) Nitrification NH 3 NO 2 NO 2 - NO 3 (aerobic bacteria) Denitrification NO 3 N 2 O or N 2 (anaerobic bacteria)
 Plants (proteins) Water: NO 3 and NH 3 Soils (clay surfaces) Detritus and Manure: Organic N and NH 3 Atmospheric N: N 2, N x O, and NH3 Nitrogen Fixation N 2 NH 3 (bacteria) Nitrification NH 3 NO 2 NO 2 - NO 3 (aerobic bacteria) Denitrification NO 3 N 2 O or N 2 (anaerobic bacteria)")
66
Transformations: Physical processes: sorption of ammonia to organiz and inorganic forms Volatilization Microbial processes: Ammonification: transofrmation of organic nitrogen to ammonia (2st step of mineralization) Can occur both aerobically and anaerobically. Nitrification of ammonia: principle transformation mechanism – reduces 2 step process: Ammonium + Oxygen and Nitrosomonas (hetertrophic bacteria) Nitrite Nitrite + oxygen and Nitrobacter nitrate.
 Nitrite Nitrite + oxygen and Nitrobacter nitrate..")
67
$$$ Costs?? $$$ Prevention is always cheaper than treatment Value of fisheries and recreation Drinking water treatment New wells, sources of groundwater Health impacts

68
Eutrophication Causes: Increased nutrient availability

70
Eutrophication Interactions Increase P & N Loading Algal Growth Hyplimnetic Deoxygenating – Zooplankton Refuge Loss of cold-water fish habitat – – Zooplankton Size – % Colonial Cyanobacteria (cyanotoxins) + Anoxic Nutrient Release + + Fish + Zooplankton Grazing – + – + Sedimentation Rate + Macrophytes & Periphyton – Transparency – +
 + Anoxic Nutrient Release + + Fish + Zooplankton Grazing – + – + Sedimentation Rate + Macrophytes & Periphyton – Transparency – +")
73
Eutrophication issues in Farmington Bay and the Great Salt Lake Beneficial Use Designation Farmington Bay Aquatic Wildlife Brine shrimp Brine flies Birds Contact Recreation Swimming Hunting Public health Odors

74
Nutrient loading of one million+ people from WWTP to the shallow bay is extremely high, with predictions of hypereutrophic conditions P Loading ( mg P m -2 yr -1 )
")
75
Eutrophication High nutrient loading produces excessive algal growths At salinities < 5%, a large portion of the algal biomass is often composed of toxic cyanobacteria (blue-green algae), Nodularia spumigena http://www.cdc.gov/hab/cyanobacteria/default.htm
, Nodularia spumigena")
76
Although it is not on the Utah’s 303d list of impaired waters, Farmington Bay is the most eutrophic water body in the State of Utah. Algal densities in Farmington Bay are extreme. The chlorophyll concentration in Farmington Bay in 2005 (270 μg/L; red star) was higher than 750 lakes studied world-wide to relate phosphorus levels to chlorophyll. Farmington Bay IS “off-the-chart”
 was higher than 750 lakes studied world-wide to relate phosphorus levels to chlorophyll. Farmington Bay IS off-the-chart .")
77
Harsh chemical environment Anoxia (diel; several days) Toxic ammonia concentrations. >> EPA criteria by 50-400%.

78
Cyanotoxins from the abundant Nodularia in Farmington Bay are hepatotoxins and tumor promoters. Cyanotoxins accumulate in ducks and advisories for eating ducks have been suggested for countries boarding the Baltic Sea (Sipia et al. 2006) Farmington Bay is not safe for swimming! The Capital Times, Madison Sept. 6, 2003 World Health Organization Moderate Health Effects (20 ug/L) Mild Health Effects (2-4 ug/L) Human Health Harmful Algal Blooms (HABS)
 Farmington Bay is not safe for swimming. The Capital Times, Madison Sept. 6, 2003 World Health Organization Moderate Health Effects (20 ug/L) Mild Health Effects (2-4 ug/L) Human Health Harmful Algal Blooms (HABS).")
79
Health effects of contact during recreation (no ingestion): “Effects of skin irritation, skin rash, as well as vomiting, diarrhea, cold/flu symptoms, mouth ulcers and fever” at above 5,000 cyanobacterial cells per ml” (World Health Organization 2003). Cyanobacterial cells in Farmington Bay have exceeded this level >100-fold. Farmington Bay and the Bridger Bay Swimming Beaches Are Not Safe Waters from Farmington Bay impact Bridger Bay swimming beach. A rash (somewhat less intense than photo) was viewed on a child playing in water near Bridger Bay that had overflow waters from Farmington Bay (May 2005). These rashes, although severe, are not life-threatening and affect 10-20% of population (Pilotto et al. 2004).
 was viewed on a child playing in water near Bridger Bay that had overflow waters from Farmington Bay (May 2005). These rashes, although severe, are not life-threatening and affect 10-20% of population (Pilotto et al. 2004)..")
80
Farmington Bay Eutrophication ‘Spilling” into Gilbert Bay MODIS Satellite Image (30 May 2006) FarmingtonBay SLC
 FarmingtonBay SLC")
81
Causes: Increased nutrient availability Non-Point Sources Atmospheric deposition of nitrogen Atmospheric deposition of nitrogen Atmospheric deposition has increased markedly in industrialized countries from automobiles exhaust, agricultural fertilization and other sources

Similar presentations