Download presentation
Presentation is loading. Please wait.

1
Sean Deinert and Sean Hodges GDM International Services, Inc. - Middleburg, VA LTC 2013

2
Catalhöyük, Turkey 6200 BCMap of Babylon ca. 900 BCMediterranean Sea Chart 1320 ADDutch Map of the World 1689 ADNew Orleans East USGS Quadrangle Map 1992

3
Collection takes time Production takes time Updating is outpaced by real change Inconsistent updating leads to inconsistencies Costs to update outweigh benefit of the update

4
As lines cross map boundaries they do not meet their counterpart on the next map.

6
USGS maps are comprised of seven “framework themes” (water, elevation, transportation, boundaries, benchmarks, vegetation, and structures). USGS did not update all themes simultaneously. On this map, USGS has not updated the hypsography theme. So, the old elevation contours (brown) lie in the updated water (blue). The thick red lines show the photo-revised shoreline and other water features from the 2004 orthophotos.
 lie in the updated water (blue). The thick red lines show the photo-revised shoreline and other water features from the 2004 orthophotos..")
8
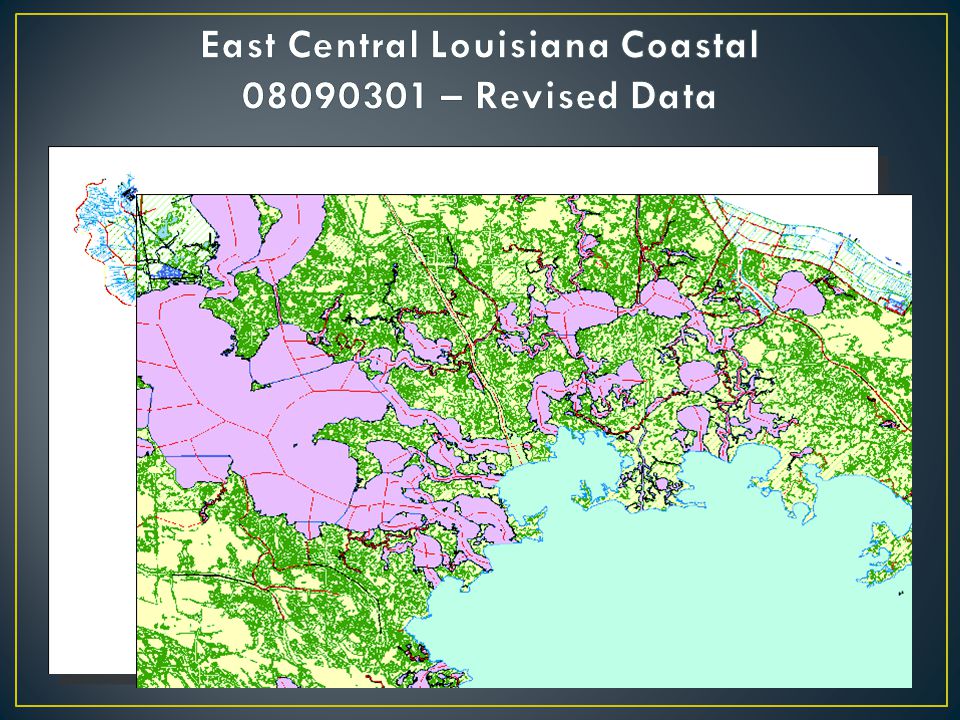
The yellow lines are where best-available digital data show the land-water boundary. The image is post hurricane orthophotography. Neither match the maps.

10
All paper maps are 5 years or older 98% of paper maps are 10 years or older 81% of paper maps are 15 years or older 62% of paper maps are 20 years or older 38% of paper maps are 25 years or older The Catahoula Quad is 113 years old!

11
1928 – Act 159 of 1928 establishes topographic mapping authority 1928 – Act 159 of 1928 establishes topographic mapping authority 2000 – The USGS ceases Topographic Map Program 2000 – The USGS ceases Topographic Map Program 2002 – The National Map becomes USGS mapping priority 2002 – The National Map becomes USGS mapping priority 2007 – USGS announced that it had no further work to complete in Louisiana 2007 – USGS announced that it had no further work to complete in Louisiana Aug. 2007 – DOTD partners with GDM International Services Inc to provide topographic mapping services for the State. Aug. 2007 – DOTD partners with GDM International Services Inc to provide topographic mapping services for the State. 2007 - The Louisiana Seamless GIS Basemap Project begins with 4 main goals: 2007 - The Louisiana Seamless GIS Basemap Project begins with 4 main goals: Denote and acquire “best available” digital data from Local, State, and Federal sources Denote and acquire “best available” digital data from Local, State, and Federal sources Assess, revise, and compile sources into Seamless GIS Basemap Assess, revise, and compile sources into Seamless GIS Basemap Update National Hydrography Dataset watershed within project area Update National Hydrography Dataset watershed within project area Create USGS-like Topographic Maps for distribution Create USGS-like Topographic Maps for distribution 2010 – Act 782 of 2010 establishes La. R. S. 48:36 Topographic Mapping 2010 – Act 782 of 2010 establishes La. R. S. 48:36 Topographic Mapping

12
Develop and maintain a statewide digital geospatial database Develop and maintain a statewide digital geospatial database Act as authority for geographic names Act as authority for geographic names Set standards for the mapping of topographic features Set standards for the mapping of topographic features Plan and manage data collection for incorporation into a statewide database Plan and manage data collection for incorporation into a statewide database Promulgate rules and regulations… as are necessary for the planning and managing of the geospatial data. Promulgate rules and regulations… as are necessary for the planning and managing of the geospatial data.

13
Support the geospatial information and technology requirements of LADOTD, Louisiana, and all other GIS users Meet the “AAAAA” Data Standard – Accurate – Authoritative – Actionable – Accessible – Affordable Establish and implement geospatial data standards, provide data access, management, and distribution

14
FactorContribution to Data Quality AccurateThe data adequately represents the state of the world in space and time. Locations have sufficient precision for their scale of use and data are current. AuthoritativeThe source of the data provides sufficient quality control to ensure its veracity and reliability. ActionableThe data are well documented with metadata, require little further assessment or manipulation, and can be put to immediate use. AccessibleThe data are discoverable and available through direct download or Service Oriented Architecture (SOA). Data can be searched directly, selected, and accessed without intervention by its provider. AffordableThe data can be accessed with little or no cost to the user.
. Data can be searched directly, selected, and accessed without intervention by its provider. AffordableThe data can be accessed with little or no cost to the user..")
15
Lakeshore Drive, Baton Rouge 1998 Lakeshore Drive, Baton Rouge 2004 Lakeshore Drive, Baton Rouge 2005 Lakeshore Drive, Baton Rouge 2008 Lakeshore Drive, Baton Rouge 2010 1:1,000 scale

16
BLM, Census, State Data Orthophotography LiDAR USGS NHD Census, State Data BLM, Census, State Data USGS Quads, DOQQ GNIS, Local Data Traditional Basemap Sources Land Use Vegetation Contours Hydrography Transportation Boundaries Structures Annotation LA Seamless Database New Digital Database Format

17
1998 Lower Vacherie Quad USGS 7.5’ Quadrangle Features marked Street locations Building locations What kind of school? What type of student body? Where is the school located?

18
2009 Lower Vacherie Quad LA DOTD 7.5’ Quadrangle Features marked Street locations Building locations Lower Vacherie Elementary School Public, Pre-K - 8 13440 Highway 644, Vacherie, LA Julie Dauzat, Principal

19
Cartographic Representation Fixed. Data interpreted by a cartographer for presentation at a single scale. BoundaryDesigned to a particular presentation and end at an edge. Creates edge-matching issues. Paper maps don’t match because of thematic and temporal differences. ContentFixed. Contents cannot change with time or be varied by the user for their purpose. Updating requires complete revision. Map revisions are not always vertically integrated. PresentationFixed. Only information presented on the map is available through symbology and labeling. No additional information is available to the user. What you see is what you get. – WYSIWYG. Storage and RetrievalTake up a large volume of physical space. Susceptible to damage and deterioration. Retrieval requires physical location, removal, and transport of the media. Field UseDo not require electricity. Can be easily marked up. Can be weather-proofed.

20
Cartographic Representation GIS data are stored as actual geometric features, but can be placed on the map using various cartographic representations, based on data. BoundaryDigital maps can utilize actual, surveyed, legal boundary data. The data are seamless and represent the boundary and the area it contains. ContentDynamic. Digital data can contain much more information than is displayed. All of that information is remains available to the user for searches, alternate presentations, and geoprocessing. PresentationDynamic. Multiple fields of data can be used to present a map in different ways, at the user’s discretion. Digital maps can be stored and presented via different mediums; print, web maps, mobile devices, etc. Storage and RetrievalAn entire atlas can be stored on a thumb drive. A single geodatabase can contain all map elements and can provide them seamlessly to anyone. Data are searchable and can be transported electronically. Field UseData can be brought into the field on mobile devices or pushed to remote users over a network or wirelessly. User maintains access to the data and their GIS tools, to use it. However, all this requires equipment and electricity that are not always available in the field.

22
Red features are from the NHD. Orange polygons are areas represented by NOAA as land in 1940 (most current data). These are now open water in the NHD.
. These are now open water in the NHD..")
23
First “Coastal Louisiana” experience – Pass Manchac

26
Old methods 60,000+ features revised 8 months+ to update and revise Manual table generation New Methods 31,000+ features revised ~5 months to update and revise Automated table generation

30
What does a high rate of foreclosures tell us? It may tell us that an area is overpriced, or needs help bringing new financing options to entice homebuyers. Areas high in foreclosures or other vacancies may be areas to monitor more closely, in an effort to reduce potential crime. If the local economy is struggling, where can we best focus our resources? Foreclosures tend to be in disrepair. Poor curb presence decreases property values around the foreclosures themselves, further creating problems. Lower property values = Economic stagnation. Agencies involved:

31
Which areas are still to be rebuilt? What problems exist? Potential crime Losing ground, and it’s effects: Agencies involved: Health hazards Hurting industry Affect the natural ecosystem of the State Affect transportation routes, and State economy as a result Loss of land invites further disaster

32
The Basemap Outdated basemaps are not doing anyone any favors. The maps are decades beyond their usefulness and need to be supplanted with newer technology Converting traditional paper-based maps to computer-based GIS makes sense, both financially and in terms of potential usefulness GIS seamless databases give us the opportunity to be freed from the grips of the traditional “quad” map Enhancements Using data that your agencies are already collecting, we can incorporate them into the new basemap and create new analyses By combining information between agencies we can save TIME and MONEY

Similar presentations


>")


 Fundamentals for Program Managers.>")


