Download presentation
Presentation is loading. Please wait.

1
North Santiam School District State Report Cards 2009-10

2
History 1999 Oregon Legislature enacted ORS 329.105 requiring that the Oregon Department of Education produce and issue annual report cards for all schools and districts. 2001Oregon SB 811 mandated additional requirements for the school and district report cards. In January 2002, Federal “No Child Left Behind” legislated specific requirements for schools and districts that led to changes in 2003-2004 2007 Oregon HB 2263 made additional changes to the requirements for the school and district report cards.

3
State Purpose providing an opportunity to communicate and celebrate initiating discussions about areas targeted for improvement demonstrating that schools are accountable, directly to parents and community members

4
Goals Tonight Communicate District and School Report Card results Understand how the State reaches the overall school rating Have a greater understanding of the danger of comparing schools in the same District

5
Frequently Asked Questions Who: – All schools that meet the definition of public How is it different from Adequate Yearly Progress? – Report Card is primarily based on performance and improvement over time – Subgroups are combined as a whole – Doing well in one area can compensate for challenges in another – The District does not receive a rating

6
Frequently Asked Questions Extended Assessments: – Counted as not meeting standards Who is tested? – All Students (except first year Limited English Proficient Students) – English / Language Arts and Math: Grades 3 through 8 and High School – Writing Grade 4,7 and High School
 – English / Language Arts and Math: Grades 3 through 8 and High School – Writing Grade 4,7 and High School.")
7
Reporting Released: – October 7, 2010 To parents by: – January 15, 2011

8
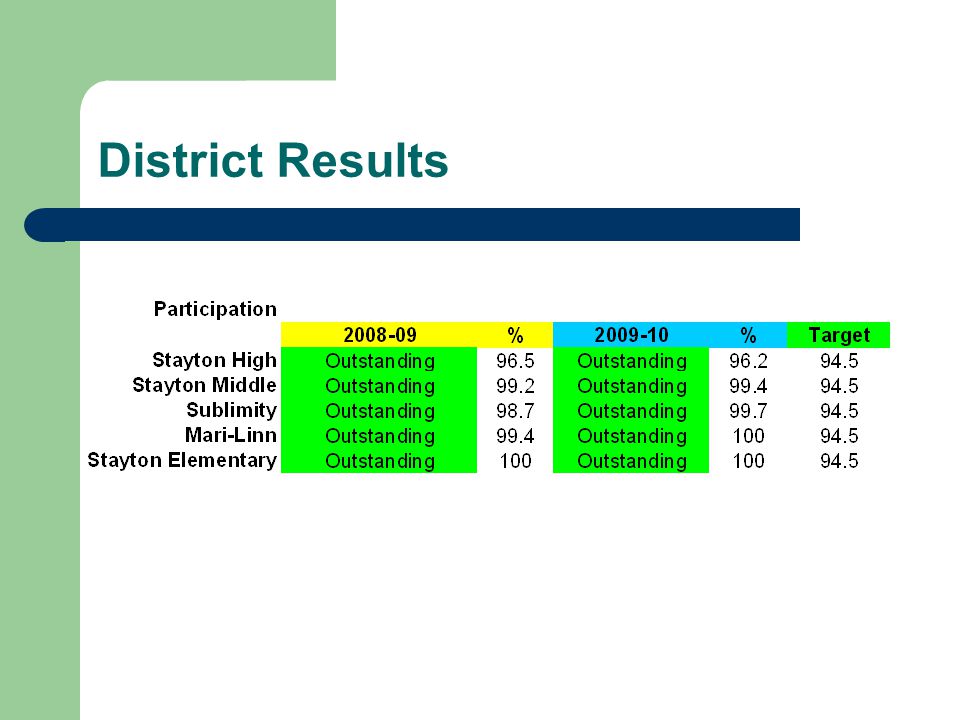
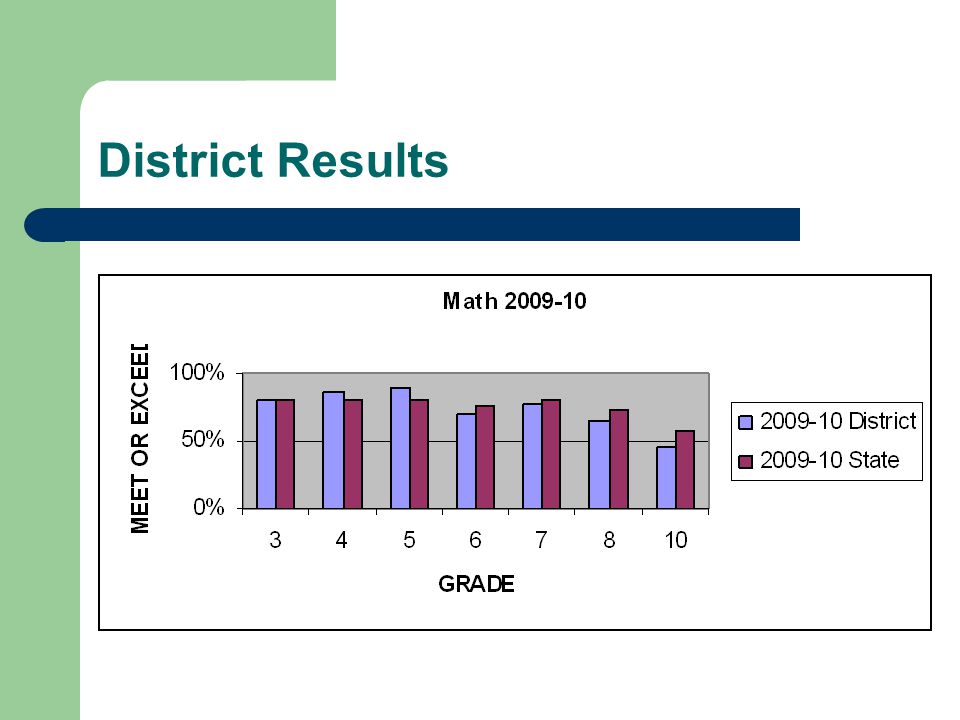
District Results

9
Strength Indicator Areas highlighted in green are strengths. – At or above state or comparison school scores

10
District Results

19
The Sample Report Card School At A Glance – Student Population – Staffing – Class Size – Attendance – Expulsion for weapons – Test Participation

20
The Sample Report Card Achievement Data – Academic Achievement Last two school years shown District, state and comparison schools are displayed – Improvement in Student Performance Student who exceeded, met or reached growth target are compared

21
The Sample Report Card Statewide Assessment Results – Student Achievement Statewide Assessment results are displayed for the student groups required by the No Child Left Behind Act. – Student Participation Percentages of students in the school who participated in Assessments in Reading, Math, and Science. Students who were absent, refused to be tested or had a written refusal are included in the percentage not tested.

22
The School Rating Calculation Combination of: – Achievement Index (In need of Improvement, Satisfactory, Outstanding) O-50 / 50-79.9 / 80 or higher – Attendance Rate – Participation Rate – Graduation Rate / Improvement Data @ High School – Adequate Yearly Progress status *The overall rating is based on the Achievement Index. It is reduced to the lowest rating of (Attendance, Graduation, Participation) *If Adequate Yearly Progress is Met, the Rating cannot be lower than Satisfactory
 *If Adequate Yearly Progress is Met, the Rating cannot be lower than Satisfactory.")
23
The School Rating Calculation Achievement Index (Weighted Counts) – Weighted formula: More weight is given for students who exceed vs. meets or meets growth – For Example (Exceeds is multiplied by 133 and Meets or Growth by 100) Extra weight is given for students in disadvantaged subgroups. – (This is how the State holds schools accountable to focus on these students)
 Extra weight is given for students in disadvantaged subgroups. – (This is how the State holds schools accountable to focus on these students).")
24
The School Rating Calculation Achievement Index (Calculation) – Two year total of Reading index / 2 = (RI) – Two year total of Math index / 2 = (MI) – Added together then / 2 – ((RIp+RIc)/2 + (MIp+MIc)/2) / 2
 – Two year total of Reading index / 2 = (RI) – Two year total of Math index / 2 = (MI) – Added together then / 2 – ((RIp+RIc)/2 + (MIp+MIc)/2) / 2")
25
Example

26
The School Rating Calculation Attendance Rate (will lower rating) – Two year average Participation Rate (will lower rating) – One year total Graduation Rate (will lower rating) – Two year average Improvement Data @ High School Only – Increasing Performance Index by 5 or higher raises the Achievement index one category (explains how the High School received an Outstanding Rating) Adequate Yearly Progress
 – Two year average Participation Rate (will lower rating) – One year total Graduation Rate (will lower rating) – Two year average Improvement High School Only – Increasing Performance Index by 5 or higher raises the Achievement index one category (explains how the High School received an Outstanding Rating) Adequate Yearly Progress")
27
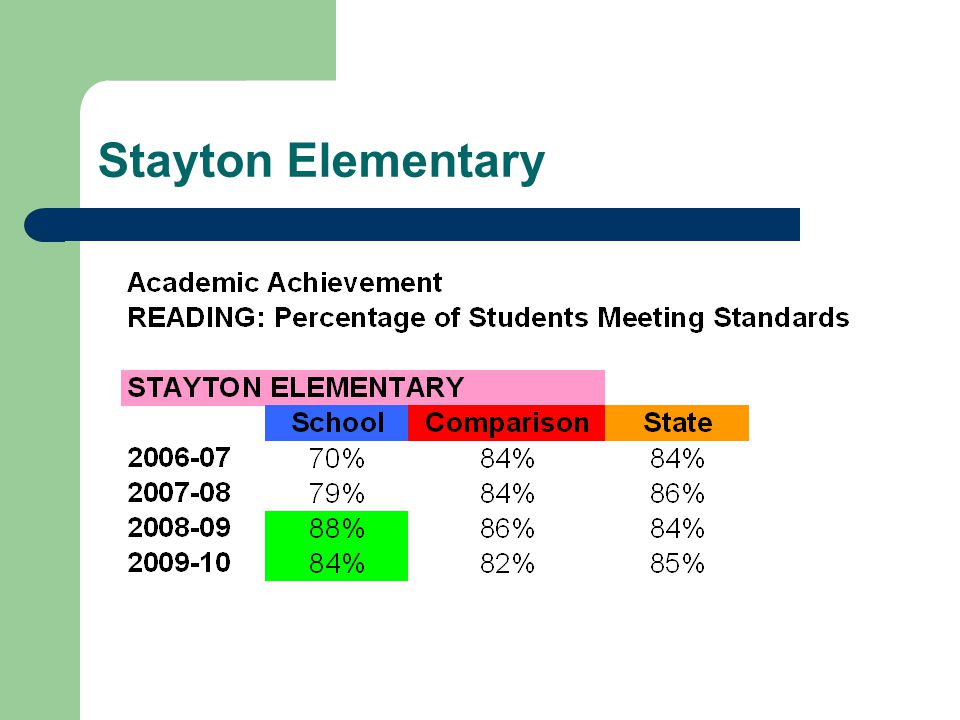
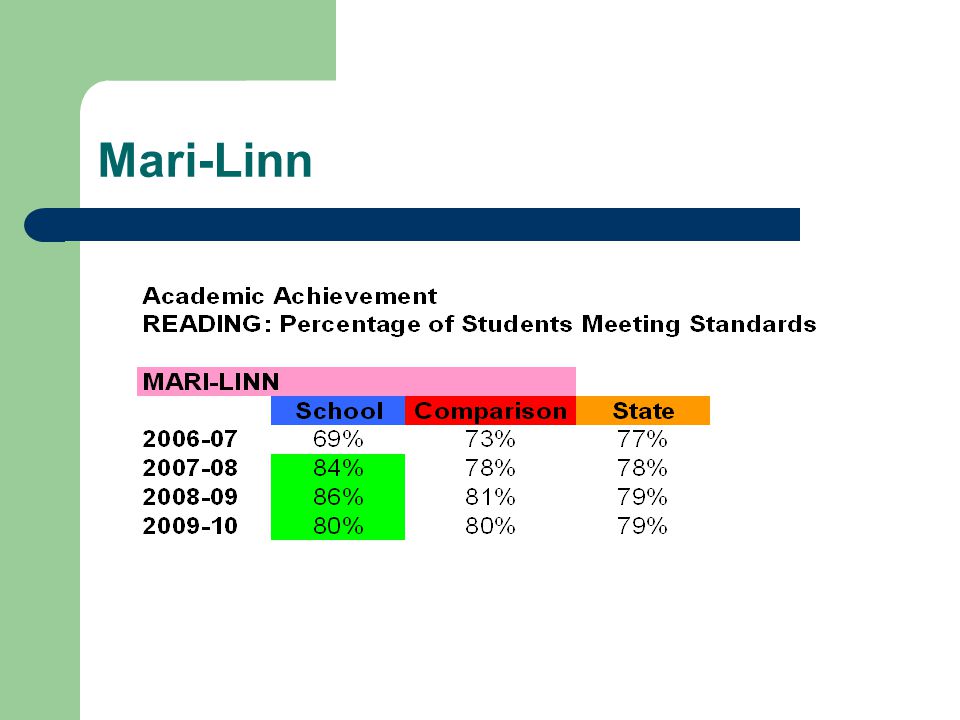
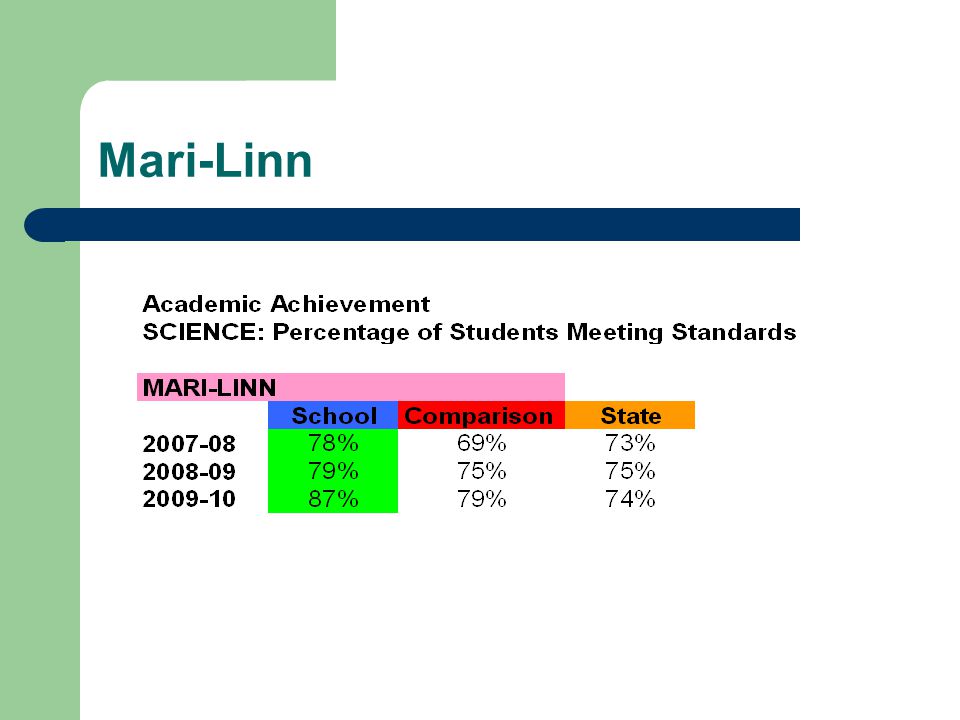
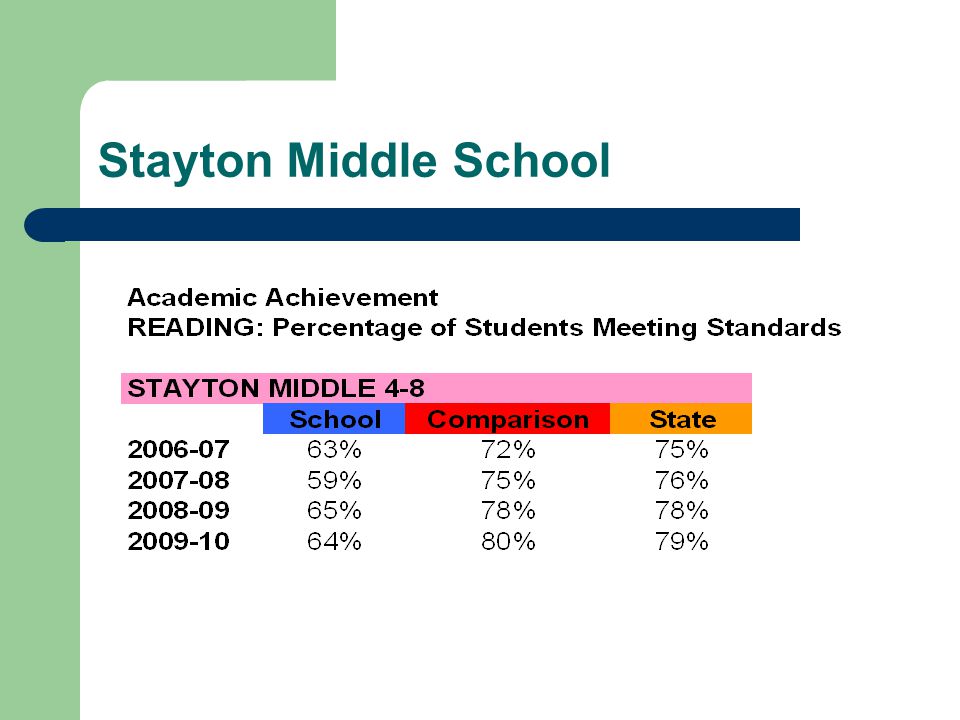
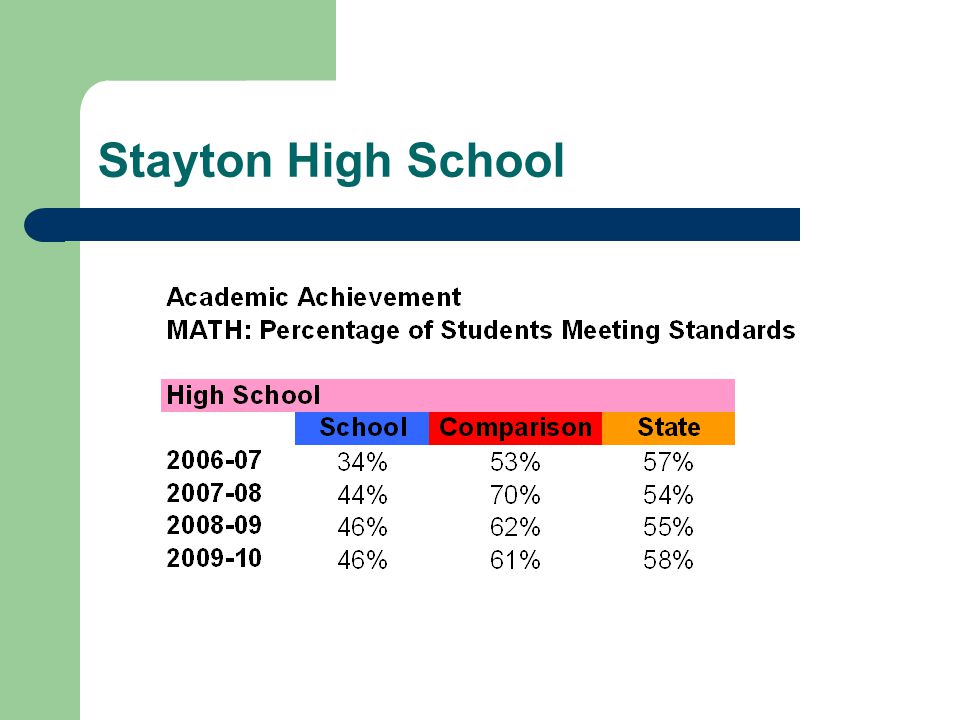
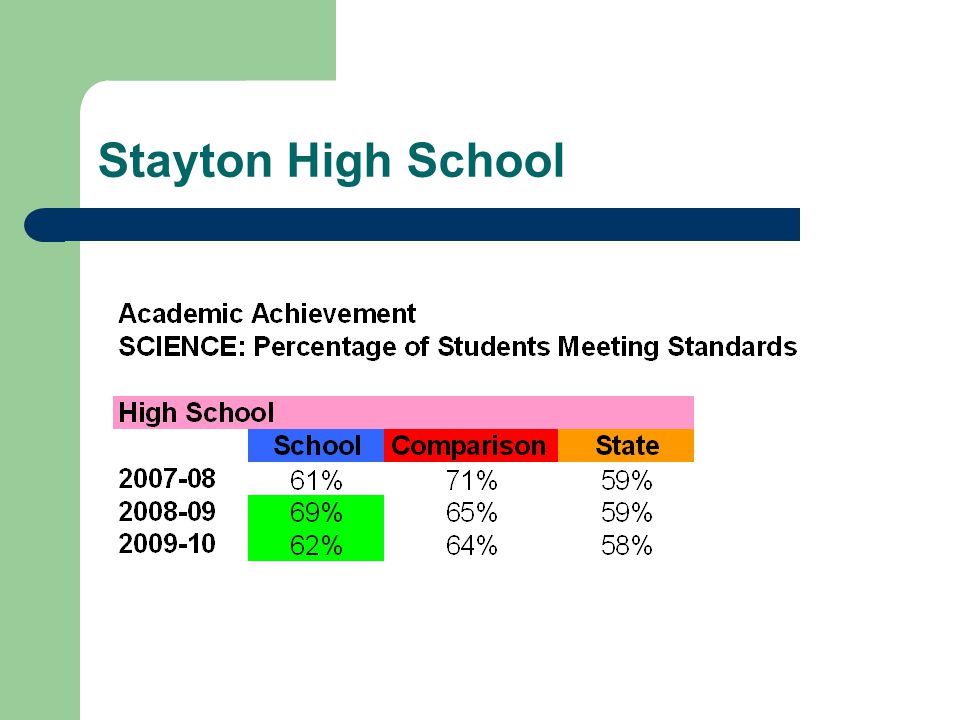
School Results Index Score Index Breakdown (results over time) Assessment Results (last 3 or 4 years) – Exceed and Met % compared to Comparison Schools and State
 Assessment Results (last 3 or 4 years) – Exceed and Met % compared to Comparison Schools and State")
28
Stayton Elementary

32
Mari-Linn

37
Sublimity

42
A Point to Make

43
Stayton Middle School

48
Stayton High School

54
End Questions Report Card Link – http://www.ode.state.or.us/data/reportcard/reports.aspx http://www.ode.state.or.us/data/reportcard/reports.aspx

Similar presentations


 U.S. Department of Education Adapted by TEA September 2003.>")


>")
 Clark County School District.>")


 & CAHSEE 2009-10 Results Update Prepared for the September 21, 2010 Board of Education.>")
