Download presentation
Presentation is loading. Please wait.

1
No Child Left Behind (NCLB) Adequate Yearly Progress (AYP) Know the Rules Track Performance Division of Performance Accountability
 Adequate Yearly Progress (AYP) Know the Rules Track Performance Division of Performance Accountability")
2
Purpose Review current AYP Rules and Calculations AYP and EDW AYP and Formative Assessment through The Princeton Review

3
All public schools, including Charter Schools Alternative Schools What schools are included in AYP?

4
Total Race/Ethnic Groups White (W) Black (B) Hispanic (H) Asian (A) American Indian (I) What are the groups?
 Black (B) Hispanic (H) Asian (A) American Indian (I) What are the groups")
5
Economically Disadvantaged English Language Learners (ELL) Students with Disabilities (SWD) What are the groups?
 Students with Disabilities (SWD) What are the groups")
6
Economically Disadvantaged Eligible for Free or Reduced-Price Lunch What are the groups?

7
English Language Learners (ELL) LY (currently active in program) and LF (up to 2 years monitoring after exit from program) What are the groups?
 LY (currently active in program) and LF (up to 2 years monitoring after exit from program) What are the groups")
8
Students With Disabilities Students with exceptionality other than gifted What are the groups?

9
Greater than or equal to 30 and at least 15% of total school population or At least 100 students in the subgroup count How many students are needed to calculate a groups proficiency?

10
95% What is the Participation Rate Target? S tudents in Survey 3 (February )
")
11
What is the proficiency rate target? Year Reading % Proficient Mathematics % Proficient 2001-023138 2002-033138 2003-043138 2004-053744 2005-064450 2006-075156 2007-085862 2008-096568 2009-107274 2010-117980 2011-1286 2012-1393 2013-14100 58 62 was now Students in Survey 2 (October) and Survey 3 (February)
 and Survey 3 (February).")
12
What is the writing proficiency rate target? All groups At least 90% of students earn a score of 3.0 points or greater or 1% improvement from previous year

13
What is the graduation rate target? High Schools only 85% or greater or 1% improvement from previous year

14
All students Students with FCAT scores or Alternate Assessments (SWD only) What students are included in AYP?
 What students are included in AYP")
15
What is considered proficient? FCAT & FAAR FCAT Reading and Math FCAT Writing FAAR Achievement Levels Level 3 and above Score 3 and above Level 3 and above

16
School Grade Participation Rate Graduation Rate Proficiency in Writing Reading Mathematics Safe Harbor Growth Model What are the components of the AYP Calculation?

17
School Grade Proficiency Target in both Reading and Math Participation Rate What are the components of the AYP Calculation? Writing & Graduation (HS) Criteria
 Criteria.")
18
Did each group not proficient meet Safe Harbor? Safe Harbor Did each group not meeting Safe Harbor meet the Growth Model? Growth Model Did the school meet the Writing & Graduation Criteria? Writing & Graduation (HS) Criteria Did each group meet Proficiency Target in both Reading and Math? Proficiency Target in both Reading and Math Did the school test 95% of every group? Participation Rate Did the school receive a D or F? School Grade AYP NOT MADE! MADE AYP! AYP NOT MADE! NO YES W&GW&G Did each group meet the Writing & Graduation Criteria? What are the components of the AYP Calculation? AYP NOT MADE! NO
 Criteria Did each group meet Proficiency Target in both Reading and Math. Proficiency Target in both Reading and Math Did the school test 95% of every group. Participation Rate Did the school receive a D or F. School Grade AYP NOT MADE. MADE AYP. AYP NOT MADE. NO YES W&GW&G Did each group meet the Writing & Graduation Criteria. What are the components of the AYP Calculation. AYP NOT MADE. NO.")
19
Percent Tested and Proficiency Levels How does it work?

20
Percent Tested and Proficiency Levels A school or school district makes AYP if 95% of each group is tested, and if each group meets the proficiency targets in reading and mathematics, and if the school-wide writing percent proficient and graduation rate increases.*

21
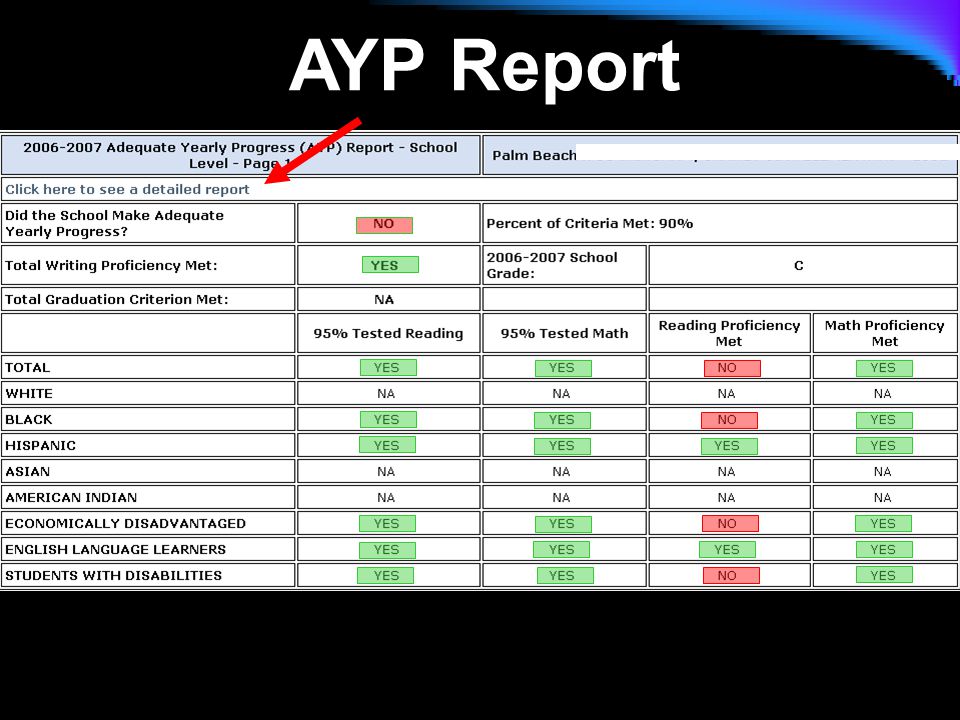
AYP Report

23
FY2007 Data with FY2007 Criteria Pct Tsted

24
FY2007 Data with FY2007 Criteria Pct Prof.

25
FY2007 Data with FY2007 Criteria Writing

26
AYP What I know? What I want to know? What I learned? % Tested & Proficiency Levels 1. Background 2.3.? Safe Harbor 4.?5. ?6. Growth Model 7.8.9.

27
SAFE HARBOR How does it work?

28
Safe Harbor Safe Harbor If group does not meet the proficiency target, but the % in group below proficiency target reduced by at least 10% from previous year, and group makes progress in writing proficiency and graduation rate.*

29
FY2007 Data with FY2007 Criteria < Grd Lvl: R Safe Harbor

30
FY2007 Data with FY2007 Criteria < Grd Lvl: M Safe Harbor

31
10% of 63 = 763-7= 56 Safe Harbor Reading 10% of 66 = 7 10% of 56 = 656-6= 50 66-7= 59 You try next three

32
10% of 63 = 763-7= 56 Safe Harbor Reading 10% of 66 = 7 10% of 62 = 7 10% of 56 = 6 10% of 81 = 9 10% of 56 = 656-6= 50 62-7= 55 56-6= 50 81-9= 72 66-7= 59

33
10% of 57 = 657-6= 51 10% of 53 = 653-6= 47 10% of 64 = 764-7= 57 Safe Harbor Math

34
Calculating FY2008 Safe Harbor % Below GroupFY2007FY2008 Total43? White Black47? Hispanic39? Asian Am. Ind. ED44? ELL45? SWD60?

35
Calculating FY2008 Safe Harbor % Below GroupFY2007FY2008 Total43? White Black47? Hispanic39? Asian Am. Ind. ED44? ELL45? SWD60? 38 10% of 43 = 5; 43-5= 38 42 35 39 40 54

36
Calculating FY2008 Safe Harbor % Below % Proficient GroupFY2007FY2008 Total433862 White Black474258 Hispanic393565 Asian Am. Ind. ED443961 ELL454060 SWD605446

37
AYP What I know? What I want to know? What I learned? % Tested & Proficiency Levels 1.2.3. Safe Harbor 4.5.6. ? Growth Model 7. ?8. ?9.

38
GROWTH MODEL How does it work?

39
GROWTH MODEL If any group does not meet the proficiency and safe harbor requirements, the percentage of students in that group who are on track to be proficient within three years meet criteria in reading and math, and that group must also make progress in writing proficiency and graduation rate.*

40
Grades 4-10 Students in Survey 2 (October) and Survey 3 (February) Students with prior year FCAT DSS Grade 3 Students in Survey 2 (October) and Survey 3 (February) First Time (no DSS available) Retained GROWTH MODEL Who is included in the GROWTH MODEL ?
 and Survey 3 (February) Students with prior year FCAT DSS Grade 3 Students in Survey 2 (October) and Survey 3 (February) First Time (no DSS available) Retained GROWTH MODEL Who is included in the GROWTH MODEL")
41
Proficiency within 3 years GROWTH MODEL How is the GROWTH MODEL trajectory determined?

42
FY 2007 Current Grade

43
DSS from FY 2006 (previous year) Base score for trajectory GROWTH MODEL How is the GROWTH MODEL trajectory determined?
 Base score for trajectory GROWTH MODEL How is the GROWTH MODEL trajectory determined")
44
Count three years from FY2006 (Base Score) 1 2 3 GROWTH MODEL How is the GROWTH MODEL trajectory determined?
 GROWTH MODEL How is the GROWTH MODEL trajectory determined")
45
Determine the Proficiency Target GROWTH MODEL How is the GROWTH MODEL trajectory determined?

46
1715 -1430 285 Subtract Proficiency Target from Base Score GROWTH MODEL How is the GROWTH MODEL trajectory determined?

47
1715 -1430 285 Divide difference By 3 GROWTH MODEL How is the GROWTH MODEL trajectory determined?

48
285/3 = 95 Divide difference by 3 GROWTH MODEL How is the GROWTH MODEL trajectory determined?

49
+ 95 = 1525 GROWTH MODEL How is the GROWTH MODEL trajectory determined? Determine Trajectory

50
+ 95 = 1620 Year 1 DSS + 95 = 1525 GROWTH MODEL How is the GROWTH MODEL trajectory determined?

51
Determine Trajectory GROWTH MODEL How is the GROWTH MODEL trajectory determined? Year 1 DSS + 95 = 1620

52
Determine Trajectory Year 2 DSS GROWTH MODEL How is the GROWTH MODEL trajectory determined? Year 1 DSS + 95 = 1620

53
Determine Trajectory + 95 =1715 GROWTH MODEL How is the GROWTH MODEL trajectory determined? Year 2 DSS Year 1 DSS

54
Determine Trajectory Year 3 DSS GROWTH MODEL How is the GROWTH MODEL trajectory determined? + 95 =1715 Year 2 DSS Year 1 DSS

55
Trajectory Set GROWTH MODEL How is the GROWTH MODEL trajectory determined?

56
FY07 Year 1 – Student 1 On track: YES

57
Current Grade 5 Student 2

58
FY07 Year 1 – Student 2 On track: NO

59
FY08 Year 2 – Student 2 On track: NO

60
FY08 Year 3 – Student 2 On track: YES

61
Current Grade 6 Level 3 Student

62
Trajectory Set GROWTH MODEL How is the GROWTH MODEL trajectory determined?

63
Current Grade 3 First Time Proficient: YES Non-proficient: NO

64
Current Grade 3 Retained

65
Current Grade 3 Retained Student 3rd 2006 3rd 2007 4th 2008 5th 2009 Current Grade

66
Current Grade 3 Retained Student 3rd 2006 3rd 2007 4th 2008 5th 2009 Current Grade DSS from FY 2006 (previous year) Base score for trajectory
 Base score for trajectory")
67
Current Grade 3 Retained Student 3rd 2006 3rd 2007 4th 2008 5th 2009 Current Grade Proficiency Target Based on Grade 6 Level 3 DSS

68
Current Grade 3 Retained Student 3rd 2006 3rd 2007 4th 2008 5th 2009 Current Grade Trajectory Set

69
Current Grade 8 Level 5 Student

70
Proficient: YES On track: YES Current Grade 8 Level 5 Student - Year 3

71
Current Grade Grade Used As The Basis For Trajectory Grade Used As Target For Proficiency Years in Trajectory Percent Of Difference Closed Per year 336333% 4363 5473 6583 7693 8710333% 9810333% 109 250% GROWTH MODEL How is the GROWTH MODEL trajectory determined?

72
Current Grade Grade Used As The Basis For Trajectory Grade Used As Target For Proficiency Years in Trajectory Percent Of Difference Closed Per year 336333% 4363 5473 6583 7693 8710333% 9810333% 109 250% GROWTH MODEL How is the GROWTH MODEL trajectory determined?

73
Current Grade Grade Used As The Basis For Trajectory Grade Used As Target For Proficiency Years in Trajectory Percent Of Difference Closed Per year 336333% 4363 5473 6583 7693 8710333% 9810333% 109 250% GROWTH MODEL How is the GROWTH MODEL trajectory determined?

74
Improving an achievement level maintaining a proficient level from the prior year: i.e., 3 to 3 4 to 4 5 to 5 How is the growth of SWD students with FAAR scores determined? ?

75
GROWTH How is a School’s GROWTH percent calculated? 100Students are in survey 2 and 3 and have prior DSS scores 50Students met growth criteria 50%School’s Growth Percent

76
What is the proficiency rate target? Year Reading % Proficient Mathematics % Proficient 2001-023138 2002-033138 2003-043138 2004-053744 2005-064450 2006-075156 2007-085862 2008-096568 2009-107274 2010-117980 2011-1286 2012-1393 2013-14100 58 62 School was now

77
Greater than or equal to 30 and at least 15% of total school population or At least 100 students in the subgroup count GROWTH How many students are needed to calculate a School’s GROWTH percent?

78
FY2007 Data with FY2007 Criteria < Grw R Grw Model

79
FY2007 Data with FY2007 Criteria < Grw M

80
*AYP Rules at Bottom of Report AYP Writing and Graduation Rules & Reporting Rules % Tested & Proficiency Levels Safe Harbor Growth Model

81
AYP What I know? What I want to know? What I learned? % Tested & Proficiency Levels 1.2.3. Safe Harbor 4.5.6. Growth Model 7.8.9. ?

82
Review of your AYP Report

Similar presentations


 handouts. Title I 2008 OBJECTIVES.>")


 U.S. Department of Education Adapted by TEA September 2003.>")


