Download presentation
Presentation is loading. Please wait.

1
Contribution of Aquaculture to Food Security Globally Modadugu V Gupta

2
The greatest disease of all humankind is “hunger” Global population from 1.5 billion in 1900 to 7 billion now and to 9 billion by the year 2050; may reach 10 billion Estimated 925 million under nourished Micronutrient deficiencies affecting > 2 billion 250 million children at risk of vitamin A deficiency; equal number suffer from deficiency of minerals (iron, zinc, calcium, etc.) MDG target of reducing hunger by half by 2015; under nourished declined from 20% of population to 16% in 2010; but no decline in absolute numbers
 MDG target of reducing hunger by half by 2015; under nourished declined from 20% of population to 16% in 2010; but no decline in absolute numbers")
4
Where are undernourished/food insecure?

5
Poverty and Food Insecurity Food security; not just producing food, but also access to food Food security linked with poverty and rural development Economic access to food ONLY when households generate sufficient income Aquaculture provides primary source of income Aquaculture can be a starting point for alleviation of poverty in rural areas

6
Contribution of Fish to Nutrition Fish “Rich food for Poor”; cheapest animal protein Provides over 20% of animal protein to 2.6 billion people globally; in developed countries 13%, while in developing countries > 30% Major source of animal protein in regions where animal protein in diets is below world average Provides at least half of animal protein intake for 400 million poor in S. Asia & Africa Rich source of protein, essential fatty acids, vitamins and minerals. Some fish high in calcium, zinc, vitamin A and iron

7
Contribution of Fish to Nutrition

8
Source: H.H. Jensen / Marine Pollution Bulletin 53 (2006) / Albert Zeucack 2010
 / Albert Zeucack 2010")
10
Percentage of fish in animal protein consumption

11
Contribution to Livelihood Globally over 540 million (8% of population) involved in fisheries & aquaculture; growth more than population & employment in traditional agriculture Fisheries and Aquaculture provides primary source of income 80-100% of rural aquaculture products sold generating cash for families Cash generated used for buying other necessities Brings in foreign exchange
 involved in fisheries & aquaculture; growth more than population & employment in traditional agriculture Fisheries and Aquaculture provides primary source of income % of rural aquaculture products sold generating cash for families Cash generated used for buying other necessities Brings in foreign exchange")
12
Economic Importance of Fish Fish most internationally traded commodity; About 40% global production enters international trade against 10% for meat Global trade in fish over $ 102 billion in 2008 Exports of fish & products exceed those of meat, dairy, cereals, sugar, coffee, oilseeds, etc. In many developing countries foreign exchange from fish exports finances other food imports

13
Source: Jiansan Jia 2010

14
Demand for Fish Present global production of food fish 115 million tons Demand for fish increased at twice population growth over last 50 years Estimated additional 20-30 million tons required to meet demand by 2020; could be an underestimate Per capita consumption increased from 11.5kg in 1970 to 12.5kg in 1980 to 14.4kg in 1990 to 17.0kg in 2008

15
Growing Economic Power, Growing Middle Class Numbers (millions) of global middle class Source: Homi Kharas, The emerging middle class in developing countries, OECD 2010 200920202030 North America338333322 Euope664703680 Central and South America181251313 Asia-Pacific52517403228 Sub-Saharan Africa3257107 Middle East and North Africa 105165234 World184532494884
 of global middle class Source: Homi Kharas, The emerging middle class in developing countries, OECD North America Euope Central and South America Asia-Pacific Sub-Saharan Africa Middle East and North Africa World")
16
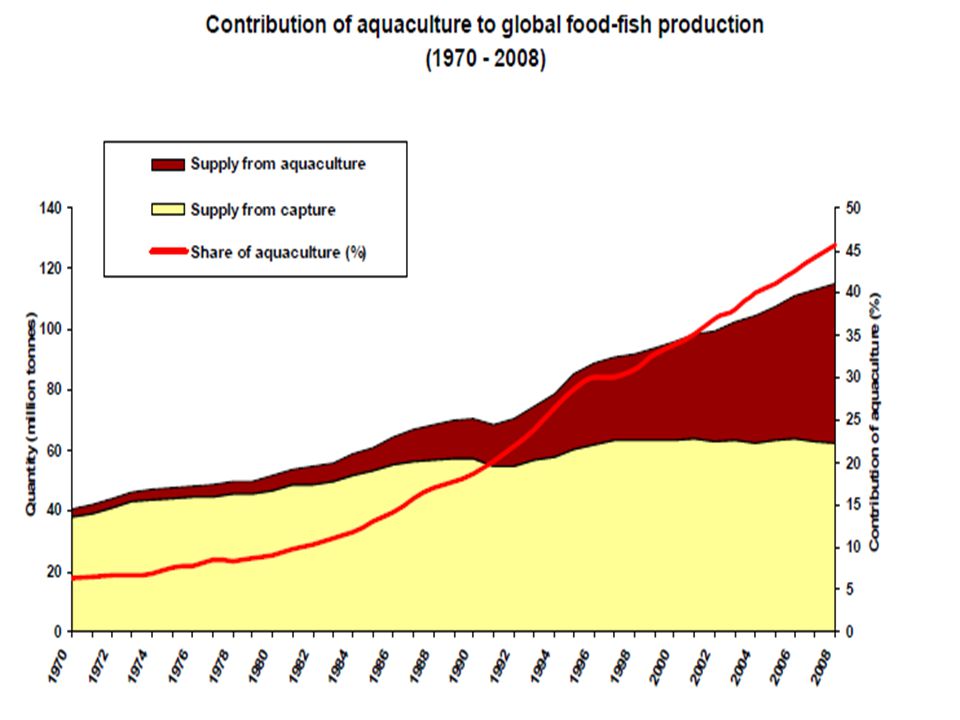
Global Fish Production Source : FAO year Book 2007

17
Aquaculture Importance Aquaculture fastest growing agriculture commodity with annual growth of >6% in last two decades Increased from <1 million tons in 1950 to 55 million tons in 2009 80% comes from 20 million small-holder farms (<2ha) in developing countries; Environmental demands for unit biomass or protein produced are lower as compared to poultry, piggery and beef Grain needed for production of 1kg protein of fish: <13kg; pork 38kg; beef 61kg Animal protein with small carbon footprint. : 0.96% of total Co 2 emission; 6.3-7.5% of agriculture emission

18
Prevalence of iron and vitamin A deficiency Cambodia: WFP promoting Esomus longimanus to supplement iron for small children Bangladesh: 1.3 million ponds; 10 kg/pond Amblypharyngodon mola can meet vitamin ‘A’ requirement of 2 million children

20
Breakthroughs in research & development domestication of more species, 72 sps. in 1950 to 336 sps. in 2006 Better aquatic animal health management Increasing demand – domestic & export Improvement in policies & governance

21
Regional importance Asia-Pacific dominance; over 60% from freshwater China: 61.5% Rest of Asia: 29.5% Europe: 3.6%; mostly high value marine, commercial; research & development remarkable S. America: 2.2%; commercial & industrial; opportunities for small-scale aquaculture development North America: 1.5% – finfish & shellfish development Africa: 1.4%; small-scale & commercial; slower development; gaining importance; increased by 56% during 2003-2007; expansion of small-scale aquaculture

24
Aquaculture can be integrated in to farming systems

27
Red tilapia farm in Malaysia Source: DOF, Malaysia

28
Intensively managed tilapia tanks Tanks in Arizona Tanks in California Source: K. Fitzsimmons

29
Raceways in Arizona Source: K. Fitzsimmons Raceways in Mexico Intensive Raceway Systems

30
Capture based culture in open waters

31
Mariculture Fastest growing subsector of aquaculture Of 202 maritime countries and territories, 93 with mariculture in 2004-2008; 15 countries account 96% global production Caters to high end markets Breeding technologies developed for more species; moving from wild caught seed to hatchery produced seed High growth potential

32
Farming of non-food species Ornamental fish farming o $ 5 billion market o $ 15 billion industry Seaweeds farming o $ 5-6 billion market Pearl farming

33
Women and Aquaculture Strong relationship between hunger and gender inequality Equalising women status with men in S. Asia and SS Africa estimated to reduce malnourished children by 13.4 and 1.3 million respectively Women mostly involved in processing and marketing Excellent opportunities for involvement of women in aquaculture production Many success stories – increase in household incomes, better nutrition and health for family

34
Share of global aquaculture in fish production, 1997 and forecast for 2020 Fish production 1997Increase in fish production, 2020 Source: Rosegrant 2003

35
Historical trends in farmed fish production and projections of future production: 65-85 million tons by 2020 and 79-110 million tons by 2030 Source: S. Hall et.al. 2011

36
Challenges Impact of declining water and land resources Impact of climate change Impact of intensification and spatial concentration of farms Increased aquatic animal health c oncerns Protecting environment Sustaining production and livelihoods

38
Action needed to increase contribution of aquaculture to food security Strengthen research including fish health management; farmed sps. increased from 72 in 1950 to 336 sps. in 2006 Integrate small-scale aquaculture into globalised market economy (improving market access, horizontal & vertical linkages, developing business models, etc.) Species adaptable to climate change; genetic improvement Integrated water resource management Introduction of BMPs Ecosystem approach to aquaculture Food safety and product quality Improvements in policies and governance
 Species adaptable to climate change; genetic improvement Integrated water resource management Introduction of BMPs Ecosystem approach to aquaculture Food safety and product quality Improvements in policies and governance.")
39
Conclusion Aquaculture has shown resilience to various economic crises in the last decade While precise data not available, available information indicate, contribution of aquaculture to poverty alleviation, food security, employment, trade & gender opportunities is on the increase Long term sustainability of aquaculture- economic, social & environmental and contribution to food security depends on commitment of governments and good governance

40
Thank you

Similar presentations


 HIV prevalence rate (%) globally and in Sub-Saharan Africa, 1990–2007 Year Adult HIV prevalence rate (%) 0 1 2 3 4 5 6 7.>")


 mainly in the WHO African (49%) and South.>")


