Download presentation
Presentation is loading. Please wait.

1
The Human Component of the Global Carbon Cycle ASCENDS WORKSHOP 23-25 July, 2008 Ann Arbor, Michigan, USA Gregg Marland Environmental Sciences Division Oak Ridge National Laboratory and Tom Boden Oak Ridge National Laboratory, USA Khrystyna Hamal Lviv Polytechnic National University, Ukraine Matthias Jonas International Institute for Applied Systems Analysis, Austria

2
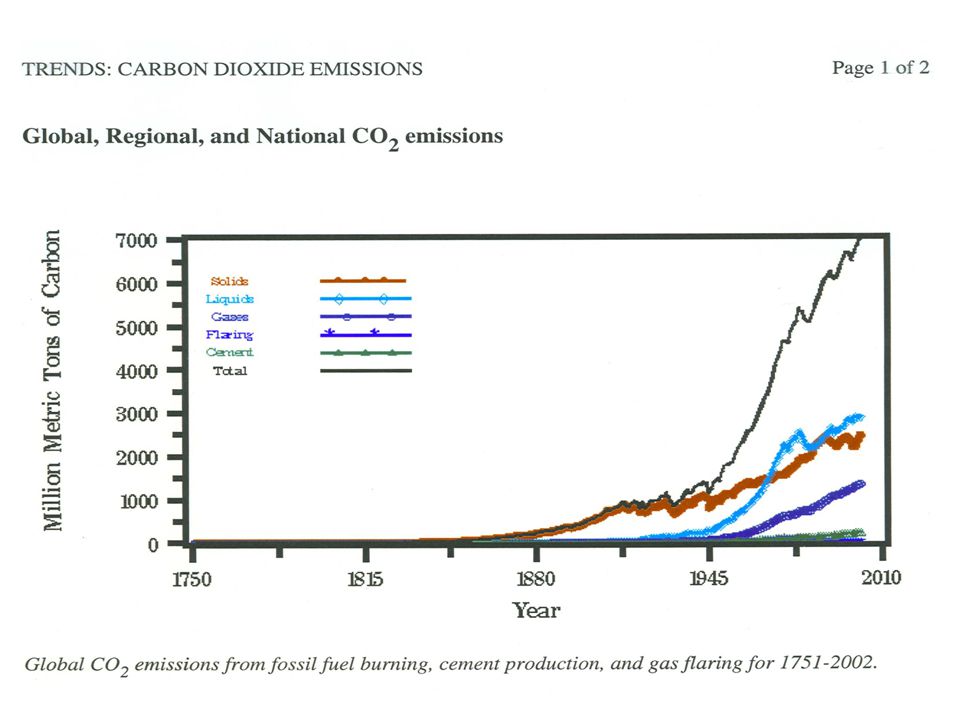
Anthropogenic C Emissions: Fossil Fuel Raupach et al. 2007, PNAS; Canadell et al 2007, PNAS 1990 - 1999: 1.3% y -1 2000 - 2006: 3.3% y -1 185018701890191019301950197019902010 2006 Fossil Fuel: 8.4 Pg C [Total Anthrop.Emis.:8.4+1.5 = 9.9 Pg]

3
atmospheric CO 2 ocean land fossil fuel emissions deforestation 7.6 1.5 4.1 2.2 2.8 2000-2006 CO 2 flux (Pg C y -1 ) Sink Source Time (y) Perturbation of Global Carbon Budget (1850-2006) Le Quéré, unpublished; Canadell et al. 2007, PNAS

5
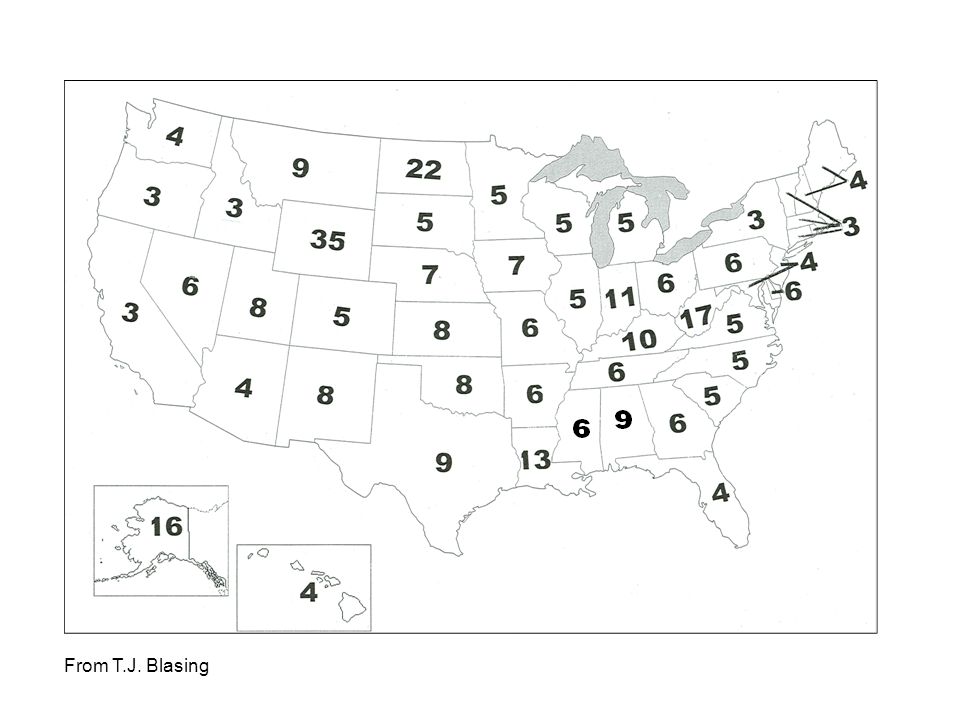
CO 2 Emissions from the United States

8
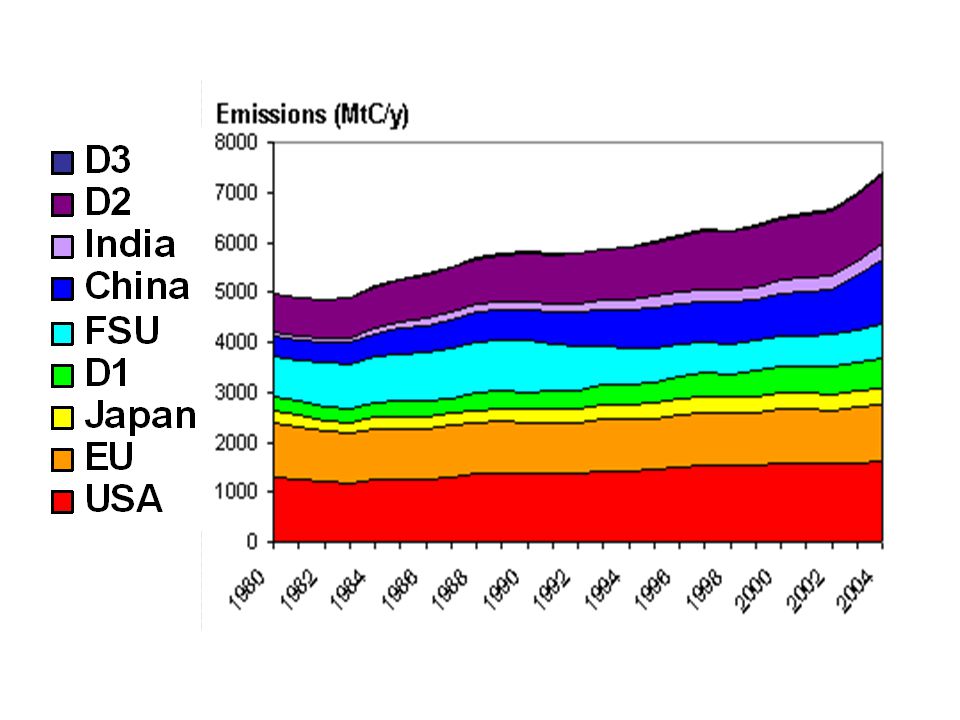
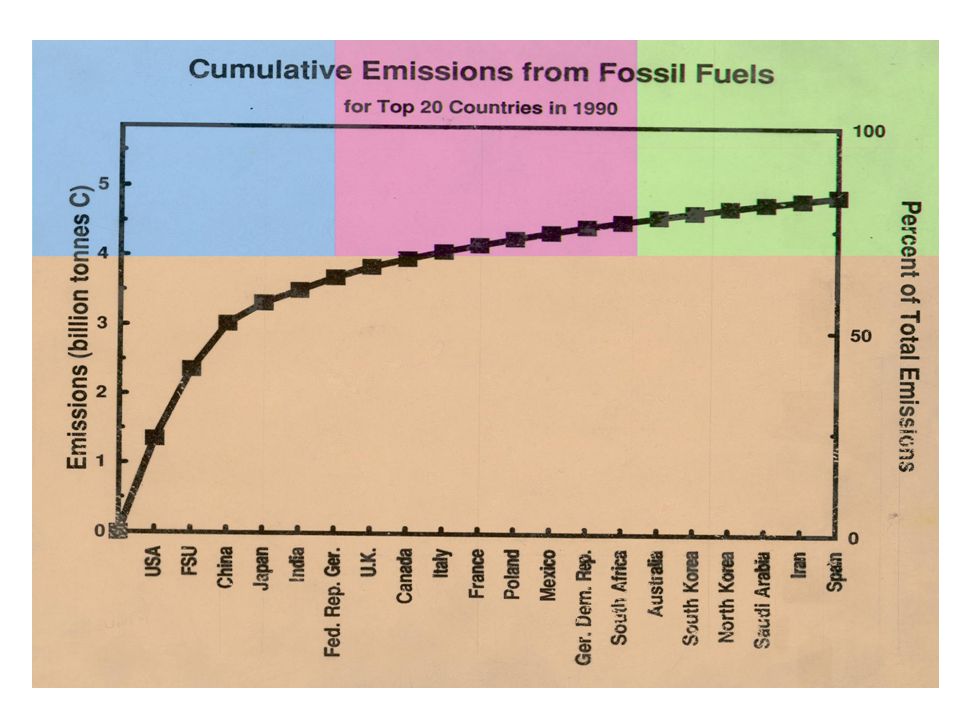
Cumulative fraction of total fossil-fuel emissions - 2005 number of country cumulative countries fraction 1 USA.206 2 China.403 3 Russia.459 4 India.509 5 Japan.552 6 Germany.580 7 Canada.601 8 UK.621 9 Iran.638 10 Mexico.655 20 Ukraine.793 50 Belarus.941 100 Moldova.992 211 1.000

9
Sources of US anthropogenic CO 2 emissions - 2006 Fossil fuel combustion 1537.5 Tg C Non-energy use of fossil fuels 37.6 Iron and steel manufacture 13.4 Cement production 12.5 Gas flaring/venting/leakage 7.8 Other industrial processes 22.9 Total 1631.7 From US EPA, 2008

10
Sectoral sources of CO 2 from fossil fuel combustion – USA - 2006 Electric power generation 41.3% Transport 32.9% Industry 14.5% Residential 5.8% Commercial 3.7% Agriculture 0.8% US territories 1.0% US EPA, 2008

13
From T.J. Blasing

16
Vulcan project – CO 2 from power plants

17
Vulcan project – large industrial point sources

18
Vulcan Project – US C0 2 emissions

19
Carbon released directly by the US human population in 2000. Enhanced area represents carbon released in the metropolitan area of Chicago.

20
From T.J. Blasing

26
Signal Analysis Under the Kyoto Protocol Jonas and Nilsson (2009: Tab. 1)
")
27
Signal Analysis Under the Kyoto Protocol ~ Risk Undershooting U Committed Level Base Year Level x1x1 Time t1t1 Emissions t2t2 x2x2 Jonas and Nilsson (2007: Fig. 11); modified
; modified.")
28
CO 2 Emissions from Austria Austrian CO 2 emissions initial estimates and recalculations of historic emissions in 2000, 2001, 2002, 2003 and 2005. Data from: Austrian National Inventory Reports (2002-2007).
..")
30
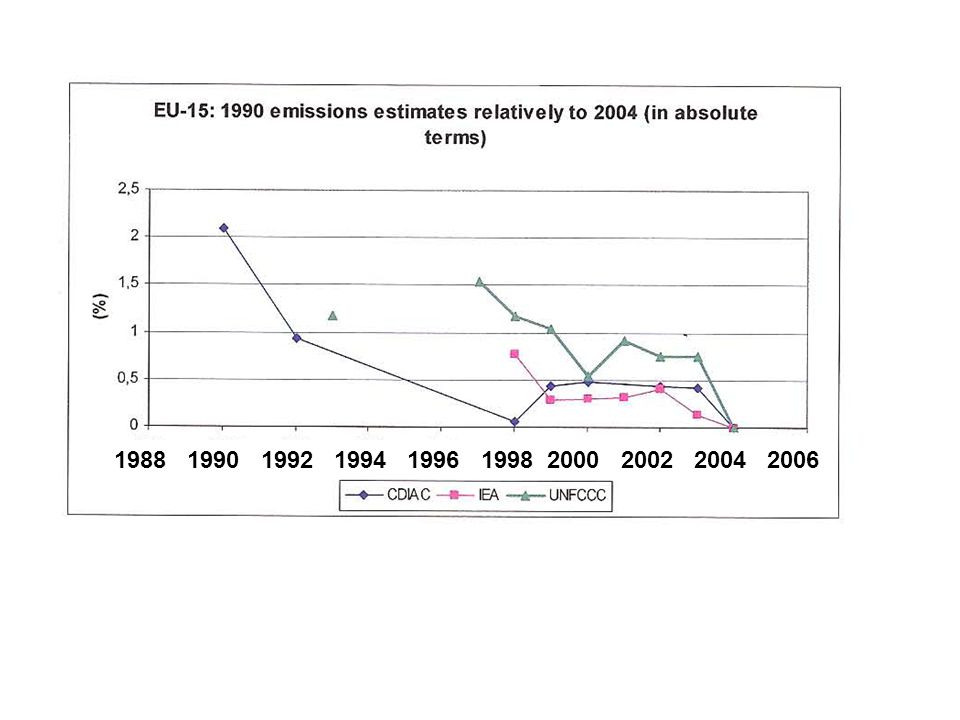
CO 2 emissions without LULUCF estimates. Data from: European Community National Inventory Reports.

32
1988 1990 1992 1994 1996 1998 2000 2002 2004 2006
33
Revisions of Global Total Emissions

35
Revisions of Global Total without China

36
Revisions of Global Total Without……

Similar presentations


 Results WG III Folie 1 A Short Overview of the IPCC Report on Climate Change Mitigation 2007 (WG III) Prof. Dr.>")


>")


 1990 1991 1992 1993 1994 1995 1996 1997 1998 1999 2000 2001 2002 2003 2004 2005 2006 2007 2008 2009 2010 2011 Issue date National Student.>")
