Download presentation
Presentation is loading. Please wait.

1
Key Issue #2 – Where are Migrants Distributed?

2
About 5% of the world’s population are migrants.
The country with the largest amount of migrants is the US.

3
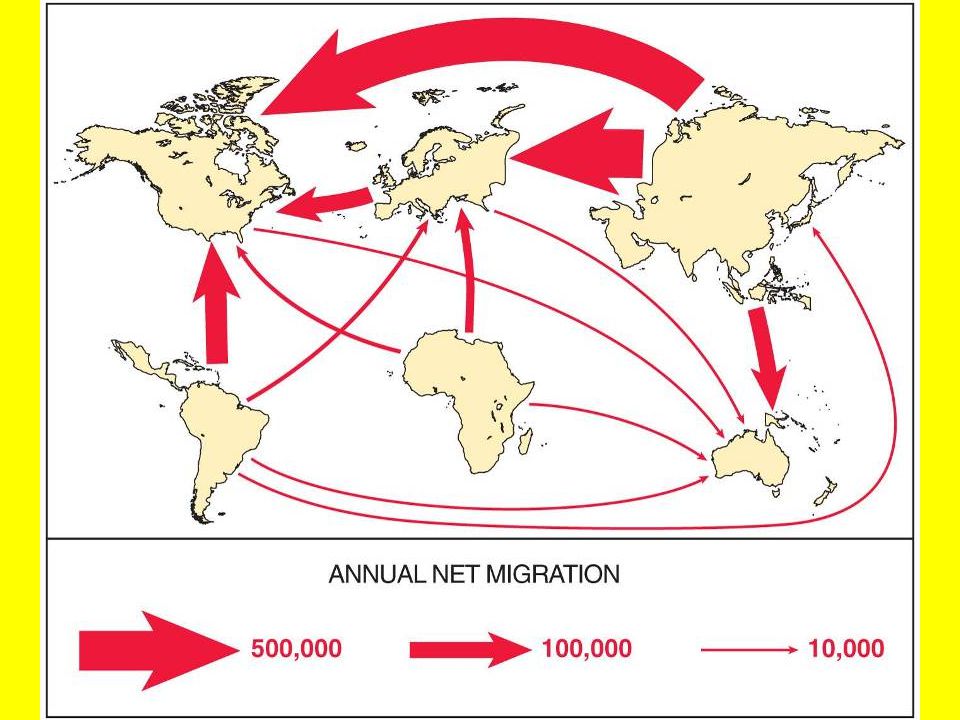
Global Migration Patterns
1) 3 largest flows of migrants: Asia to Europe, Latin America to US, from Asia to US. 2) Substantial in-migration: Europe to North America, Asia to Oceania. 3) Lower levels of in-migration: Latin America to Oceania, Africa to Europe, North America, and Oceania.
 3 largest flows of migrants: Asia to Europe, Latin America to US, from Asia to US. 2) Substantial in-migration: Europe to North America, Asia to Oceania. 3) Lower levels of in-migration: Latin America to Oceania, Africa to Europe, North America, and Oceania.")
6
10% of the US population consists of migrants
These patterns reflects the importance of migration from LDC’s to MDC’s. Migrants head from poor countries to wealthy countries with brighter job prospects. 10% of the US population consists of migrants The highest % of migrants are in the Middle East b/c of oil. Kuwait – 70%, United Arab Emirates – 90%

7
The 2 shades of red represent in-migration,
the 3 shades of blue represent out-migration.

8
IMMIGRATION TO THE US US is the 3rd most populous country.
65+ million immigrants since 1820. We’ve had 2 major waves of immigration 1st wave - Mid-1800’s-early 1900’s 90% from Europe 2nd wave ’s to present 90% from Latin America and Asia Origins of migrants have varied, reasons are the same: rapid pop growth and limited economic advancement at home (leaving stage 2 countries).
.")
9
European Immigration to the US
The US offered the greatest opportunity for economic success historically and today. In order, Germany, Italy, the UK, Ireland, and Russia are the European countries which have sent the most migrants to the US.

10
1st Peak: 1607-1840 A steady stream to the colonies and the US.
90% before 1840 were from Britain. During 1840’s and 50’s, the # of immigrants surged. 4 million during the decade, which doubled the previous 250 years. Jumped from 20,000/year to 250,000/year. Mostly Irish and German. Economic migrants at first. Germany later becomes cultural.

11
2nd Peak: 1880’s Dropped in the 1860’s b/c of our Civil War.
Peaked in the 1880’s. ½ million annually migrated. More Germans, Irish… now Swedes and Norwegians as the Ind Rev diffused to their area and their populations boomed.

12
3rd Peak: Economic problems in the 1890’s discouraged immigration. Nearly 1 million per year during 1907 = 1.3 million, the most per year ever New countries now… Italy, Russia, Austria-Hungary. Southern/Eastern Europeans came b/c they were now entering stage 2. At peak of immigration, 13 million US residents (or 14%) were foreign born. This peak came to an end b/c of WWI.
 were foreign born. This peak came to an end b/c of WWI.")
13
Europeans once made up 90% of all immigrants to the US.
In the 1960’s, just 30%. Today, only 10%.

14
The Enclosure Movement
To promote more efficient agriculture, some governments forced the consolidation of small farms into larger ones in the late 1700’s. The avg farm (due to inheritances) had become too small to be profitable. In England, we call this the “Enclosure Movement”.
 had become too small to be profitable. In England, we call this the Enclosure Movement .")
15
Harby, England… A typical Pre-Enclosure Movement Village

16
Property Lines in Harby

18
Farmers had 2 choices: move to cities and work in factories or move out of the country.
The Enclosure Movement forced millions to migrate to the US.

19
Effect of European Migration
As do all migrants, Europeans brought their culture with them. Christianity is the world’s largest religion More than ½ of world’s people speak an Indo-European language. Europe’s culture and political structures have also diffused. i.e. clothing styles, foods, etc

20
Negative Effects of European Migration
planted seeds of conflict by migrating into regions with indigenous populations imposed political domination over others injected culture extracted resources instead of building upon them bringing in slave labor drawing arbitrary boundary lines discriminating among local ethnic groups.

21
RECENT IMMIGRATION Immigration dropped sharply in the 1930’s and 40’s (Great Depression and WWII) For the only time in our history, we had more emigrants than immigrants. Immigration steadily increased in the 1950’s, 60’s, and 70’s. We broke records in the 80’s and 90’s.

22
Immigration From Asia Late 1800’s and early 1900’s – 3 primary countries: China, Japan, and Turkey. 1990’s: China, Philippines, and Vietnam Overall in the 1900’s, the largest #’s came from China and India (stage 2 countries, #1 and #2 in overall population totals).
.")
23
Per year during 1990’s

24
Immigration from Latin America
Mexico passed Germany as the country that has sent the most immigrants to the US. From Latin America… 1) Mexico, 2) Dominican Republic, 3) El Salvador Our primary sources have changed from Europe to now Latin America and Asia, but reasons remain the same – poor economic conditions. Europeans encountered a booming, sparsely settled country with unclaimed land. New immigrants encounter a country with a finite amount of space.
 Mexico, 2) Dominican Republic, 3) El Salvador. Our primary sources have changed from Europe to now Latin America and Asia, but reasons remain the same – poor economic conditions. Europeans encountered a booming, sparsely settled country with unclaimed land. New immigrants encounter a country with a finite amount of space.")
25
Per year during 1990’s

27
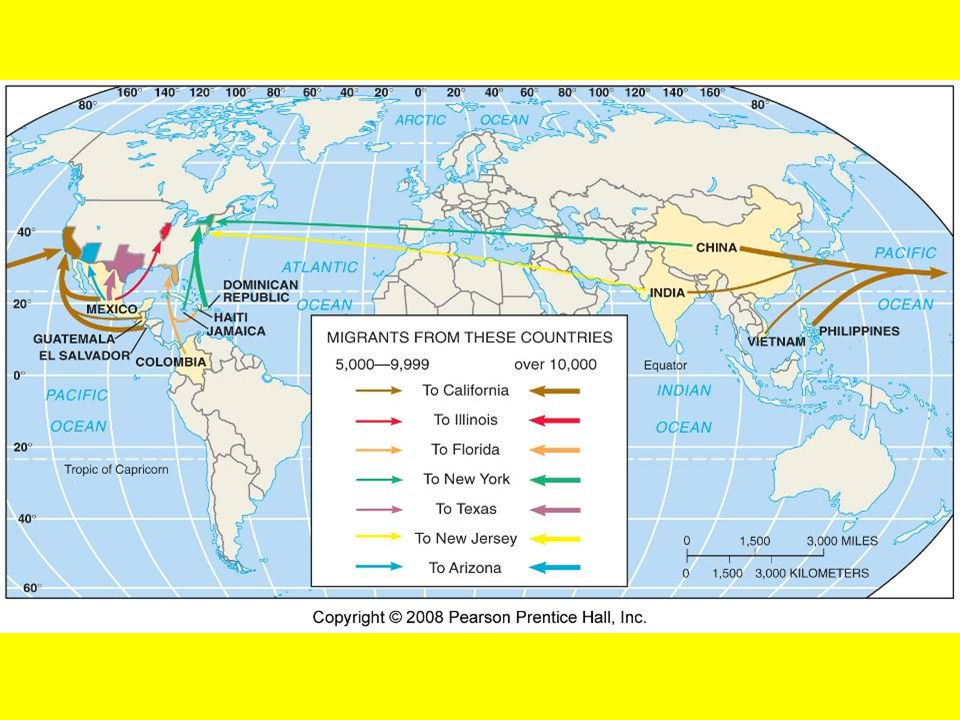
Destinations of Immigrants in the US
1/4th to California, 1/4th to NY and NJ, 1/4th to FL, TX, and Illinois, with the other 1/4th scattered around the other 44 states. These 6 states have the nation’s busiest airports Immigrants used to arrive by boat and lived near coastal areas… now arrive by plane and car. Chain migration – migration of people to a specific place b/c relatives or members of the same nationality settled there.

29
Undocumented Immigration to the US
The demand to enter the US is higher than the quotas, so some people sneak in. This, of course, is illegal. More than 95% of illegal immigrants are Mexican. 2 ways people come illegally… Enter with a work or student visa and not leave Slip across border Can buy forged documents. If caught, are sent home and then can come straight back.

30
The 1986 Immigration Reform and Control Act tried to reduce the # of immigrants.
If you could prove you had lived in the US continuously from you could apply for residency and become a citizen after 5 years. Few applied b/c they didn’t want to be deported Cracked down on getting jobs by immigrants

31
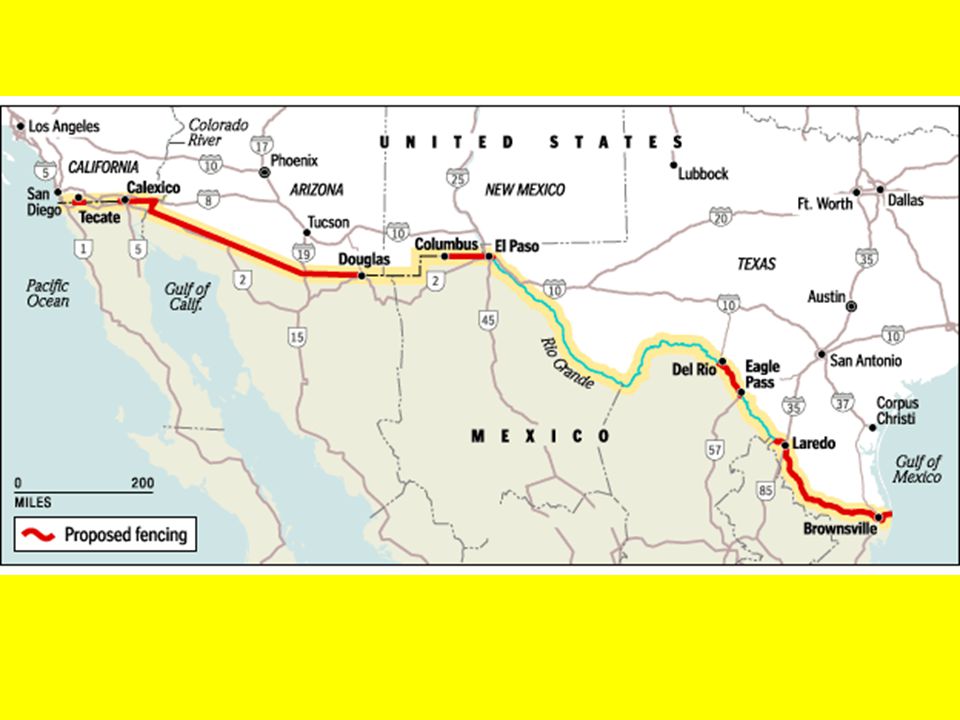
Crossing the US-Mexican Border
Is heavily patrolled, but is very long (2000+ miles) and crosses urban areas and rural areas. Parts are fenced, but many parts are not. Hardest part for potential immigrants is reaching the border, not crossing it. The US has a difficult dilemma… if allowed to stay, this could encourage more to come, threatening unemployment. Most illegal immigrants, however, take low paying jobs most citizens don’t want.
 and crosses urban areas and rural areas. Parts are fenced, but many parts are not. Hardest part for potential immigrants is reaching the border, not crossing it. The US has a difficult dilemma… if allowed to stay, this could encourage more to come, threatening unemployment. Most illegal immigrants, however, take low paying jobs most citizens don’t want.")
34
U.S. Mexico

36
A “Day of the Dead” mass conducted cross-border

37
Tijuana Border Crossing

38
Mexico US Nogales, Arizona

39
Patches in the wall at Nogales, AZ

42
Immigration reform has been a major issue in US politics for the last few years. Above are leaders of the Democratic Party.

45
Border patrol between El Paso and Juarez, Mexico.

47
Border Patrol Sectors

Similar presentations