Download presentation
Presentation is loading. Please wait.

1
LHC Lumi Days – 14/01/2011 D. Belohrad, JJ Gras, M. Ludwig, P. Odier (BE-BI) 1
 1")
2
Presentation Overview This presentation will list the main issues and results observed with the LHC BCTs during 2010 and our strategy and prospects for 2011. BCT DC Main Issues in 2010Fast BCT Main Issues in 2010Strategy & Results in 2010A Word on our BCT WorkshopStrategy & Prospects for 2011Conclusions 2

3
3

4
BCTDC Issue #1: Sensitivity to High Density Filling Patterns DC BCT were behaving well until we started to inject more and more tightly spaced batches in the machine. Then the DC BCT started to totally lose track. Following plot shows in yellow the fast BCT increasing correctly at each injection and in green the response from the DC jumping up and down. 4

5
BCTDC Issue #1: Sensitivity to High Density Filling Patterns This effect has been lately diagnosed, simulated and then reproduced in the Lab. Excessive amplitudes due to inappropriate gain partitions associated with operational amplifier limitations (current, voltage swing, slew-rate) induce non linearity in the AC loop electronics (see plot below). Simulation of the beam (filling percentage) Signal within the AC loop Positive or negative saturation Output 1 turn (89µs) 5
 induce non linearity in the AC loop electronics (see plot below). Simulation of the beam (filling percentage) Signal within the AC loop Positive or negative saturation Output 1 turn (89µs) 5.")
6
BCTFR Issue #1: Our 25 ns integration vs Satellite and Ghost Bunches The real bunches can be surrounded with satellites and small ghost bunches. Satellites can reach the level of 1%. Ghost bunches can sometimes be observed throughout the ring below 0.1% level (as shown in the LDM measurement below done during last November ion run). The problems are that: Ghost are too close to noise level to be measured properly by fast BCTs Depending on the position of the satellites relative to our 22ns integration gate they may or may not contribute to the measured main bunch intensity. Main Bunch Satellite (~1% of the Main Bunch) Ghosts every 2.5 ns (below 0.1% of the Main Bunch) 25 ns 6
. The problems are that: Ghost are too close to noise level to be measured properly by fast BCTs Depending on the position of the satellites relative to our 22ns integration gate they may or may not contribute to the measured main bunch intensity. Main Bunch Satellite (~1% of the Main Bunch) Ghosts every 2.5 ns (below 0.1% of the Main Bunch) 25 ns 6.")
7
BCTFR #2: The Bunch Length Dependency With nominal bunches, we also quickly realized that our high bandwidth fast BCT were sensitive to bunch length. This plot shows on top the evolution of the DC BCT in blue and high BW fast BCT in red while ramping. Bottom plot shows the evolution of beam 1 and 2 bunch lengths during that time. High BW drops by 1% while the DC stays stable. 7

8
BCTFR Issue #3: Sensitivity to Beam Position We lately realized that our fast BCT measurements depend significantly on beam position. The plot below shows the evolution of the DC in grey and the high BW fast BCT in blue for beam 1 and beam 2 during position bumps. The variation has been estimated at 1%/mm in these conditions (end of last ion physics run). 8
. 8.")
9
BCTFR Issue #3: Sensitivity to Beam Position This sensitivity came has a surprise since our fast BCTs are bought from industry and stated to have <0.2%/mm. (We did this check for the DC since this monitor is homemade – DC is insensitive to position). The source of this error has been identified and recognized by the Company. It comes from a position dependence on the high frequency spectral response of the monitor. (This effect may also explain our sensitivity to bunch length.) This does not alter the performance during dedicated VdM scans thanks to the procedure we have in place there (i.e. cross- calibration with DC BCTs just before the scan) and stable beam conditions in point 4 during the scans. 9
. The source of this error has been identified and recognized by the Company. It comes from a position dependence on the high frequency spectral response of the monitor. (This effect may also explain our sensitivity to bunch length.) This does not alter the performance during dedicated VdM scans thanks to the procedure we have in place there (i.e. cross- calibration with DC BCTs just before the scan) and stable beam conditions in point 4 during the scans. 9.")
10
10

11
The Strategy & Results in 2010 We quickly realized that the DC and Fast BCT calibrations were giving different results (by more than 5%) when measuring the same beam. So we tried to apply the following strategy: Check, trust and fixe systems from what we believed was the most simple to the most complex, i.e.: 1. DC BCTs (no fast timing, no FPGA code, simple calibration procedure) 2. Fast BCT Low BW channel (complex FPGA code, complex calibration procedure, no bunch phasing necessary, no ‘tail’ response signal issue) 3. Fast BCT High BW channel (complex FPGA code, complex calibration procedure, accurate bunch phasing necessary, sensitive to tail signal) We used the BCT DC to cross-calibrate the 2 others and monitored the possible divergences between them at each new operational step to diagnose new problems. 11
 2. Fast BCT Low BW channel (complex FPGA code, complex calibration procedure, no bunch phasing necessary, no ‘tail’ response signal issue) 3. Fast BCT High BW channel (complex FPGA code, complex calibration procedure, accurate bunch phasing necessary, sensitive to tail signal) We used the BCT DC to cross-calibrate the 2 others and monitored the possible divergences between them at each new operational step to diagnose new problems. 11.")
12
The Strategy & Results in 2010 Despite our issues, BCTs never prevented the amazing and continuous progress of the machine in terms of bunch population, number and spacing. A negative side effect of this positive point is that our issues were not considered as serious enough to get the requested MD or intervention time to diagnose and try to fix them. We also managed, thanks to our close collaboration with you and the well defined context of the dedicated VdM scans, to achieve during these scans performance which is already pretty close to our targets defined by the original LHC functional specification. These results are described in details in dedicated notes (in progress) and during this workshop. 12
 and during this workshop. 12.")
13
13

14
A word on the BCT Workshop We took the opportunity of this workshop to bring together experts from DESY, GSI, CERN & Industry to improve our BCTs. We had many fruitful discussions on how to improve the current systems (actions will be presented in following slides). It was also good to ear that: Similar issues have been observed in all laboratories on many different machines (lepton/hadron – linac/synchrotron). these instruments are still poorly understood for phenomena below the % level. You are quite demanding clients People tend to be reluctant to mention absolute accuracy as soon as they have more than one monitor in the ring 14
. It was also good to ear that: Similar issues have been observed in all laboratories on many different machines (lepton/hadron – linac/synchrotron). these instruments are still poorly understood for phenomena below the % level. You are quite demanding clients People tend to be reluctant to mention absolute accuracy as soon as they have more than one monitor in the ring 14.")
15
15

16
Plans for BCTDC in2011 DCCT Modifications to address sensitivity to filling pattern (ready for start of 2011 run): Improvement of the high frequency bypass to limit components >11kHz which are seen by the transformer. Installation of modified electronic boards to ensure remaining AC components do not saturate the amplifiers. Tested in lab for filling schemes used in 2010 & verified for 50ns filling schemes with nominal intensities. 25ns filling schemes cannot yet be simulated in the lab with sufficiently high intensities. Monitoring improved to allow check & diagnosis of this problem. 16

17
Plans for BCTDC in2011 DCCT Improvements during 2011 Installation of new 24 bit ADC acquisition board that should cover the entire dynamic range and improve our resolution for high beam currents. Continue to concentrate on the reduction of the BCT DC scaling factor uncertainty. The proposed measurements, done in collaboration with C. Barschel, should allow us to progress in this domain during the year. 17

18
Plans for BCTFR in 2011 The described issues explain why our attempts to calibrate directly the fast BCTs failed so far. We will have to continue relying on cross-calibration on well know conditions until the bunch length and position (and filling pattern?) fast BCT dependencies are solved or at least controlled. Several ideas are currently being studied to try and overcome this issue. However, it is clear that the fast BCT will only ever be able to deliver the integrated charge in a 25ns window. The bandwidth of these systems is insufficient to distinguish and measure satellite or ghost bunches. 18
 fast BCT dependencies are solved or at least controlled. Several ideas are currently being studied to try and overcome this issue. However, it is clear that the fast BCT will only ever be able to deliver the integrated charge in a 25ns window. The bandwidth of these systems is insufficient to distinguish and measure satellite or ghost bunches. 18.")
19
Strategy for 2011 BCT DC will remain our main source of absolute calibration in 2011. We will push their performance as much as we can with the current hardware and we reasonably think to be able to push their absolute scale uncertainty below 1%. We saw during October VdM scan that we can achieve a 1% relative uncertainty between bunches with the fast BCT and so get a good bunch intensity absolute accuracy if parasitic bunch population is negligeable. But if we want to have more flexibility for these scans (higher bunch intensity, crossing angles, end of run scans…), we will have to be able to estimate properly the debunched beam and ghost and satellite bunch population. 19
, we will have to be able to estimate properly the debunched beam and ghost and satellite bunch population. 19.")
20
Strategy for 2011 For this, BI is currently commissioning two instruments (see next presentation for details): the Longitudinal Density Monitor : for debunched beam, ghost, satellite and main bunch measurements (several mn integration times) the Wall Current Monitor: for fast (few seconds integration time) main and satellite bunch measurements Neither can be directly calibrated and both will rely on cross calibration via DC monitors. It is also not clear what additional systematics / non linearities these methods introduce. But they look promising and we are working hard to have them operational during Q1 2011. 20

21
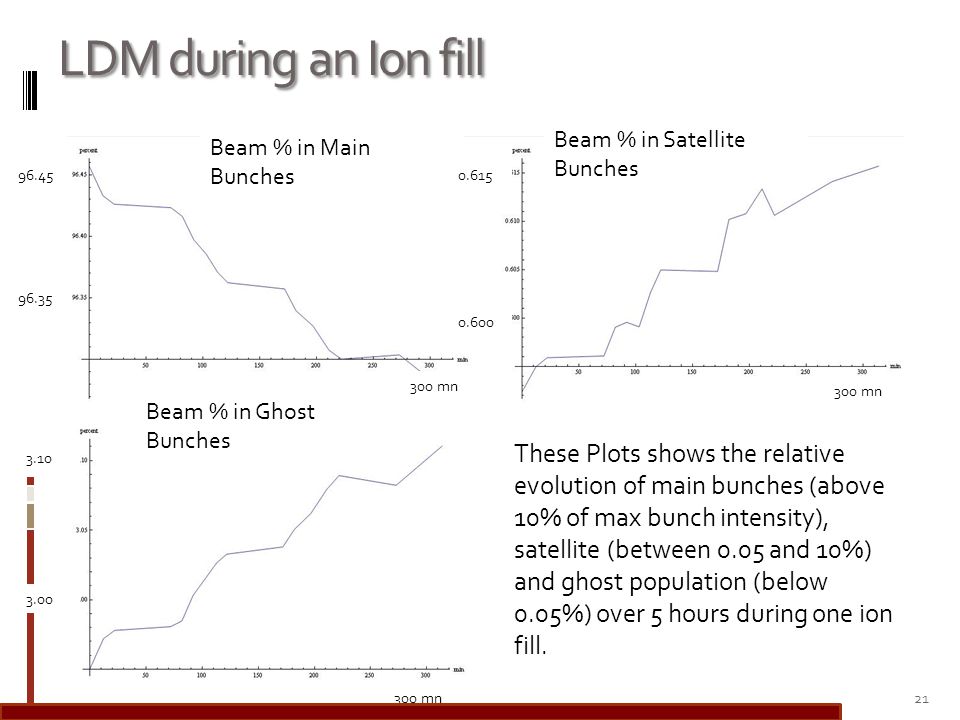
LDM during an Ion fill 21 Beam % in Main Bunches Beam % in Satellite Bunches Beam % in Ghost Bunches 96.45 96.35 300 mn These Plots shows the relative evolution of main bunches (above 10% of max bunch intensity), satellite (between 0.05 and 10%) and ghost population (below 0.05%) over 5 hours during one ion fill. 0.615 0.600 3.10 3.00
22
LDM during last Ion VdM Scan Plot below shows main bunches on the left side and satellite and ghosts on the right side 22 0.8 % 100 %

23
23

24
Conclusions & Acknowledgments We would like to take this opportunity to thank you for: Your trust in our capacity and will to serve you well Your patience Your help (especially the BCNWG members and in particular Carolina, Gabriel, Thilo and Colin) in analyzing our instrument results Your unreasonable requirements and gently pressure which significantly speeded up our progress on understanding our LHC BCTs We were happy to see yesterday that despite all the issues encountered, the results of these VdM scans looks amazingly precise and coherent for a first year of Physics And we are looking forward to see with you the results of our modifications and new instrumentation. 24

25
25

26
BCTDC Electronics BCT Workshop January 12 2011 P.Odier 26 Simplified schematics: 3 toroids – 2 DCCT cores modulated in opposition & one AC core to extend bandwidth to higher frequency. Monitoring points visible from the surface DC AC

27
BCTFR Position dependency www.cern.ch/gasior/work/BCT_meas_setup.jpg www.cern.ch/gasior/work/BCT_meas_time_domain.mov www.cern.ch/gasior/work/BCT_meas_time_10nsPerDivLinAmpliScale.mov www.cern.ch/gasior/work/BCT_meas_freq_domain.mov www.cern.ch/gasior/work/BCT_meas_freq_30k-200M_5dBperDiv.mov These pictures and movies shows the lab setup and result on beam position dependency diagnostic. 27

28
BCTFR Issue #1: The Artificial Tails The signal arriving at our integrators has some tails leading to artificial intensity readings in the neighboring 25 ns slots. On some monitors, this can reach a few % of the real bunch intensity. 28

Similar presentations


