Download presentation
Presentation is loading. Please wait.

1
Harnessing the Giant: Storage Efficiency on an Anemic IT Budget Data Center Enhancements Inc.

2
Theres a Storm on the Horizon According to AFCOMs Data Center Institute, power failures and limits on power availability will interrupt data center operations at more than 90% of all companies over the next five years.

3
Challenging the IT Environment Data center energy consumption continues to grow at a rate of 15% per year. Corporate storage requirements continue growing at 50% or more per year 2009 IT budgets are static or have declined, creating a financial squeeze for IT Understanding the underlying issues behind storage energy consumption will help IT Professional better manage this challenge

4
Current Efficiency Trends Billion BTUs

5
Energy Consumption by State

6
NY State Energy Prices per MM BTU U.S Dept. of Energy

7
Where Does the Energy Go?

8
Storage Power Consumption

9
Anatomy of a Storage System

10
Technology Enhancements Large Capacity Disks Multi-Tiered Storage Architecture Automated, Policy- Based Data Migration Software

11
File Access Over Time

12
Comparing Disk Drive Attributes

13
Disk Drive Power Consumption Estimated Electrical Cost per 100 TB by Disk Capacity and Type of Technology Vendor Disk Capacity in GB Disk Drive Type Rotation Speed Typical Power per Disk in Watts Idle Power per Disk in Watts Number of Raw Disks per 100 TB Total Power in KW/hr. **Average Cost per KW/hr. @ $.0639 1-Year Power Cost per 100 TB 5-Year Power Cost per 100 TB Power Efficiency Index (Watts/GB) BTUs per disk BTU/hr per 100 TB Seagate3.5-inch73FC15K14.79.2137020.1$1.29$11,273$56,3650.20150.2247,371,365 Hitachi3.5-inch73FC15K14.08.9137019.2$1.23$10,736$53,6810.19247.8235,591,776 Seagate3.5-inch146FC15K16.510.768511.3$0.72$6,327$31,6340.11356.3138,830,868 Hitachi3.5-inch146FC15K15.710.768510.8$0.69$6,020$30,1000.10853.6132,099,674 Seagate3.5-inch300FC15K18.813.73346.3$0.40$3,515$17,5740.06364.177,128,669 Hitachi3.5-inch300FC15K19.014.13346.3$0.41$3,552$17,7610.06364.877,949,187 Seagate3.5-inch73FC10K14.08.7137019.2$1.23$10,736$53,6810.19247.8235,591,776 Hitachi3.5-inch73FC10K14.110.3137019.3$1.23$10,813$54,0650.19348.1237,274,574 Seagate3.5-inch146FC10K15.59.968510.6$0.68$5,943$29,7160.10652.9130,416,876 Hitachi3.5-inch146FC10K14.210.86859.7$0.62$5,445$27,2240.09748.5119,478,686 Seagate3.5-inch300FC10K18.012.23346.0$0.38$3,365$16,8270.06061.473,846,598 Hitachi3.5-inch300FC10K16.913.43345.6$0.36$3,160$15,7980.05657.769,333,751 Seagate3.5-inch400FC10K12.18.12503.0$0.19$1,693$8,4660.03041.337,156,680 Hitachi3.5-inch450FC10K17.112.72233.8$0.24$2,135$10,6730.03858.346,839,527 Seagate3.5-inch450FC10K - - - - - - Seagate3.5-inch600FC10K - - - - - - Seagate3.5-inch250SATA II7.2K10.68.04004.2$0.27$2,373$11,8670.04236.252,080,768 Hitachi3.5-inch250SATA II7.2K6.04.84002.4$0.15$1,338$6,6920.02420.429,368,436 Hitachi3.5-inch320SATA II7.2K6.04.83131.9$0.12$1,047$5,2360.01920.422,980,801 Seagate3.5-inch400SATA II7.2K13.09.32503.3$0.21$1,819$9,0960.03344.439,920,400 Seagate3.5-inch500SATA II7.2K10.68.02002.1$0.14$1,187$5,9330.02136.226,040,384 Hitachi3.5-inch500SATA II7.2K6.04.82001.2$0.08$669$3,3460.01220.414,684,218 Seagate3.5-inch750SATA II7.2K11.68.01341.6$0.10$870$4,3500.01539.619,093,006 Hitachi3.5-inch750SATA II7.2K10.68.11341.4$0.09$796$3,9810.01436.217,469,760 Seagate3.5-inch1000SATA II7.2K11.68.01001.2$0.07$649$3,2470.01239.614,248,512 Hitachi3.5-inch1000SATA II7.2K11.89.01001.2$0.08$660$3,3010.01240.214,485,705
 BTUs per disk BTU/hr per 100 TB Seagate3.5-inch73FC15K $1.29$11,273$56, ,371,365 Hitachi3.5-inch73FC15K $1.23$10,736$53, ,591,776 Seagate3.5-inch146FC15K $0.72$6,327$31, ,830,868 Hitachi3.5-inch146FC15K $0.69$6,020$30, ,099,674 Seagate3.5-inch300FC15K $0.40$3,515$17, ,128,669 Hitachi3.5-inch300FC15K $0.41$3,552$17, ,949,187 Seagate3.5-inch73FC10K $1.23$10,736$53, ,591,776 Hitachi3.5-inch73FC10K $1.23$10,813$54, ,274,574 Seagate3.5-inch146FC10K $0.68$5,943$29, ,416,876 Hitachi3.5-inch146FC10K $0.62$5,445$27, ,478,686 Seagate3.5-inch300FC10K $0.38$3,365$16, ,846,598 Hitachi3.5-inch300FC10K $0.36$3,160$15, ,333,751 Seagate3.5-inch400FC10K $0.19$1,693$8, ,156,680 Hitachi3.5-inch450FC10K $0.24$2,135$10, ,839,527 Seagate3.5-inch450FC10K Seagate3.5-inch600FC10K Seagate3.5-inch250SATA II7.2K $0.27$2,373$11, ,080,768 Hitachi3.5-inch250SATA II7.2K $0.15$1,338$6, ,368,436 Hitachi3.5-inch320SATA II7.2K $0.12$1,047$5, ,980,801 Seagate3.5-inch400SATA II7.2K $0.21$1,819$9, ,920,400 Seagate3.5-inch500SATA II7.2K $0.14$1,187$5, ,040,384 Hitachi3.5-inch500SATA II7.2K $0.08$669$3, ,684,218 Seagate3.5-inch750SATA II7.2K $0.10$870$4, ,093,006 Hitachi3.5-inch750SATA II7.2K $0.09$796$3, ,469,760 Seagate3.5-inch1000SATA II7.2K $0.07$649$3, ,248,512 Hitachi3.5-inch1000SATA II7.2K $0.08$660$3, ,485,705.")
14
A Typical Tiered Storage Architecture

15
How Do the Costs Add Up? $33,680

16
Technology Enhancements (cont.) Thin Provisioning Data Deduplication Energy Monitoring and Management
 Thin Provisioning Data Deduplication Energy Monitoring and Management")
17
Configuration Changes Storage Consolidation Storage Virtualization FC Network Port Consolidation Performance Optimization Firmware Tune-Up Disk Spares Assignment RAID Array Layout

18
Loss from RAID5 Parity and Sparing

19
Configuration Changes (cont.) New Generation Power Supplies Eliminate Internal Disks (Boot-from-SAN) Centralize Storage Management Functions Reclaim Unused Storage Space
 New Generation Power Supplies Eliminate Internal Disks (Boot-from-SAN) Centralize Storage Management Functions Reclaim Unused Storage Space")
20
Operational Improvements Retire Legacy Equipment Shut Down All Inactive Systems Clean Up File Systems Preen Data for Unwanted/Illegal Files Review Schedules and Backup Lists

21
Operational Improvements (cont.) Implement File Aging and Expiration Retain Only Data that is Necessary Increase the Use of Off- Line Storage
 Implement File Aging and Expiration Retain Only Data that is Necessary Increase the Use of Off- Line Storage")
22
Backup and Recovery Limiting Cloning Control the Number of File Copies Turn On Data Compression Use High Capacity Tape Drives

23
Advanced Technologies 2 1/2 inch Drives Solid State Disks Automatic Power Down Disk Drives Improved Storage Controller Efficiency DC Power Supply MAID Technology

24
Improve the Data Center Environment Replace Missing Floor Tiles Measure Air Pressure Under Raised Floor Eliminate Items Blocking Air Flow Replace Blank Panels in Storage Racks Evaluate Raising Temperature and Humidity Settings Implement Cabinet Cooling Technologies Obtain a Thermal Map of Airflow Turn off Video Monitors When Not in Use

25
Best Practices Increase User Awareness Data Classification Balancing Performance, Availability, Capacity, and Energy Efficiency Requirements Change the IT Culture

26
Changing the IT Culture Not the IT Environment of the 80s or 90s Make Energy Efficiency Part of Your Core Culture –Secure Executive Level Commitment –Train, train, and train for results –Make energy conservation a component in every IT employees evaluation criteria –Provide incentives and personal recognition for efficiency improvements –Raise the level of visibility and importance of energy efficiency

27
Potential Results EPA Report to Congress

28
Where Do We Start? If you dont know where youre going, how will you know when youve arrived? Begin with an Unbiased Assessment –Provides a clear picture of what you have now –Creates a baseline for measuring change –Allows you to prioritize your approach based on actual operating environment parameters –Will identify quick hit opportunities –Identifies scope, duration, gaps, and resource requirements needed for a successful project –Yields core information for strategic planning

29
Assessment Objectives What Should a Storage Assessment Provide? –Presents the big picture to management –Estimates the efficiency level of current storage equipment –Provides a documented operational baseline –Facilitates a gap analysis –Determines project resource requirements –Identifies and prioritizes area of greatest return –May provide ROI, TCO and other financial artifacts for a proposed remediation project

30
Implementation Strategy Improvement is a process, not an event A Storage Optimization Project should include: –A comprehensive transformation strategy –Quantifiable goals and key milestones –Key metrics that can be tracked and evaluated –A prioritized implementation timeline –Master Project Plan with key events identified –Annualized budget requirements –A methodology for staged implementation –Integration points that allow the project to gracefully merge with other IT projects

31
Summary Power and Cooling Expense will Be a Growing Factor in Future IT Budgets Many Opportunities Exist for Improvement Opportunities for Improvement Range from Quick and Simple to Complex and Obscure Dramatic Cost Savings can be Achieved over Time with a Good Strategy An Effective Energy Strategy Starts with a Comprehensive Assessment Energy Efficiency Improvement is a Continuous Process

32
RANDY COCHRAN - DATA CENTER ENHANCEMENTS INC. - PHONE: (630) 513-9747 - WEB: HTTP://WWW.DC-EI.COM Questions?
 WEB: Questions .")
33
Forty Improvement Steps

34
Low Cost Improvements

35
Low Cost Improvements (Cont.)
")
38
Modest Cost Improvements

39
Modest Cost Improvements (Cont.)
")
40
Substantial Investments

41
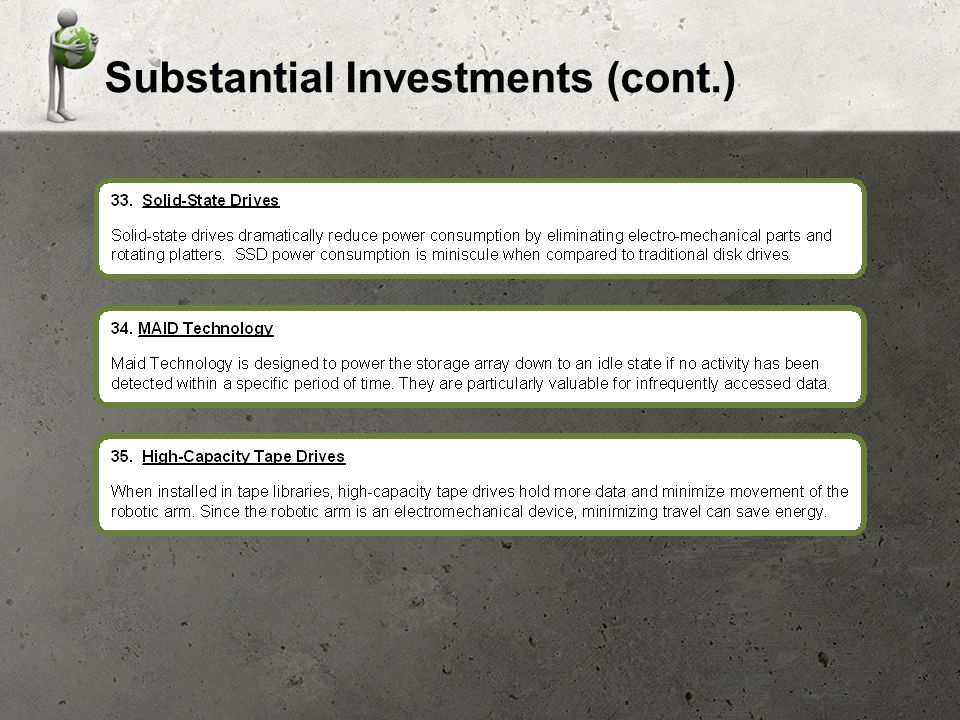
Substantial Investments (cont.)
")
43
Re-Architected Solutions

44
Re-Architected Solutions (cont.)
")
Similar presentations


 Grants Chapter 6.>")


