Download presentation
Presentation is loading. Please wait.

2
Table: Part-2 Scientific Writing

3
Please dont consider any of these suggestions to be substitutes for carefully thinking about your specific situation.

4
Outline: Table General considerations Building a table –Title –Headings Exercise

5
Table precise numeric values large numbers of related data Summarizing (list tables) complex information
 complex information")
6
Table/text ratio If a typical paper in the journal has an estimated text length of 3300 words accompanied by 4 tables, the ratio of tables to text is 4/3.3 thousand or 1.2 tables per one thousand words of text. If your paper has a text of about 4800 words, round this figure down to 4000. Then 4 x 1.2: 4.8 tables; in round numbers, 5 tables.

7
Table/text ratio A useful general rule is no more than I table (or illustration) per 1000 words of text. Because the average page of text in a manuscript with double spaced text and with l-inch (or 3-centimeter) margins usually runs to between 200 and 250 words, the rule can be stated roughly as no more than I table (or illustration) per 4 pages of manuscript text. Some journals may accept a larger number of tables in relation to text length, but many will not because of the resulting difficulties in avoiding confusing page layouts.
 margins usually runs to between 200 and 250 words, the rule can be stated roughly as no more than I table (or illustration) per 4 pages of manuscript text. Some journals may accept a larger number of tables in relation to text length, but many will not because of the resulting difficulties in avoiding confusing page layouts..")
8
dont use tables data can be summarized (text) relations or time sequence (graph)
 relations or time sequence (graph)")
9
options data can be summarized (text) relations or time sequence (graph) Readers want exact values (table)
 relations or time sequence (graph) Readers want exact values (table)")
10
Level of Exposure to Fine Particulate Matter and the Risk of Death from Cardiovascular Causes in Women.

11
Estimated Hazard Ratios for the Time to the First Cardiovascular Event or Death Associated with an Exposure Increase of 10 μg per Cubic Meter in the Level of Fine Particulate Matter (PM2.5).*
.*")
12
Changes in Glycated Hemoglobin and Fasting Plasma Glucose Levels during the 13-Week Study Period.

13
Plasma Aspartate Aminotransferase and Alanine Aminotransferase Concentrations during the Run-in Period, the Treatment Period and the Post-Treatment Follow-up Period

14
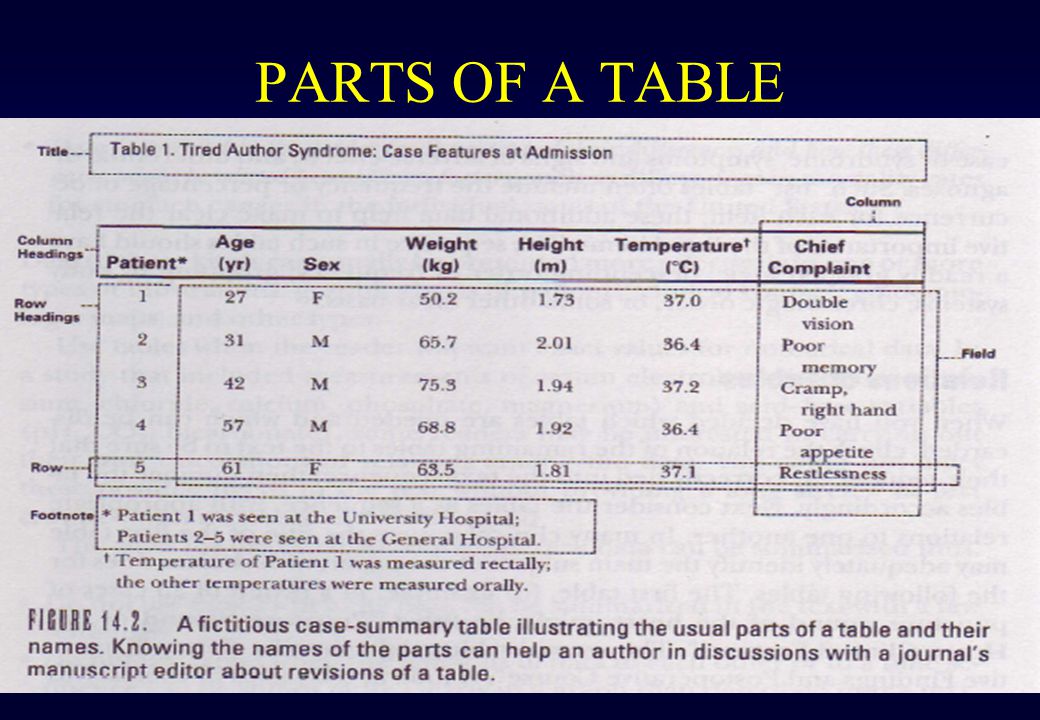
PARTS OF A TABLE

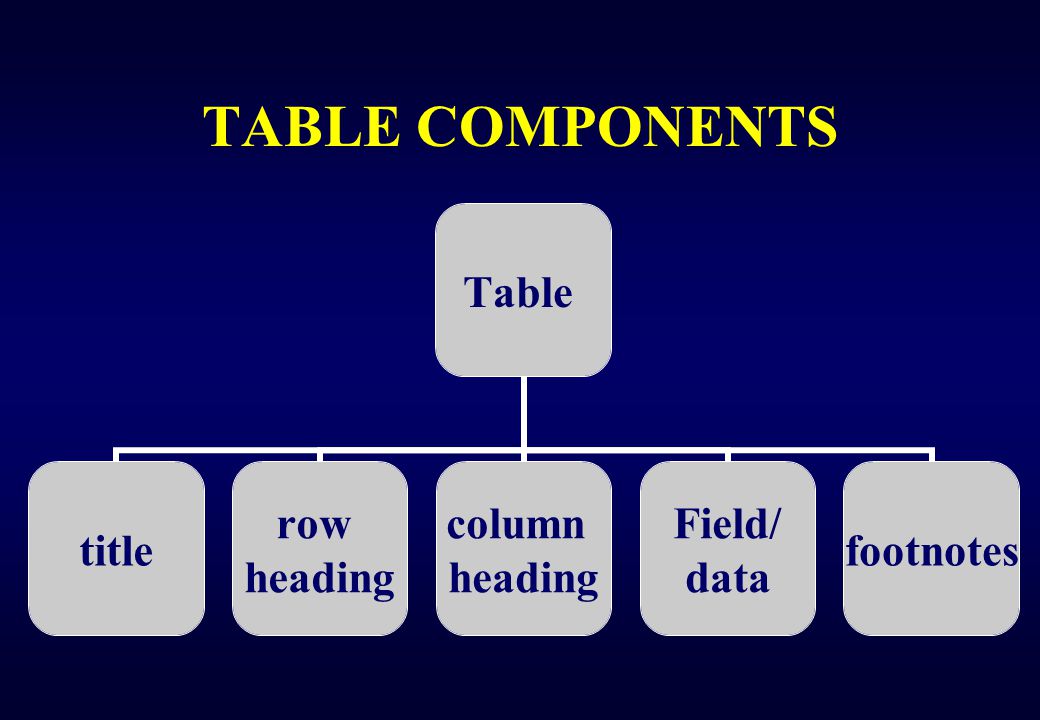
17
TABLE COMPONENTS Table title row heading column heading Field/ data footnotes

18
The tables All tables are basically structured the same way, with four main parts: 1.title, 2.column headings, 3.body, and 4.footnotes.

20
Building A table Title Column headings Row headings Fields Foot notes

21
The tables: title The title of a table, like the title of a figure, states –the topic or –the point

22
The tables: title The details included in a title depend on the type of table. For tables that give background information, the title should state the topic of the information listed in the body of the table (that is, the variables) and also the animal or population, the material described, or both. The form is: Y in Z or Y of Z.
 and also the animal or population, the material described, or both. The form is: Y in Z or Y of Z..")
23
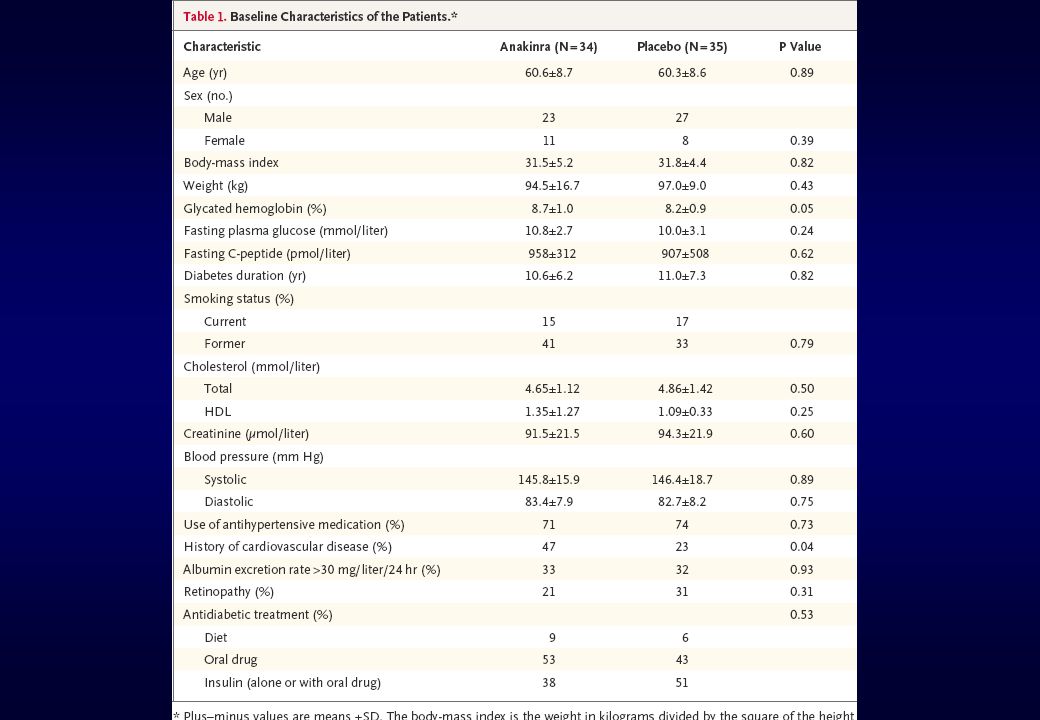
The tables title: Y in Z or Y of Z. For example, in the title of Table 1, Clinical Characteristics of the Infants, clinical characteristics is the topic (Y) and the infants (that is, the infants in the study) is the population described (Z).Table 1
 and the infants (that is, the infants in the study) is the population described (Z).Table 1.")
24
The tables: title In the title Phospholipid Composition of Cardiac Lymph from Normal Dogs, –phospholipid composition is the topic (Y), –cardiac lymph is the material described (Z), –normal dogs are the animals (Z).
, –cardiac lymph is the material described (Z), –normal dogs are the animals (Z).")
25
The tables: title For tables that present data from experiments that have only dependent variables, similar titles are appropriate. For example, in the title Dimensions of Cell Bodies in the Tracheal Ganglia of Ferrets, –dimensions is the topic (dependent variable) (Y), –cell bodies in the tracheal ganglia is the material described (Z), and –ferrets are the animals (Z).
 (Y), –cell bodies in the tracheal ganglia is the material described (Z), and –ferrets are the animals (Z)..")
26
The tables: title For tables that present data from experiments that have both independent and dependent variables, the title should state –the independent variable(s) (X), –the dependent variable(s) (Y), –the animal or population, the material described, or both (Z). It is not necessary to mention the controls in the title. Two standard forms for these titles are –Effect of X on Y in Z –Y during X in Z.

27
Find variables and pattern!

28
The tables title: Effect of X on Y in Z For example, in the title Effects of Methacholine on Electrical Properties and Ion Fluxes in Tracheal Epithelium From Cats and Ferrets, –methacholine is the independent variable, –electrical properties and ion fluxes are the dependent variables, –tracheal epithelium is the material, and –cats and ferrets are the animals. (See also the title for Table 2.)Table 2
Table 2.")
29
Find variables and pattern!

30
The tables title Y during X in Z. In the title Plasma Variables Before and After Protein Loss in Lambs, –plasma variables are the dependent variables, –before and after is used instead of during, –protein loss is the independent variable, and –lambs are the animals. (See also Table 3.)Table 3
Table 3.")
31
stating the point Even better than stating the topic in the title of the table is stating the point (narrowing down the TS). When the title states the point, the reader knows exactly what to look for in the table. For example, in the title Increase in Helicity of Abortifacient Proteins in the Presence of Sodium Dodecyl Sulfate, increase in helicity is the point. It is not usual due to multiple variables in tables

32
TITLE Topic Same as a broad TS Stating the Point Same as a narrow TS

33
category term To keep titles brief, use a category term instead of listing all the dependent variables. For example, in Table 3, hemodynamic variables is the category term for all the dependent variables in the table.Table 3

34
category term To ensure that the title relates clearly to the table, use the same key terms in the title as in the column headings, or use a category term in the title instead of two or more column headings. ?

35
category term For example: "Effects of inhalational anaesthetic X on systemic haemodynamics") in the title rather than repeating several column headings (for example, "Effects of inhalational anaesthetic X on arterial blood pressure, central venous pressure, cardiac output, and systemic vascular resistance".
 in the title rather than repeating several column headings (for example, Effects of inhalational anaesthetic X on arterial blood pressure, central venous pressure, cardiac output, and systemic vascular resistance .")
36
category term For example, in Table 1, infants in the title corresponds with infant in the first column heading, and clinical characteristics is a category term for the remaining column headings (sex, birth weight, gestational age, age at study, postconceptual age, diagnosis).Table 1
.Table 1")
37
BUITDING A TABTE: Title Example: consider a table summarizing in three groups of columns the admission diagnosis and roentgenographic and autopsy findings in 20 fatal cases of pulmonary embolism. Its column headings identify the nature of the findings as –"Admission Diagnosis", –"Chest Film", and –"Autopsy", and its row headings run down from "patient l " to "patient20".

38
BUITDING A TABTE: Title ANSWER: The table title can be simply "cases of Fatal Pulmonary Embolism" rather than "Twenty cases of Fatal Pulmonary Embolism: Admission Diagnosis, chest Film, and Autopsy Findings".

39
Category term?

40
Find a category term : Y in Z or Y of Z. Clinical and biochemical variables for all subjects and for those with an iGFR < or 60 ml/min per 1.73 m2

41
Find a category term Test characteristics for various markers of renal function for detecting moderate chronic kidney disease (iGFR cut- off of < 60 ml/min per 1.73 m2)
")
42
Find category term

43
The tables: title Keep the title brief, and ensure that it relates clearly to the content of the table. The title should be sufficiently descriptive to tell the reader what will appear in the table. "Results of the Study" is not good enough.

44
The tables: title Keep the title brief, and ensure that it relates clearly to the content of the table. The title should be sufficiently descriptive to tell the reader what will appear in the table. "Results of the Study" is not good enough.

45
The tables: title However, the title should not provide detailed background information or summarize or interpret the results ; these explanations are best given in the text. When several related tables are presented together, the context of the study should be included in the first, but it need not be repeated in the others if such repetition becomes tedious or requires too much space.

46
Relations of Tables Check the relation of the remaining tables to the text to be sure that their sequence is correctly tied into the text sequence; then number the tables accordingly. Next consider the tables as a sequence, with appropriate relations to one another.

47
Relations of Tables In many clinical papers the title of the first table may adequately identify the main subject of the paper, with shorter titles for the following tables. Example : The first table, for example, in a review of 25 cases of puncture wound of the heart, might be titled "puncture wound of the Heart: clinical Features". The second table might then be simply "operative Findings and Postoperative course". !

48
Relations of Tables A look-at the tables by themselves in the proposed sequence will help you judge whether the table, are understandable on their own (and they should be) and however their titles are related to one another.
 and however their titles are related to one another.")
49
The tables: title The rules on which words in a table title should be capitalized will vary from journal to journal. Look at the tables in the publication in which you are interested and style your table titles the same way.

50
Relations of tables TitleSequence

51
TITLE Use Variables Stating the Point Use Category terms

52
TITLE Background Topic Y in Z orY of Z. One variable Y in Z orY of Z. Two variable Effect of X on Y in Z Y during X in Z.

53
Name of table needs details? Foot note Specific/clear Need not details? Title

54
Which title is more satisfactory? Topic-point-variable Characteristics of patients –But usual in base line characteristics table! Baseline characteristics of patients –ok Comparison between group one and two –Not ok Predictors of quality of life –Not ok Baseline Characteristics of the Subjects and Outcome at 6 Months –ok the independent variable(s) (X), the dependent variable(s) (Y), the animal or population, the material described, or both (Z).
 (X), the dependent variable(s) (Y), the animal or population, the material described, or both (Z)..")
55
The tables: title the independent variable(s) (X), the dependent variable(s) (Y), the animal or population, the material described, or both (Z).
 (X), the dependent variable(s) (Y), the animal or population, the material described, or both (Z).")
56
The tables: title Use identical key terms in the title and column headings, or use a category term.

57
Better title?

58
Exercise : Checklist Title: Need refer back to the text : group Vs given name Topic or point the independent variable(s) (X), the dependent variable(s) (Y), the animal or population, the material described, or both (Z). category term

59
Building A table Title Column headings Row headings FieldsDates Foot notes

60
Column Headings Column headings consist of: 1.headings that identify the items listed in the columns below them, 2.subheadings as necessary, and 3.units of measurement as necessary. Column headings should be brief.

61
Headings There are two main groups of headings, corresponding to the two main groups of information in the body of the table: 1.the items for which data are given, in one or more columns on the left side of the table, and 2.the data, in one or more columns on the right. In tables for experiments that have both independent and dependent variables, the independent variable(s) are in the column(s) on the left and the dependent variable(s) are in the column(s) on the right, as in Tables 2,3,4 and 5. Tables 2345
 are in the column(s) on the left and the dependent variable(s) are in the column(s) on the right, as in Tables 2,3,4 and 5. Tables")
62
Headings For example, in Table 3, the column labeled Ventilatory condition is the independent variable and the remaining columns are the dependent variables.Table 3

63
Headings In Table 4, the columns labeled Incubation conditions and Sample describe the independent variable and the remaining columns are the dependent variable.Table 4

64
Column and row heading should use terms that appear in the text Readers enter a table through column and row headings; thus, familiar terms in headings (terms also used in the text) are usually more effective than unfamiliar terms.
 are usually more effective than unfamiliar terms.")
65
Column and row heading should use terms that appear in the text A common source of confusion is the inconsistent use of terms for study groups anywhere in the text. For example, authors may speak of a study's: –participants, –patients, –survivors, –individuals, –subjects, –volunteers, and so on.

66
Column and row heading should use terms that appear in the text They may speak of the –treatment, –intervention, or –active group, and of the –placebo, –control, –untreated, or – inactive group. Consistency is usually more important than the specific term chosen.

70
Headings The headings within a table should be informative. Avoid using terms such as group A, group B, group C, etc.: This makes readers constantly refer back to the text to remind themselves what group A means.

71
Headings Instead, use a brief phrase that summarizes group A's characteristics (e.g., cirrhotic, steroid- dependent), which can be described in greater detail in the text. Column headings, including the one that describes what will appear in the rows, should be easy to distinguish (e.g., italicized).
..")
72
Headings The column headings should reflect the comparisons of primary interest. If, for example, the purpose of the table is to show how a particular measurement changed over time, then the different times (baseline, week 1, and week 6) should be the column headings. If the primary comparison is between groups (smokers and nonsmokers), then the groups will be the column headings.
 should be the column headings. If the primary comparison is between groups (smokers and nonsmokers), then the groups will be the column headings..")
73
Headings Each type of information should have its own vertical column, and each column should have its own heading. Do not combine two types of information in one column. For example, under a column headed Drug, only the names of the drugs should appear, not both the drugs and the doses. Do not omit the heading that states the name of the first column on the left.!

74
Headings The first column heading almost always contains a description of what appears in each row. As much as possible, put units in parentheses immediately after the row descriptions. The meaning of every item in a table should be obvious; the reader should not have to refer back to the text (logic).
..")
75
Headings The Problem?

76
Headings For example, in Table 3, the first column on the left (the independent variable) needs a heading (Ventilation condition) just as the other columns (the dependent variables) do.Table 3
 needs a heading (Ventilation condition) just as the other columns (the dependent variables) do.Table 3")
77
Headings Do not omit the column heading that states the name of the dependent variable [for example, Recovery (%) in Table 5], even in simple tables that have only one dependent variable that is named in the title.Table 5 It is clearest for the reader if the dependent variable is named both in the title and in the column headings. !?
![Headings Do not omit the column heading that states the name of the dependent variable [for example, Recovery (%) in Table 5], even in simple tables that have only one dependent variable that is named in the title.Table 5 It is clearest for the reader if the dependent variable is named both in the title and in the column headings.](http://images.slideplayer.com/7/1649802/slides/slide_77.jpg "! .")
78
Headings For example, in a table titled Effects of Enzymes on Antibody Reactivity, the column headings should not be merely Enzyme, 4E4, 3F11, 4D4, 4D8. The last four headings, which are names of antibodies, should be subheadings under Antibody Reactivity (% of control), because the data in the columns are antibody reactivity, not types of antibodies.
, because the data in the columns are antibody reactivity, not types of antibodies..")
79
Headings In addition to the column headings and columns for the independent and dependent variables, a third column heading and column can be given: sample size (n) (see Table 2, Number of explants).Table 2
 (see Table 2, Number of explants).Table 2")
80
size of subject Some journals prefer that the size of subject populations be included in the title, others that this information be listed under the column heading.

81
Subheadings When necessary, subheadings can be used to subdivide a heading into two or more categories. For example, in the column heading the dependent variable and the unit of measurement are in the main heading and two sites in which this variable was measured are in the subheadings. (See also Tables 2, 4, and 5.)Tables 245 Note that terms in column headings and subheadings are singular, not plural (for example, Recovery, not Recoveries).
Tables 245 Note that terms in column headings and subheadings are singular, not plural (for example, Recovery, not Recoveries)..")
84
lf necessary, number columns or rows to help integrate the text and the table. A table can sometimes require extensive explanations in the text, and extensive explanations in the text sometimes require frequent reference to a table. In such cases, it can be helpful to number the column or row heads to help readers find their place in the table faster (Table 20.24; see also the discussion of age adjustment in Chapter 12).
..")
85
lf necessary, number columns or rows to help integrate the text and the table.

86
Column Headings Each column heading for numerical data should include the unit of measure for the data. That unit should apply to all data under the heading. Another unit of measure (and corresponding data) should not be used farther down in the column.
 should not be used farther down in the column..")
87
Column Headings Rather than forcing the reader to take note of a second kind of unit in a single column, restructure the table to accommodate the second kind of unit and its accompanying data in another column. Example:

88
Column Headings If groups of columns logically belong together, label them with a grouped-column heading and place a heading straddle-rule over the column headings to which it applies. The straddle rule will eliminate any uncertainty about which column headings are included under the grouped-column heading.

89
Exercise : Checklist Title: Informative without text: group Vs given name Topic or point the independent variable(s) (X), the dependent variable(s) (Y), the animal or population, the material described, or both (Z). category term Headings Dependent and independent variables Similar to the text Informative

90
Thank you

Similar presentations


![Microsoft ® Office Excel ® 2007 Training Get started with PivotTable ® reports [Your company name] presents:](/16/5093036/big_thumb.jpg "Microsoft ® Office Excel ® 2007 Training Get started with PivotTable ® reports [Your company name] presents:>")


