Download presentation
Presentation is loading. Please wait.

1
Andrea M Girman, MD, MPH VOMA 27 April 2012
The Continuum of PreD: Guiding Diagnosis & Treatment of Progression to Diabetes Andrea M Girman, MD, MPH VOMA 27 April 2012

2
that constitute the subject of this presentation: NA/Non-Clinical
The Continuum of PreD: Guiding Diagnosis & Treatment of Progression to Diabetes Andrea M. Girman, MD, MPH The following potential conflict of interest relationships are germane to my presentation: Equipment: None Speakers Bureau: None Stock Shareholder: None Grant/Research Support: None Consultant: None Employment: Genova Diagnostics Status of FDA devices used for the material being presented: NA/Non-Clinical Status of off-label use of devices, drugs or other materials that constitute the subject of this presentation: NA/Non-Clinical

3
Continuum of PreD: Conversation Goals
Examine the focus on obesity as major identifier of people at risk for Type 2 DM Identify an underlying driver of progression to Type 2 Diabetes: Inflammation Define the Stages of Pre-Diabetes progression Consider Stage-specific Therapeutic Interventions ~ Lifestyle +/- Meds

4
Challenging Assumptions
Obesity: Challenging Assumptions Many clinicians assume that they can accurately predict patient risk for diabetes based on obesity. If this is true, are tests designed to assess risk of diabetes really needed?

5
Defining Overweight/Obesity

6
Overweight/Obesity Worldwide % Population (2007)
New Zealand 62.6% United Kingdom 61.0% Iceland 60.2% Luxembourg 54.8% Ireland 51% Finland 48.9% Canada 46.8% Slovak Republic 46.2% Italy 45.5% Netherlands Sweden 44.0% Switzerland 37.3% Notes: 1. Source: Organisation for Economic Co-operation and Development (OECD) Health Data Frequently Requested Data 2.Overweight is defined as a BMI between 25 and 30 kg/m² (25≤ BMI <30 kg/m²) which is same as the HSE. 3.Obesity is defined as a BMI of 30 kg/m² or more (BMI ≥30 kg/m²). 4. Data for Luxembourg, New Zealand, Slovak Republic and the United Kingdom are based on actual height and weight measurements rather than self-reported data.
 Health Data Frequently Requested Data. 2.Overweight is defined as a BMI between 25 and 30 kg/m² (25≤ BMI <30 kg/m²) which is same as the HSE. 3.Obesity is defined as a BMI of 30 kg/m² or more (BMI ≥30 kg/m²). 4. Data for Luxembourg, New Zealand, Slovak Republic and the United Kingdom are based on actual height and weight measurements rather than self-reported data.")
7
Obesity Trends* Among U.S. Adults BRFSS, 1990, 2000, 2010
No Data <10% %–14% %–19% %–24% %–29% ≥30%

8
Rates of CardioMetabolic Syndrome
BMI < 25 BMI 25-30 BMI >30 MEN 30% 51% 71% WOMEN 21% 43% 65% TOTAL 26% 46% 68% Rates of CardioMetabolic Syndrome

9
CDC: Only 40% of the risk of developing diabetes occurs in people who are obese.
How do we find the 60% of people at risk for developing diabetes who are NOT obese?

10
PreD Assessment & Clinical Utility
Identify patients who are at risk for diabetes & who are not obese Define that individual’s stage of progression to Type 2 Diabetes (i.e. Insulin Resistance/Cardio-Metabolic Syndrome) Provide stage-specific therapeutic interventions.
 Provide stage-specific therapeutic interventions.")
11
The Significance of Type 2 Diabetes Mellitus
According to the CDC, 10% of the US population has diabetes today. By the year 2050, the CDC projects that % will be diagnosed with diabetes. This will lead to a 2-4x increase in health care costs, or approximately $171 billion per year.

12
Elementary: In order to live, cells need to burn fuel for energy & the preferred fuel is glucose. Insulin from the pancreas binds to cell receptor sites -> allows glucose to enter the cell & be used for energy. Inflammation can lead to insulin resistance -> glucose levels increase in the blood. Cells still need fuel -> fats are broken down and mobilized through lipolysis.

13
Type 2 DM Pathophysiology
Initial compensation of IR by increased pancreatic β-cell insulin secretion Lifestyle considerations leading to IR Insulin drives differentiation of mesenchymal stem cells into pre-adipocytes and adipose tissue Concomitant qualitative β-cell dysfunction as cellular cleavage capacity of proinsulin to insulin exhausted Added adipogenic effect of proinsulin Pfutzner A, et al A Biomarker Concept for Assessment of Insulin Resistance , β-Cell Function and Chronic Systemic Inflammation in Type 2 Diabetes Mellitus. Clin Lab 2008; 54:

14
Type 2 DM Pathophysiology
Increased hormonal secretion & increased caloric intake = increased production of visceral adipose tissue Visceral adipose tissue is metabolically active Cytokines (adipokines) which negatively influence IR Supression of adiponectin secretion by mature adipose tissue = increased visceral adipose production, increased IR, decreased vasoprotective and anti-atherosclerotic effects
 which negatively influence IR. Supression of adiponectin secretion by mature adipose tissue = increased visceral adipose production, increased IR, decreased vasoprotective and anti-atherosclerotic effects.")
15
Pfutzner A, et al A Biomarker Concept for Assessment of Insulin Resistance , β-Cell Function and Chronic Systemic Inflammation in Type 2 Diabetes Mellitus. Clin Lab 2008; 54:

16
.

17
PreD Guide

18
Inflammation is an underlying driver of the progression to diabetes.
Strongly Agree Agree Disagree Strongly Disagree Answer Now Countdown 4

19
Inflammation: Driving the Progression 2 Diabetes

20
Inflammation & Chronic Disease
Story of Pier’s friend - tried all - stapling but no change till gluten - and inflammation

21
Abdominal Obesity Diabetes Mellitus Heart Disease Dysglycemia
Dyslipidemia Hypertension

22
Abdominal Obesity Insulin Resistance
Diabetes Mellitus Heart Disease Abdominal Obesity Insulin Resistance Dysglycemia Dyslipidemia Hypertension

23
Inflammation Abdominal Obesity Insulin Resistance Diabetes Mellitus
Heart Disease Abdominal Obesity Inflammation Insulin Resistance Dysglycemia Dyslipidemia Hypertension

24
Causes of Inflammation
Diet Sugar Trans & saturated fats Polyunsaturated omega 6 oils (except GLA) Allergens (food & environmental) Stress Lack of exercise Toxins (metals, petrochemicals) Infections (especially dental/gingivitis) Obesity & Insulin Resistance
 Allergens (food & environmental) Stress. Lack of exercise. Toxins (metals, petrochemicals) Infections (especially dental/gingivitis) Obesity & Insulin Resistance.")
25
Inflammation: A Critical Underlying Driver
Inflammation is a major driver of the progression to diabetes through each stage. “Inflammation causes insulin resistance . . .” – Jerrald M. Olefsky, MD The use of multiple inflammatory markers provides greater insight into the effects of inflammation -> one marker for inflammation may not provide a full clinical picture. Olefsky Faculty of the Division of Endocrinology & Metabolism UCSD Associate Dean for Scientific Affairs and Professor of Medicine ‘Clinical investigation approaches include studies aimed at identifying in vivo mechanisms underlying the pathogenesis of non-insulin dependent diabetes mellitus, obesity, and other disorders of insulin resistance.’

26
Markers of Inflammation
hs-CRP Acute phase response protein/IR Interleukin IL-6 Inflammatory cytokine/abdominal obesity Interleukin IL-8 Tumor Necrosis Factor Alpha (TNFα) Plasminogen Activator Inhibitor 1 (PAI-1) Acute phase response protein/visceral obesity Survey of peer-reviewed literature = most well-validated for relationship of risk to Type 2 DM
 Plasminogen Activator Inhibitor 1 (PAI-1) Acute phase response protein/visceral obesity. Survey of peer-reviewed literature = most well-validated for relationship of risk to Type 2 DM.")
27
hs-CRP: Risk Factor for CVD
Kuller MRFIT CHD death Ridker PHS MI Ridker PHS Stroke Tracy CHS/RHPP CHD Ridker PHS1998, PAD Ridker WHS 1998,2000, CVD Koenig MONICA CHD Roivainen HELSINKI CHD Mendall CAERPHILLY CHD Danesh BRITAIN CHD Gussekloo LEIDEN Fatal Stroke Lowe SPEEDWELL CHD Packard WOSCOPS CV Events Ridker AFCAPS CV Events Rost FHS Stroke Pradhan WHI MI, CVD death Albert PHS Sudden Death Relative Risk (upper versus lower quartile) Ridker PM. Circulation 2003;107:
 Ridker PM. Circulation 2003;107:")
28
C-Reactive Protein Marker of inflammation, infection and injury
Aspirin’s reduction of MI risk appears to be related to CRP levels CRP activates complement which injures the inner layer of blood vessels constriction of vessels, arrhythmia Strong predictor of the risk of future MI JUPITER Study – November, 2008 49% decrease in CAD end-points 20% decrease in ‘all cause’ mortality ‘40% of participants had insulin resistance’ © Dr. Mary James and GSDL 2003

29
Inflammation & Risk of T2DM

31
Stages of Progression 2 Diabetes

32
Progression of Pre-Diabetes

33
Intervention = Maintenance of healthy diet & lifestyle
Optimal Function Intervention = Maintenance of healthy diet & lifestyle

34
Stage 1: Early Insulin Resistance

35
Adiponectin Protective adipose-derived protein
Plays an important role in regulating glucose and lipid metabolism Moderates fat tissue Promotes insulin sensitivity Is inversely related to glucose & insulin Decreases hepatic glucose & lipid production Protects against atherosclerosis by suppressing vascular inflammation (anti-inflammatory) (refer to my notes on Drid S article)
 (refer to my notes on Drid S article)")
36
Low Adiponectin associated with:
Insulin resistance Glucose intolerance Dyslipidemia Increased risk of vascular injury & atherosclerosis Increased risk of diabetes mellitus Inflammation (refer to my notes on Drid S article)
")
37
Stage 1: Early Insulin Resistance
Pattern recognition: LOW Adiponectin ‘Normal’ Glucose, HbA1C, Insulin, and Proinsulin Normal or slightly high HOMA-IR Treat with diet, lifestyle, supplementation. “Normal” fasting blood sugar = < 100 mg/dL Blood sugar >87 mg/dL = progressive increase of type 2 DM. Blood sugar < 81 mg/dL = low risk of DM NEJM 2005;353:

38
Stage 1 – Early Insulin Resistance
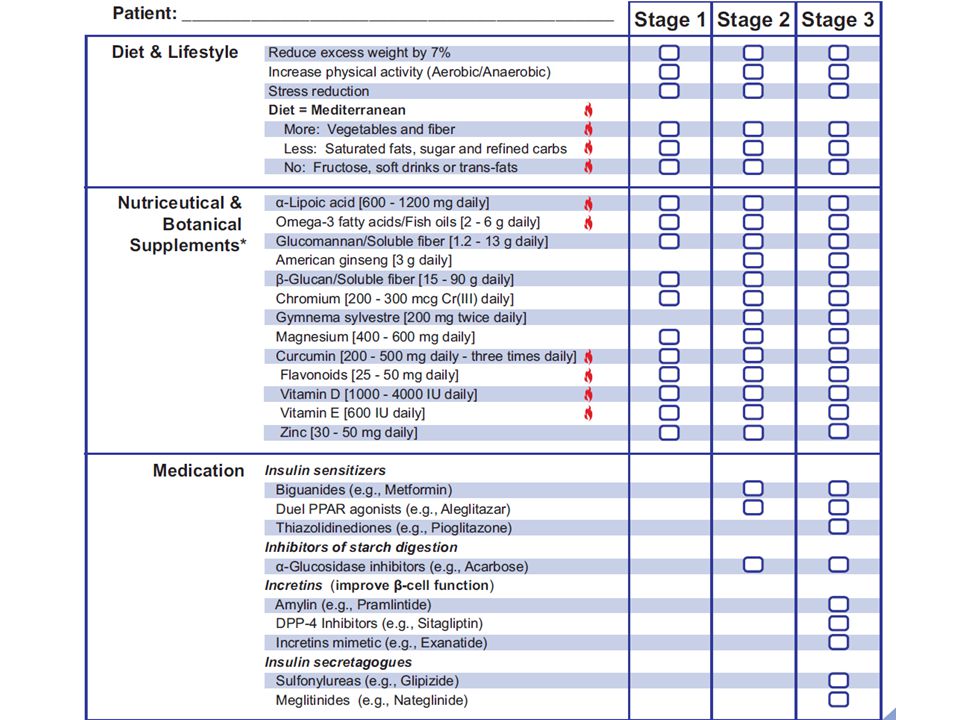
Stage 1 of metabolic dysglycemia represents early insulin resistance, with adequate pancreatic beta cell compensation to maintain normal glucose. Insulin level may be normal or high. Adiponectin, which provides protection against insulin resistance, diabetes and cardiovascular disease, is typically low. Dyslipidemia may or may not be present, including elevated triglycerides and LDL-C, and/or low HDL-C. At this stage, dietary and lifestyle measures are usually adequate for improving insulin sensitivity and preventing progression to Stage 2. Treatment recommendations for Stage 1: Medication considerations Lifestyle considerations Dietary considerations Supplement considerations Minimize sugar and refined carbohydrates, fructose, soft drinks, and saturated fats. Avoid trans fats. Emphasize a low-saturated fat, Mediterranean-type diet (complex carbohydrates, fresh fruits and vegetables, nuts & other monounsaturates, foods rich in omega-3 fats, such as cold water fish). Nutritional: B vitamins, vitamin D, biotin, magnesium, zinc, chromium, alpha-lipoic acid & other antioxidants, fish oils; Herbal: Green tea, cinnamon, fenugreek; Hormonal: DHEA (if low) Reduce excess weight; Increase physical activity; Reduce stress ; Treat inflammatory disorders (TNF-α inhibits adiponectin) Meds are not usually needed at this stage if dietary and lifestyle measures are followed.
. Nutritional: B vitamins, vitamin D, biotin, magnesium, zinc, chromium, alpha-lipoic acid & other antioxidants, fish oils; Herbal: Green tea, cinnamon, fenugreek; Hormonal: DHEA (if low) Reduce excess weight; Increase physical activity; Reduce stress ; Treat inflammatory disorders (TNF-α inhibits adiponectin) Meds are not usually needed at this stage if dietary and lifestyle measures are followed.")
39
Stage 2: Elevated Fasting Insulin

40
Stage 2: Elevated Fasting Insulin
Pattern recognition: LOW Adiponectin HIGH or high-normal HOMA-IR HIGH Insulin, but normal Proinsulin Mildly elevated glucose and/or HbA1C Fasting glucose mg/dl and/or 2-hr pp glucose mg/dl and/or HbA1C % Usually due to a combination of insulin resistance & early beta-cell impairment 24 million cases of type 2 DM in the U.S., but 57 million cases of ‘pre-diabetes’ Treat with diet, lifestyle, supplementation, possible pharmacotherapy. (Cases of DM and prediabetes): Garber AJ ‘08/ : “Diagnosis and management of prediabetes in the continuum of hyperglycemia: when do the risks of diabetes begin? A consensus statement from the American College of Endocrinology and the American Association of Clinical Endocrinologists.”– article available for $12.
: Garber AJ ‘08/ : Diagnosis and management of prediabetes in the continuum of hyperglycemia: when do the risks of diabetes begin A consensus statement from the American College of Endocrinology and the American Association of Clinical Endocrinologists. – article available for $12.")
41
Stage 2 – Elevated Fasting Insulin Treat any inflammatory disorders
Stage 2 represents impaired glucose tolerance, usually due to combination of insulin resistance and early pancreatic beta-cell impairment. In most cases of insulin resistance, compensatory increased insulin secretion is sufficient to prevent hyperglycemia. However, in combination with beta-cell dysfunction, hyperglycemia can develop.1 Adiponectin is usually low, and glucose and/or HbA1C are elevated, although not yet to a diabetic level. Insulin is usually elevated. Dyslipidemia may or may not be present, including elevated triglycerides and LDL-C, and/or low HDL-C. At this stage, diet and lifestyle measures, along with supplementation can help improve insulin sensitivity, restore proper glucose regulation, and prevent progression to diabetes (Stage 3). Treatment recommendations for Stage 2 Supplement considerations Lifestyle considerations Dietary considerations Medication considerations Avoid sugar and refined carbohydrates, fructose, soft drinks, alcohol, and trans fats. Minimize saturated fats. Emphasize a high-fiber, low-saturated fat, Mediterranean-type diet (e.g., legumes and whole grains, fresh fruits and vegetables, nuts & other monounsaturates, foods rich in omega-3 fats, such as cold water fish). Nutritional: B vitamins, vitamin D, biotin, Mg, Zn, Cr, α-lipoic acid & other antioxidants, flavonoids (e.g., grape seed extract), fish oils, fiber supplement; Herbal: Gymnema sylvestre, green tea, cinnamon, fenugreek; Hormonal: DHEA (if low) Insulin sensitizers: Biguanides (e.g., metformin); Dual PPAR agonists (e.g., aleglitazar); Inhibitors of starch digestion: α-Glucosidase inhibitors (e.g., acarbose); Improvement of HbA1C: DPP-4 Inhibitors (e.g., sitagliptin) or Pramlintide Reduce weight; Increase physical activity (esp. aerobic); Reduce stress; Treat any inflammatory disorders
. Treatment recommendations for Stage 2. Supplement considerations. Lifestyle considerations. Dietary considerations. Medication considerations. Avoid sugar and refined carbohydrates, fructose, soft drinks, alcohol, and trans fats. Minimize saturated fats. Emphasize a high-fiber, low-saturated fat, Mediterranean-type diet (e.g., legumes and whole grains, fresh fruits and vegetables, nuts & other monounsaturates, foods rich in omega-3 fats, such as cold water fish). Nutritional: B vitamins, vitamin D, biotin, Mg, Zn, Cr, α-lipoic acid & other antioxidants, flavonoids (e.g., grape seed extract), fish oils, fiber supplement; Herbal: Gymnema sylvestre, green tea, cinnamon, fenugreek; Hormonal: DHEA (if low) Insulin sensitizers: Biguanides (e.g., metformin); Dual PPAR agonists (e.g., aleglitazar); Inhibitors of starch digestion: α-Glucosidase inhibitors (e.g., acarbose); Improvement of HbA1C: DPP-4 Inhibitors (e.g., sitagliptin) or Pramlintide. Reduce weight; Increase physical activity (esp. aerobic); Reduce stress; Treat any inflammatory disorders.")
42
Stage 3: Elevated Proinsulin

43
Proinsulin Produced by pancreatic β-cells Precursor to insulin
Serves as a marker of later stage β-cell dysfunction & insulin resistance Has been used in trials (proinsulin/insulin ratio) to describe improved β-cell function resulting from β-cell sensitizing meds (ie, biguanides/Metformin, TZDs/Actose)
 to describe improved β-cell function resulting from β-cell sensitizing meds (ie, biguanides/Metformin, TZDs/Actose)")
44
Proinsulin β-cell dysfunction impaired cleavage of proinsulin to insulin levels of proinsulin increase Higher circulating levels of circulating proinsulin (compared to insulin) indicate advancing β-cell dysfunction & increased risk or presence of diabetes. With advancing pre-diabetes, levels of both insulin & proinsulin decline.
 indicate advancing β-cell dysfunction & increased risk or presence of diabetes. With advancing pre-diabetes, levels of both insulin & proinsulin decline.")
45
Stage 3: Elevated Proinsulin
Pattern recognition: LOW Adiponectin HIGH Insulin & Elevated Proinsulin HIGH HOMA-IR HIGH Glucose & HbA1C May or may not meet ADA definition for Type 2 Diabetes Mellitus Fasting Glucose > 125 mg/dL HgbA1c > 6.5% Treat with diet, lifestyle, supplementation, and pharmacotherapy.

46
Stage 3 – Elevated Pro-Insulin Treat any inflammatory disorders
Stage 3 represents the development of diabetes, with insulin resistance and progressive pancreatic beta-cell impairment. Beta-cell dysfunction can result from glucose toxicity, inflammatory cytokines, oxidative stress, and/or lipotoxicity in the presence of excess glucose.1,2 Glucose and HbA1C are significantly elevated, and insulin may or may not be elevated, depending on beta-cell capacity to produce adequate insulin. Sequential measurements can help reveal the degree of beta-cell dysfunction; declining insulin along with increasing proinsulin signifies late-stage impairment. The most important therapeutic goal at this stage is to normalize and maintain normal blood glucose levels.3 At this stage, a comprehensive approach is essential, including diet and lifestyle measures, supplementation, and targeted pharmaceuticals, based on the degree of beta-cell impairment. Treatment recommendations for Stage 3 Lifestyle considerations Dietary considerations Supplement considerations Medication considerations Avoid sugar and refined carbohydrates, fructose, soft drinks, alcohol, and trans fats. Minimize saturated fats. Emphasize a high-fiber, low-saturated fat, Mediterranean-type diet (e.g., legumes and whole grains, fresh fruits and veggies, nuts & other monounsaturates, foods rich in omega-3 fats, such as cold water fish). Nutritional: B vitamins (esp. niacinamide, B6, B12, folate), vitamin D, biotin, Mg, Zn, Cr, V, antioxidants (e.g., NAC, vitamins C, E, α-lipoic acid, Se), flavonoids (e.g., grape seed, bilberry), fish oils, fiber supplement, carnosine; Herbal: Gymnema, green tea, cinnamon, fenugreek, maitake, American or Panax ginseng, rehmannia, scutellaria Insulin sensitizers: Thiazolidinediones (e.g., pioglitazone); Biguanides (e.g., metformin); Dual PPAR agonists (e.g., aleglitazar); Inhibitors of starch digestion: α-Glucosidase inhibitors (e.g., acarbose); Improvement of HbA1C: DPP-4 Inhibitors (e.g., sitagliptin) or Pramlintide; AGE Inhibitor: Aminoguanidine; Insulin secretagogues: Sulfonylureas (e.g., glipizide); Meglitinides; exanatide; Insulin & K channel openers Reduce weight; Increase physical activity (esp. aerobic); Reduce stress; Treat any inflammatory disorders
. Nutritional: B vitamins (esp. niacinamide, B6, B12, folate), vitamin D, biotin, Mg, Zn, Cr, V, antioxidants (e.g., NAC, vitamins C, E, α-lipoic acid, Se), flavonoids (e.g., grape seed, bilberry), fish oils, fiber supplement, carnosine; Herbal: Gymnema, green tea, cinnamon, fenugreek, maitake, American or Panax ginseng, rehmannia, scutellaria. Insulin sensitizers: Thiazolidinediones (e.g., pioglitazone); Biguanides (e.g., metformin); Dual PPAR agonists (e.g., aleglitazar); Inhibitors of starch digestion: α-Glucosidase inhibitors (e.g., acarbose); Improvement of HbA1C: DPP-4 Inhibitors (e.g., sitagliptin) or Pramlintide; AGE Inhibitor: Aminoguanidine; Insulin secretagogues: Sulfonylureas (e.g., glipizide); Meglitinides; exanatide; Insulin & K channel openers. Reduce weight; Increase physical activity (esp. aerobic); Reduce stress; Treat any inflammatory disorders.")
47
Metabolic Markers

48
PreD Guide

49
Hemoglobin A1c (HbA1c) Measures the amount of hemoglobin in a red blood cell (RBC) that has been glycated by excess glucose. Reflects average glucose concentration during the previous 3 month period ~ the life cycle of the RBC.

50
HOMA-IR Homeostatic Model Assessment- Insulin Resistance
Calculation based on plasma levels of: Fasting Glucose & Insulin Non-invasive, mathematical estimate insulin resistance This model correlated well with estimates using the euglycemic clamp method (r = 0.88).[7] The authors have tested HOMA extensively against other measures of insulin resistance (or its reciprocal, insulin sensitivity) and β-cell function. HOMA-IR = FBG x insulin/405
.[7] The authors have tested HOMA extensively against other measures of insulin resistance (or its reciprocal, insulin sensitivity) and β-cell function. HOMA-IR = FBG x insulin/405.")
51
C-Peptide C-peptide is produced when proinsulin is cleaved to form insulin and C-peptide. Increased levels of C-peptide reflect insulin resistance.

52
Conversion of Proinsulin to Insulin
(cleavage) Mature insulin has 35 fewer amino acids; 4 are removed altogether, and the remaining 31 form the C-peptide. The C-peptide is abstracted from the center of the proinsulin sequence; the two other ends (the B chain and A chain) remain connected by disulfide bonds. Diagram representing the human preproinsulin molecule showing location of mutations causing ND. The amino acid residues in the signal peptide are indicated in green, the B chain in red, the C-peptide in orange, and the A chain in blue. The dashed circles indicate the basic residues that are the cleavage site for conversion from proinsulin to insulin. The mutations are noted in black circles together with location in the B or A chain. (Støy J et al. PNAS 2007;104: ) (cleavage) ©2007 by National Academy of Sciences
 Mature insulin has 35 fewer amino acids; 4 are removed altogether, and the remaining 31 form the C-peptide. The C-peptide is abstracted from the center of the proinsulin sequence; the two other ends (the B chain and A chain) remain connected by disulfide bonds. Diagram representing the human preproinsulin molecule showing location of mutations causing ND. The amino acid residues in the signal peptide are indicated in green, the B chain in red, the C-peptide in orange, and the A chain in blue. The dashed circles indicate the basic residues that are the cleavage site for conversion from proinsulin to insulin. The mutations are noted in black circles together with location in the B or A chain. (Støy J et al. PNAS 2007;104: ) (cleavage) ©2007 by National Academy of Sciences.")
53
Leptin Leptin is an adipocyte-derived hormone that regulates appetite.
In a healthy body, overeating induces leptin production which suppresses appetite and controls weight gain. Leptin is protective against obesity.

54
Elevation of Leptin Indicates leptin resistance (interference with leptin signaling) Associated with: High BMI & abdominal obesity Pancreatic beta-cell damage High triglycerides & Low HDL-C

55
Case Study

56
48 yo woman with good diet/lifestyle habits, perimenopausal & noting mid-section weight gain. Concern as diffuse family h/o Type 2 DM.

58
Key Points on Progression to Diabetes
Can be prevented Can be reversed Can be treated effectively Metabolic processes may be present when the patient is not yet symptomatic.

59
Obesity: Final Considerations
Obesity remains a major clinical concern. Insulin resistance is a major cause of obesity (at least 70%). Diabetes Prevention Program trial showed 58% reduction in incidence of T2DM with lifestyle modifications. 5-10% reduction in body weight improves insulin sensitivity, lipid profiles, endothelial function, reduces thrombosis and inflammatory markers. There is a 3-fold increase in the odds that a patient will attempt weight loss if it is recommended by a trusted health care professional. N Engl J Med Feb 7;346(6): Reduction in the incidence of type 2 diabetes with lifestyle intervention or metformin. Knowler WC, Barrett-Connor E, Fowler SE, Hamman RF, Lachin JM, Walker EA, Nathan DM; Diabetes Prevention Program Research Group. Source Diabetes Prevention Program Coordinating Center, Biostatistics Center, George Washington University, 6110 Executive Blvd., Suite 750, Rockville, MD 20852, USA. Abstract BACKGROUND: Type 2 diabetes affects approximately 8 percent of adults in the United States. Some risk factors--elevated plasma glucose concentrations in the fasting state and after an oral glucose load, overweight, and a sedentary lifestyle--are potentially reversible. We hypothesized that modifying these factors with a lifestyle-intervention program or the administration of metformin would prevent or delay the development of diabetes. METHODS: We randomly assigned 3234 nondiabetic persons with elevated fasting and post-load plasma glucose concentrations to placebo, metformin (850 mg twice daily), or a lifestyle-modification program with the goals of at least a 7 percent weight loss and at least 150 minutes of physical activity per week. The mean age of the participants was 51 years, and the mean body-mass index (the weight in kilograms divided by the square of the height in meters) was 34.0; 68 percent were women, and 45 percent were members of minority groups. RESULTS: The average follow-up was 2.8 years. The incidence of diabetes was 11.0, 7.8, and 4.8 cases per 100 person-years in the placebo, metformin, and lifestyle groups, respectively. The lifestyle intervention reduced the incidence by 58 percent (95 percent confidence interval, 48 to 66 percent) and metformin by 31 percent (95 percent confidence interval, 17 to 43 percent), as compared with placebo; the lifestyle intervention was significantly more effective than metformin. To prevent one case of diabetes during a period of three years, 6.9 persons would have to participate in the lifestyle-intervention program, and 13.9 would have to receive metformin. CONCLUSIONS: Lifestyle changes and treatment with metformin both reduced the incidence of diabetes in persons at high risk. The lifestyle intervention was more effective than metformin. Ann Intern Med Apr 19;142(8):611-9. The effect of metformin and intensive lifestyle intervention on the metabolic syndrome: the Diabetes Prevention Program randomized trial. Orchard TJ, Temprosa M, Goldberg R, Haffner S, Ratner R, Marcovina S, Fowler S; Diabetes Prevention Program Research Group. Diabetes Prevention Program Coordinating Center, The Biostatistics Center, George Washington University, Rockville, Maryland 20852, USA. The metabolic syndrome is a high-risk state for diabetes and cardiovascular disease. Little is known about its prevalence and prevention in those with impaired glucose tolerance. OBJECTIVE: To determine the prevalence of the metabolic syndrome at baseline in the Diabetes Prevention Program and the effect of intensive lifestyle intervention and metformin therapy on the syndrome's incidence and resolution. DESIGN: Randomized, controlled clinical trial. SETTING: Research and community-based centers. PARTICIPANTS: Participants had impaired glucose tolerance (World Health Organization criteria plus fasting plasma glucose level >or=5.3 mmol/L [>or=95 mg/dL]) and were followed for a mean of 3.2 years after random assignment to intensive lifestyle intervention, metformin therapy, or placebo. INTERVENTIONS: Metformin, 850 mg twice daily, or intensive lifestyle intervention designed to achieve and maintain a 7% weight loss and 150 minutes of exercise per week. MEASUREMENTS: The metabolic syndrome was defined as having 3 or more characteristics (waist circumference; blood pressure; and levels of high-density lipoprotein cholesterol, triglycerides, and fasting plasma glucose) that met criteria from the National Cholesterol Education Program Adult Treatment Panel III. Fifty-three percent of participants (n = 1711) had the metabolic syndrome at baseline; incidence did not vary substantially by age. However, low levels of high-density lipoprotein cholesterol predominated in younger participants (age 25 to 44 years), and high blood pressure predominated in older participants (age 60 to 82 years). In life-table analyses (log-rank test), incidence of the metabolic syndrome was reduced by 41% in the lifestyle group (P < 0.001) and by 17% in the metformin group (P = 0.03) compared with placebo. Three-year cumulative incidences were 51%, 45%, and 34% in the placebo, metformin, and lifestyle groups, respectively. There was no significant heterogeneity by ethnic group. LIMITATIONS: The study involved a volunteer group with impaired glucose tolerance, which limits generalizability. The metabolic syndrome affected approximately half of the participants in the Diabetes Prevention Program at baseline. Both lifestyle intervention and metformin therapy reduced the development of the syndrome in the remaining participants.
. Diabetes Prevention Program trial showed 58% reduction in incidence of T2DM with lifestyle modifications. 5-10% reduction in body weight improves insulin sensitivity, lipid profiles, endothelial function, reduces thrombosis and inflammatory markers. There is a 3-fold increase in the odds that a patient will attempt weight loss if it is recommended by a trusted health care professional. N Engl J Med Feb 7;346(6): Reduction in the incidence of type 2 diabetes with lifestyle intervention or metformin. Knowler WC, Barrett-Connor E, Fowler SE, Hamman RF, Lachin JM, Walker EA, Nathan DM; Diabetes Prevention Program Research Group. Source. Diabetes Prevention Program Coordinating Center, Biostatistics Center, George Washington University, 6110 Executive Blvd., Suite 750, Rockville, MD 20852, USA. Abstract. BACKGROUND: Type 2 diabetes affects approximately 8 percent of adults in the United States. Some risk factors--elevated plasma glucose concentrations in the fasting state and after an oral glucose load, overweight, and a sedentary lifestyle--are potentially reversible. We hypothesized that modifying these factors with a lifestyle-intervention program or the administration of metformin would prevent or delay the development of diabetes. METHODS: We randomly assigned 3234 nondiabetic persons with elevated fasting and post-load plasma glucose concentrations to placebo, metformin (850 mg twice daily), or a lifestyle-modification program with the goals of at least a 7 percent weight loss and at least 150 minutes of physical activity per week. The mean age of the participants was 51 years, and the mean body-mass index (the weight in kilograms divided by the square of the height in meters) was 34.0; 68 percent were women, and 45 percent were members of minority groups. RESULTS: The average follow-up was 2.8 years. The incidence of diabetes was 11.0, 7.8, and 4.8 cases per 100 person-years in the placebo, metformin, and lifestyle groups, respectively. The lifestyle intervention reduced the incidence by 58 percent (95 percent confidence interval, 48 to 66 percent) and metformin by 31 percent (95 percent confidence interval, 17 to 43 percent), as compared with placebo; the lifestyle intervention was significantly more effective than metformin. To prevent one case of diabetes during a period of three years, 6.9 persons would have to participate in the lifestyle-intervention program, and 13.9 would have to receive metformin. CONCLUSIONS: Lifestyle changes and treatment with metformin both reduced the incidence of diabetes in persons at high risk. The lifestyle intervention was more effective than metformin. Ann Intern Med Apr 19;142(8): The effect of metformin and intensive lifestyle intervention on the metabolic syndrome: the Diabetes Prevention Program randomized trial. Orchard TJ, Temprosa M, Goldberg R, Haffner S, Ratner R, Marcovina S, Fowler S; Diabetes Prevention Program Research Group. Diabetes Prevention Program Coordinating Center, The Biostatistics Center, George Washington University, Rockville, Maryland 20852, USA. The metabolic syndrome is a high-risk state for diabetes and cardiovascular disease. Little is known about its prevalence and prevention in those with impaired glucose tolerance. OBJECTIVE: To determine the prevalence of the metabolic syndrome at baseline in the Diabetes Prevention Program and the effect of intensive lifestyle intervention and metformin therapy on the syndrome s incidence and resolution. DESIGN: Randomized, controlled clinical trial. SETTING: Research and community-based centers. PARTICIPANTS: Participants had impaired glucose tolerance (World Health Organization criteria plus fasting plasma glucose level >or=5.3 mmol/L [>or=95 mg/dL]) and were followed for a mean of 3.2 years after random assignment to intensive lifestyle intervention, metformin therapy, or placebo. INTERVENTIONS: Metformin, 850 mg twice daily, or intensive lifestyle intervention designed to achieve and maintain a 7% weight loss and 150 minutes of exercise per week. MEASUREMENTS: The metabolic syndrome was defined as having 3 or more characteristics (waist circumference; blood pressure; and levels of high-density lipoprotein cholesterol, triglycerides, and fasting plasma glucose) that met criteria from the National Cholesterol Education Program Adult Treatment Panel III. Fifty-three percent of participants (n = 1711) had the metabolic syndrome at baseline; incidence did not vary substantially by age. However, low levels of high-density lipoprotein cholesterol predominated in younger participants (age 25 to 44 years), and high blood pressure predominated in older participants (age 60 to 82 years). In life-table analyses (log-rank test), incidence of the metabolic syndrome was reduced by 41% in the lifestyle group (P < 0.001) and by 17% in the metformin group (P = 0.03) compared with placebo. Three-year cumulative incidences were 51%, 45%, and 34% in the placebo, metformin, and lifestyle groups, respectively. There was no significant heterogeneity by ethnic group. LIMITATIONS: The study involved a volunteer group with impaired glucose tolerance, which limits generalizability. The metabolic syndrome affected approximately half of the participants in the Diabetes Prevention Program at baseline. Both lifestyle intervention and metformin therapy reduced the development of the syndrome in the remaining participants.")
60
Andrea M Girman, MD, MPH PAFP 9 March 2012
The Continuum of PreD: Guiding Diagnosis & Treatment of Progression to Diabetes Andrea M Girman, MD, MPH PAFP 9 March 2012

Similar presentations


 Community Health Assessment Training July 16, 2008.>")


