Download presentation
Presentation is loading. Please wait.

1
NYS by the Numbers - The 2016 Statistical Picture

2
Goals of the Presentation Presenting a statistical picture of the NYS Adult Education System A look at trends over the past few years Comparison with Federal statistics Presenting new initiatives from ASISTS

3
The adult education system in 2015 Number of programs statewide: 147 serving 102,784 students 58% in ESL 38% students in ABE 4% in ASE Program Performance: 61% Educational gain 82% Posttest rate 82% Follow-up outcomes

4
Enrollment for each funding

5
Quick look at hours

6
Program Performance 67% of programs ‘Proficient’ Achieved all NYS benchmarks 25% of programs ‘Highly Proficient’ Achieved all NYS benchmarks and in the highest quartile of performance 5% (7 programs)‘Unacceptable’ and in Corrective Action Missed one or more NYS benchmarks and in the lowest quartile of performance 3% ‘Needs Improvement’ Missed one or more NYS benchmarks but were NOT in the lowest quartile
‘Unacceptable’ and in Corrective Action Missed one or more NYS benchmarks and in the lowest quartile of performance 3% ‘Needs Improvement’ Missed one or more NYS benchmarks but were NOT in the lowest quartile")
7
How does NYS compare with the Nation? NYS is the 3rd largest of all states in enrollment California and Florida are the two biggest states The top 6 states have more than half (53%) of national enrollment New York has 7% of the nation’s enrollment 6% of ABE 3% of ASE 9% of ESL After California, Florida, North Carolina for ABE and ASE
 of national enrollment New York has 7% of the nation’s enrollment 6% of ABE 3% of ASE 9% of ESL After California, Florida, North Carolina for ABE and ASE.")
8
NYS in comparison to other states

9
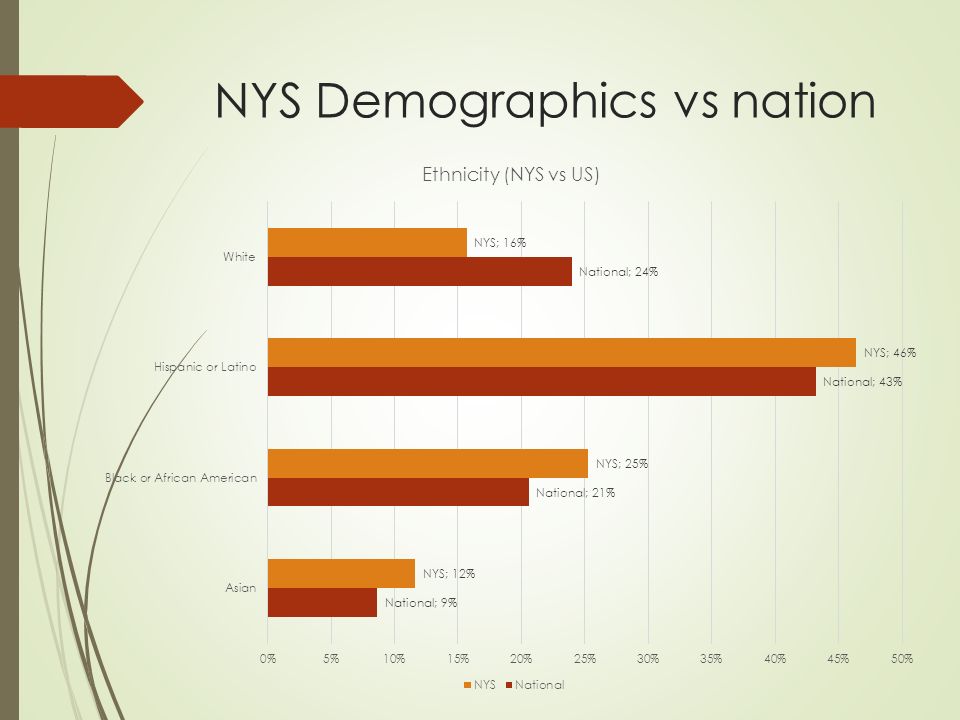
NYS Demographics vs nation

11
NYS Demographics vs Nation

12
Enrollment over the years Enrollment in NYS over the past seven years Dropped 23% overall (vs 34% for the whole nation)
")
13
Enrollment by region

14
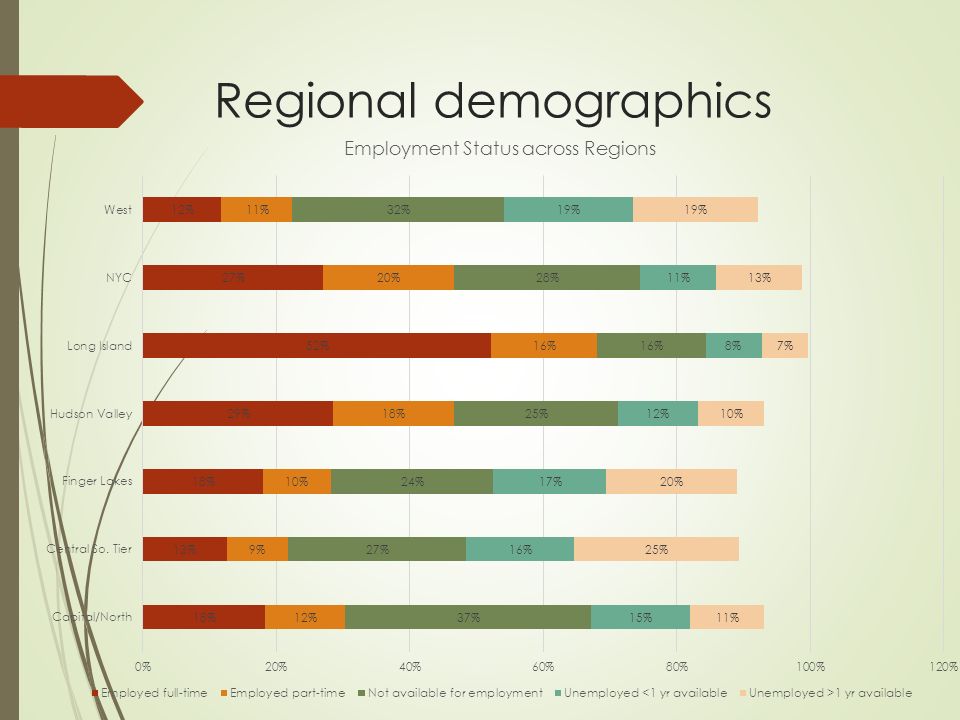
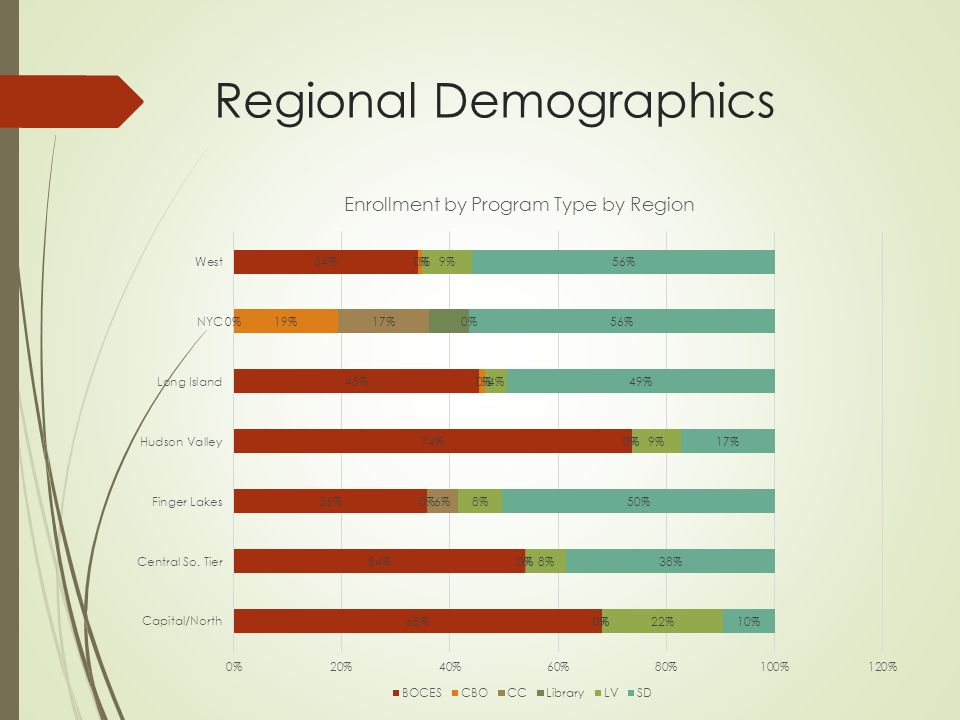
Regional Demographics

15
Regional demographics

17
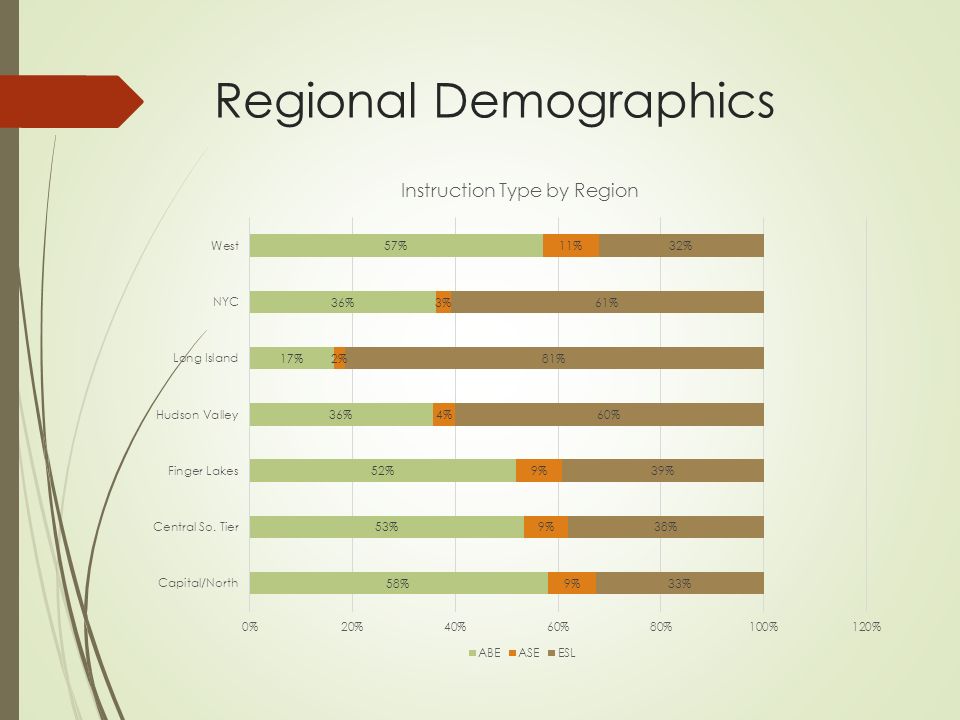
Regional Demographics

20
New Initiatives in ASISTS Currently in pilots: Weekly attendance screen Teacher Support System (TSS) Scanning To come WIOA changes Design changes in ASISTS Program Manager interface
 Scanning To come WIOA changes Design changes in ASISTS Program Manager interface")
Similar presentations


 began as: ◦ For students meeting the criteria for NRS inclusion who were pre and post-tested, what appears,>")


