Download presentation
Presentation is loading. Please wait.

1
Robert L. Linn CRESST, University of Colorado at Boulder Paper presented at a symposium sponsored by the National Association of Test Directors entitled “NCLB: Changing It: Fixing It: Living With It”, at the Annual Meeting of the National Council on Measurement in Education, Chicago, IL, April 13, 2007 Needed Modifications of NCLB

2
Praiseworthy Aspects of NCLB Support for schools serving poor children Emphasis on achievement of all children Special attention to students who have lagged behind in the past Emphasis on closing gaps in achievement among subpopulations of students Focus on qualified teachers

3
Reauthorization Funding Flexibility for states Teacher quality My focus: Fixing accountability system

4
Four Fundamental Problems with NCLB Accountability System Unrealistic expectations Multiple meanings of proficient Reliance on current status targets Multiple-hurdle approach

5
Unrealistic Expectations 2013-2014 Target: All students performing at the “proficient” level or above in mathematics and reading or English language arts Although proficient achievement is poorly defined the intent of NCLB is that it correspond to a high level of achievement

6
NAEP as a Common Benchmark 100% proficiency goal is in terms of state assessments and state standards But, NAEP provides a benchmark – the only common benchmark across states There have been improvements in the percentage of student who are proficient or above in mathematics since 1990 particularly at grade 4 but also at grade 8

7
Increases in percent proficient or above on NAEP Mathematics Grade 4: from 13% in 1990 to 36% in 2005 – average increase of 1.53% per year Grade 8: from 15% in 1990 to 30% in 2005 – average increase of 1.00% per year Substantial gains, but continuation of trends to 1014 would lead to only 50% of fourth graders and 39% of the eighth graders reaching the proficient level or above in 2014 - far short of 100% goal

8
Reading NAEP results in reading more discouraging than in mathematics Trends in reading percentage proficient or above have been essentially flat since achievement levels were set in 1992 Grade 4: 29% in 1992 – 31% in 2005 Grade 8: 29% in 1992 – 31% in 2005

9
Proficiency For All: An Oxymoron Rothstein, Jacobsen, & Wilder (2006) “A standard can either be a minimal standard which presents no challenge to typical or advanced students, or it can be a challenging standard which is unachievable by most below-average students” (p. 3)
.")
10
Link of TIMSS to NAEP No country had even three-quarters of their student scoring above the proficient level on TIMSS mathematics at grade 8 in 1999 according the linkage of TIMSS to NAEP reported by Phillips (2007) Although Singapore came close with 96%, no country had all their students at or above the basic level on TIMSS mathematics at grade 8 in 1999 (Phillips, 2007)
 Although Singapore came close with 96%, no country had all their students at or above the basic level on TIMSS mathematics at grade 8 in 1999 (Phillips, 2007)")
11
Alternatives to the 100% Proficiency Goal “Existence Proof” Use gains made by the fastest gaining, say 20%, of the schools in the past to set improvement targets for all schools Consider using of gains measured in terms of effect size as alternative to gains in percent above a cutscore

12
Performance Standards Called Academic Achievement Standards by NCLB Absolute rather than normative Establish fixed criterion of performance Intended to be challenging Relatively small number of levels Apply to all, or essentially all students Depend on judgment

15
States with the Highest and Lowest Percent Proficient or Above on State Assessments in 2005 Highest Reading: Grade 4 Mississippi: 89% Reading: Grade 8 North Carolina: 88% Math: Grade 4 North Carolina, 92% Math: Grade 8 Tennessee: 87% Lowest Reading: Grade 4 Missouri: 35% Reading: Grade 8 South Carolina: 30% Math: Grade 4 Maine & Wyo.: 39% Math: Grade 8 Missouri: 16%

16
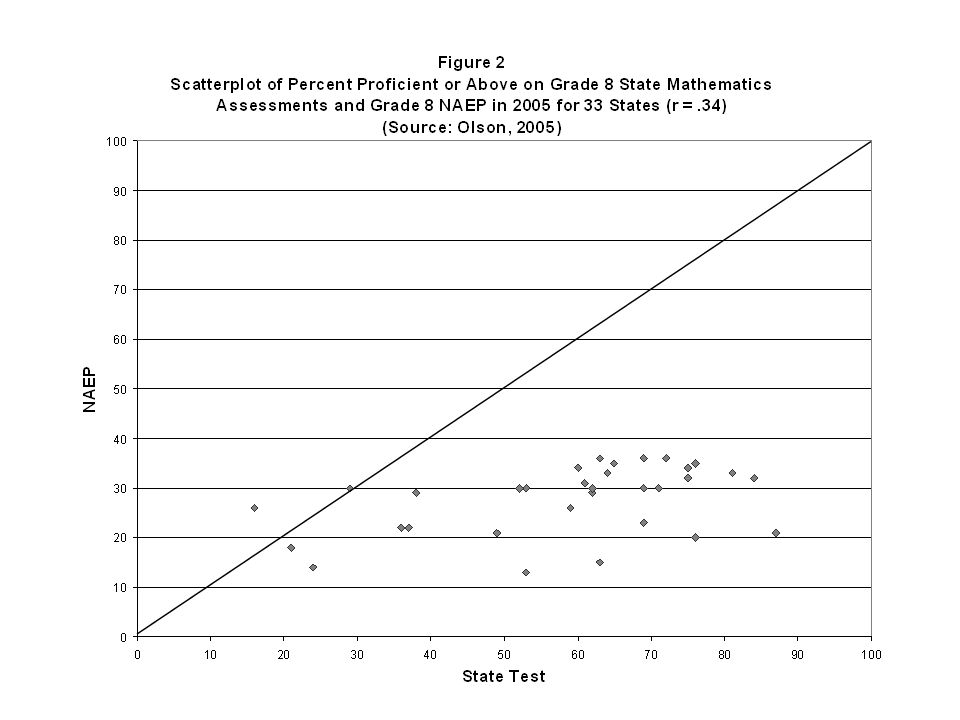
Contrasts of Percent Proficient or above on NAEP and State Assessments (Grade 8 Mathematics) NAEP Missouri 21% Tennessee 26% State Assessments Missouri 16% Tennessee 87%
 NAEP Missouri 21% Tennessee 26% State Assessments Missouri 16% Tennessee 87%")
17
State Variability in Definitions of Proficient Achievement Variability much greater than differences in achievement as measured by NAEP Variability so great that the “proficient” lacks any semblance of common meaning across states

18
Alternatives to Academic Achievement Standards Median achievement in a base year (e.g., 2002) Use effect size statistics: Difference in mean for current year and mean for base year divided by base year standard deviation With either approach set targets based on top 20% of schools in terms of gains in achievement over past 4 or 5 years
 Use effect size statistics: Difference in mean for current year and mean for base year divided by base year standard deviation With either approach set targets based on top 20% of schools in terms of gains in achievement over past 4 or 5 years")
19
Approaches to Test-Based Accountability Status Approach: compare assessment results for a given year to fixed targets (the NCLB approach) Growth Approach: evaluate growth in achievement (allowed for NCLB pilot program states) “Growth” may be measured by comparing performance of successive cohorts of students Growth may be evaluated by longitudinal tracking of students from year to year
 Growth Approach: evaluate growth in achievement (allowed for NCLB pilot program states) Growth may be measured by comparing performance of successive cohorts of students Growth may be evaluated by longitudinal tracking of students from year to year")
20
Status and Growth Approaches Status approach has many drawbacks when used to identify schools as successes or in need of improvement Does not account for differences in student characteristics, most importantly differences in prior achievement Growth approach has advantage of accounting for differences in prior achievement, but may set different standards for schools that start in different places

21
NCLB Pilot Program Five states have received approval to use growth model approaches to determining AYP Early results suggest that it does not radically alter the proportion of schools failing to make AYP Constraints on growth models are severe, most notably the retention of the requirement that they lead to the completely unrealistic goal of 100% proficiency by 2014

22
Multiple-Hurdle Approach NCLB uses multiple-hurdle approach Schools must meet multiple targets each year – participation and achievement separately for reading and mathematics for the total student body and for subgroups of sufficient size Many ways to fail to make AYP (miss any target), but only one way to make AYP (meet or exceed every target) Large schools with diverse student bodies at a relative disadvantage in comparison to small schools or schools with relatively homogeneous student bodies
, but only one way to make AYP (meet or exceed every target) Large schools with diverse student bodies at a relative disadvantage in comparison to small schools or schools with relatively homogeneous student bodies")
23
Compensatory Approach State systems often use a compensatory approach rather than a multiple-hurdle approach An advantage of compensatory approach is that it creates fewer ways for a school to fall short of targets Hybrid models also possible that use a combination of compensatory and multiple-hurdle approaches

24
Suggestions for Improvement 1. Set goals that are ambitious, but realistically achievable with sufficient effort, e.g., use past experience for schools that lead the way in improvement to set goals for all schools 2. Replace vaguely defined “proficient” achievement by something with a common meaning across, e.g. use median achievement in a base year and gains made by schools showing highest rates of improvement to determine AYP

25
Suggestions for Improvement 3. Use a combination of measured improvement and status to determine AYP rather than only current performance in comparison to a target 4. Use a compensatory system rather than a multiple-hurdle, conjunctive system to determine whether or not schools make AYP

Similar presentations


 2012 Science Results Carolyn M. Wood, Ph.D. Assistant Superintendent, Accountability, Assessment, and Data Systems August.>")


>")


: A Comprehensive Measurement System for All Schools Student Achievement (e.g. PSSA) Student Progress.>")
