Download presentation
Presentation is loading. Please wait.

1
By: Aldo Buttazzoni

3
GDP Graph Questions and Answers 1. What country has the largest column? What are the reasons that you think that this country has the highest amount? A: The U.S.A has the largest column, I think this is because the U.S.A has a very developed economy. Also the U.S.A GDP rate shows that it is one of the highest GDP rates in the world. 2. What country has the smallest/lowest? What reasons would cause this country to have a low amount? A: Cuba has lowest GDP. I think this is because Cuba is a developing country and they do not have a great economy. 3. Look at the 5 th and 6 th ranked countries. Are they developed, developing, or one of each? Why do you think that they are where they are in the rankings? Use data to help you answer the question. A: They are both developing countries, I Think this is because they don’t have very good economies and it is hard for developing countries to have good economy's. 4. Look at the 7 th and 8 th ranked countries. Are they developing countries? If so, what do they need to do in order to get to the top half of the rankings? Use data from any information to help you answer the question. A:They are both developing. I think their economies are not very good so if they want to get to the top half they need to use some of the things they are good at and use that to help them to get to the top half. 5. Name another country (other than the US) that stands out to you on the chart. Describe the country and what type of impact it has on world consumption. A: Italy stands out to me on the chart. The country has a fairly high GDP rate, this tells me that it has a good econemy.
 that stands out to you on the chart. Describe the country and what type of impact it has on world consumption. A: Italy stands out to me on the chart. The country has a fairly high GDP rate, this tells me that it has a good econemy..")
5
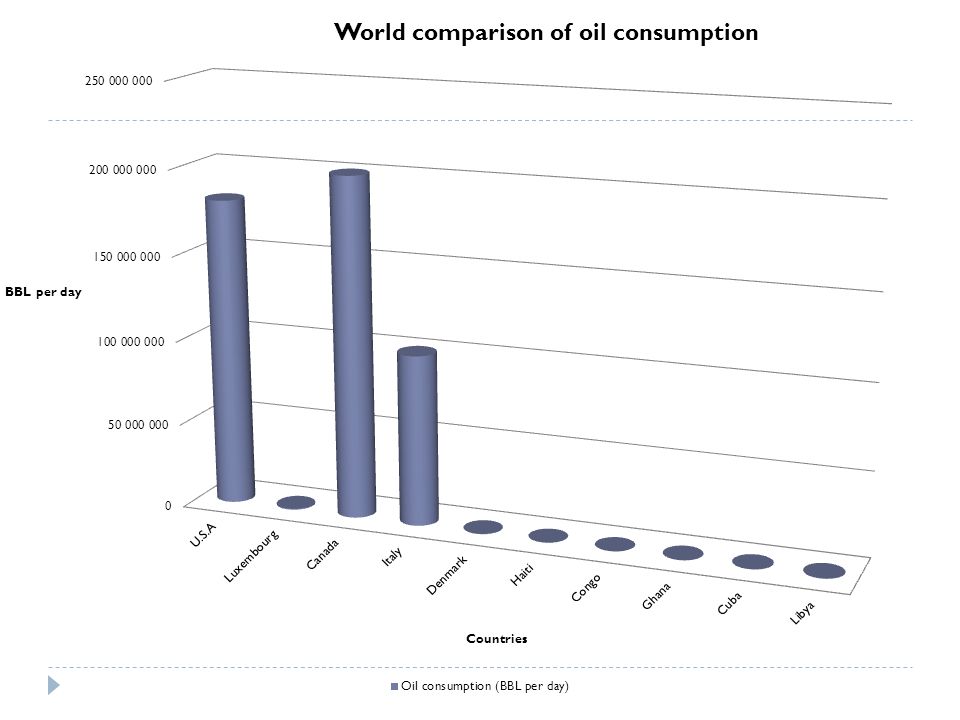
Oil Consumption Graph Questions and Answers 1. What country has the largest column? What are the reasons that you think that this country has the highest amount? A: Canada has the largest column, this probably is the way it is because Canada uses more oil than the other countries. 2. What country has the smallest/lowest? What reasons would cause this country to have a low amount? A: Haiti has the lowest. The reasons I think this is, is because Haiti doesn't need the oil or they cant afford it. 3. Look at the 5 th and 6 th ranked countries. Are they developed, developing, or one of each? Why do you think that they are where they are in the rankings? Use data to help you answer the question. A: One of the countries is developing and the other one is developed. One of the countries produces and uses a lot of oil but the other doesn't. 4. Look at the 7 th and 8 th ranked countries. Are they developing countries? If so, what do they need to do in order to get to the top half of the rankings? Use data from any information to help you answer the question. A: They are both developing countries. They don’t use as much oil as other countries. To get to the top half they might need to invest in oil and oil related companies, manufacturers, etc. 5. Name another country (other than the US) that stands out to you on the chart. Describe the country and what type of impact it has on world consumption. A: Italy stands out to me because I wouldn’t expect it to consume that much oil but it does because of tourists cars and other things there.
 that stands out to you on the chart. Describe the country and what type of impact it has on world consumption. A: Italy stands out to me because I wouldn’t expect it to consume that much oil but it does because of tourists cars and other things there..")
7
World Population Graph Questions and Answers 1. What country has the largest column? What are the reasons that you think that this country has the highest amount? A: U.S.A has the largest column. I think this is because the U.S.A is a developing country and they have been growing for a long time. 2. What country has the smallest/lowest? What reasons would cause this country to have a low amount? A: Luxembourg has the smallest column, I think this is because Luxembourg is a VERY small country. 3. Look at the 5 th and 6 th ranked countries. Are they developed, developing, or one of each? Why do you think that they are where they are in the rankings? Use data to help you answer the question. A: One is developing and the other is developed I think this is because the people in the developing country may not be able to afford more kids but the developed country. 4. Look at the 7 th and 8 th ranked countries. Are they developing countries? If so, what do they need to do in order to get to the top half of the rankings? Use data from any information to help you answer the question. A: They are both developing countries. They don’t have the money to have more people in their country. To get to the top half they might need to invest their money in things that encourage or help bring their population up. 5. Name another country (other than the US) that stands out to you on the chart. Describe the country and what type of impact it has on world consumption. A: Congo stood out to me because I wouldn’t expect a developing country to have such a high population.
 that stands out to you on the chart. Describe the country and what type of impact it has on world consumption. A: Congo stood out to me because I wouldn’t expect a developing country to have such a high population..")
Similar presentations


What country has the largest column? What are the reasons that you think that this country has the highest amount? 2)China has the largest column because.>")


. What country has the largest column? What are the reasons that you think that this country.>")


