Download presentation
Presentation is loading. Please wait.

1
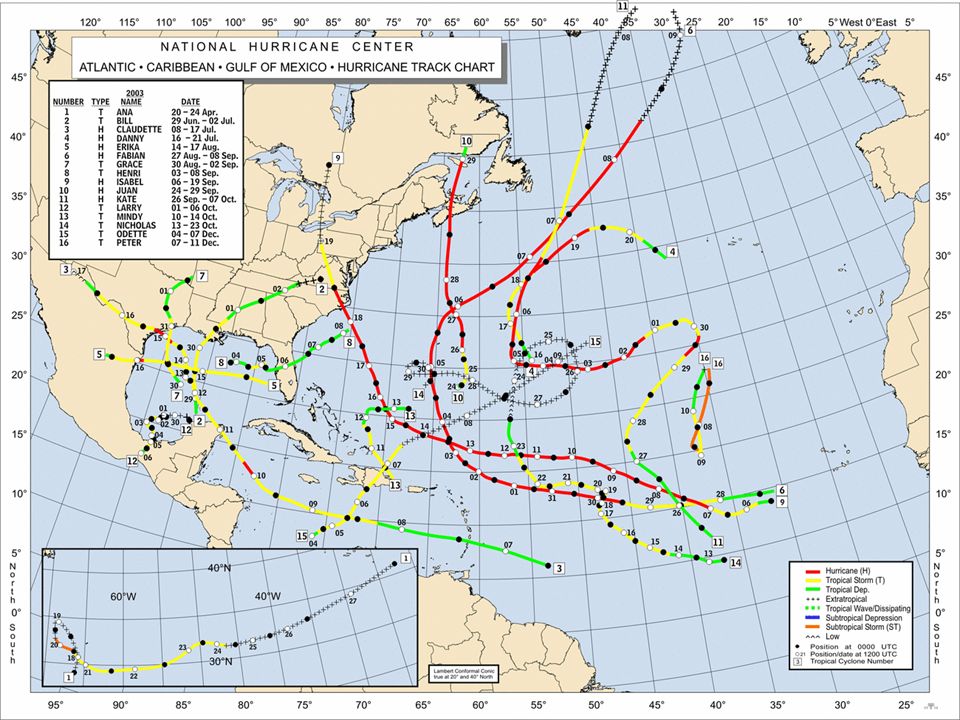
The 2004 Atlantic Hurricane Season and Beyond Chris Landsea NOAA/Hurricane Research Division Miami, Florida, USA January and February 2004 Southern Region Marine Workshop

2
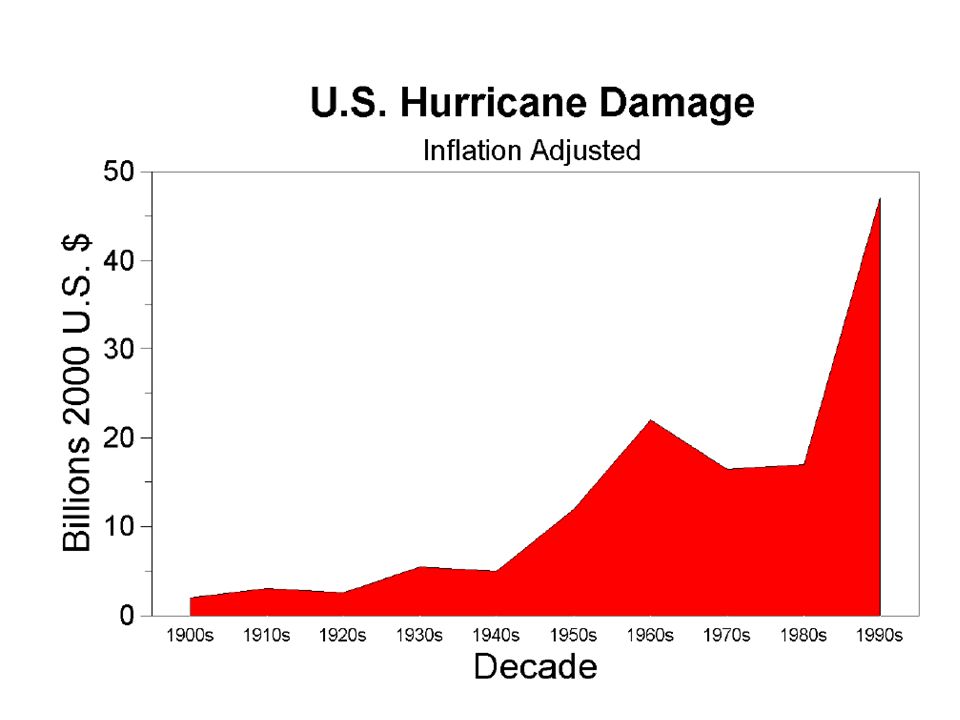
Why have hurricane damages gone way up? How have hurricanes changed in the past? What environmental factors control hurricanes? What will the next couple decades bring? How is seasonal hurricane forecasting done? How well did the forecasts do in 2003? What is expected at this point for 2004? Outline

3
NOAA Dork Logo

6
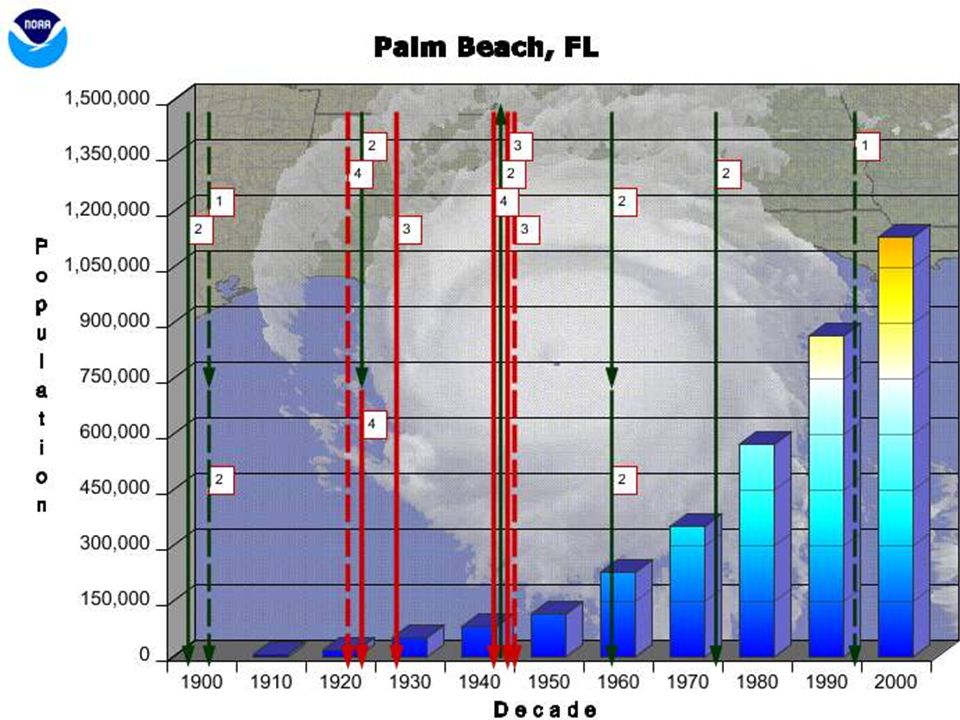
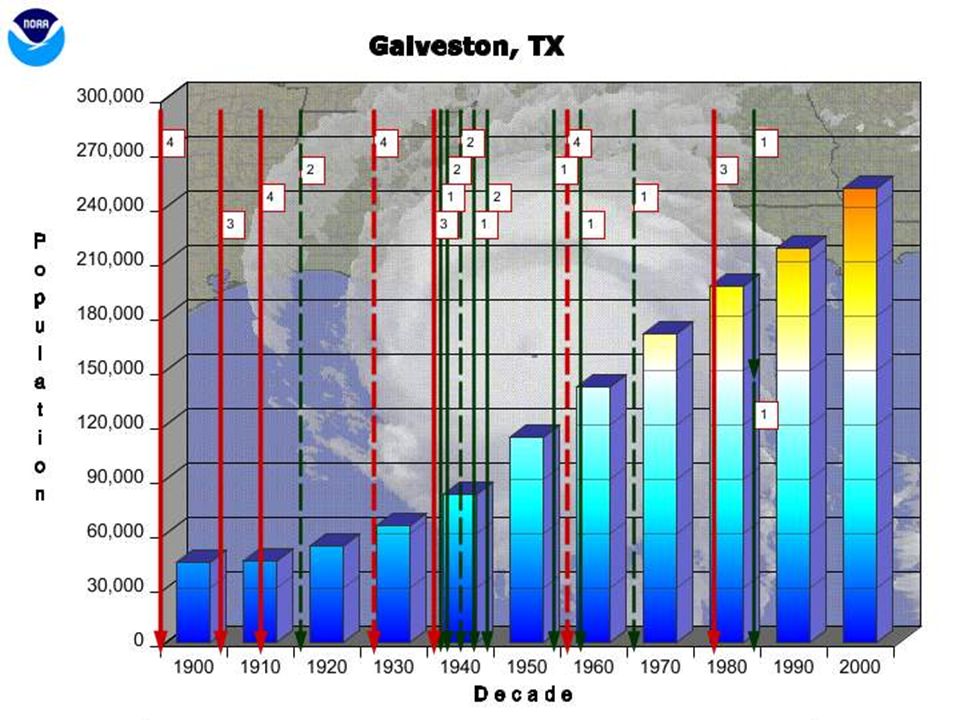
Florida Coastal Population

7
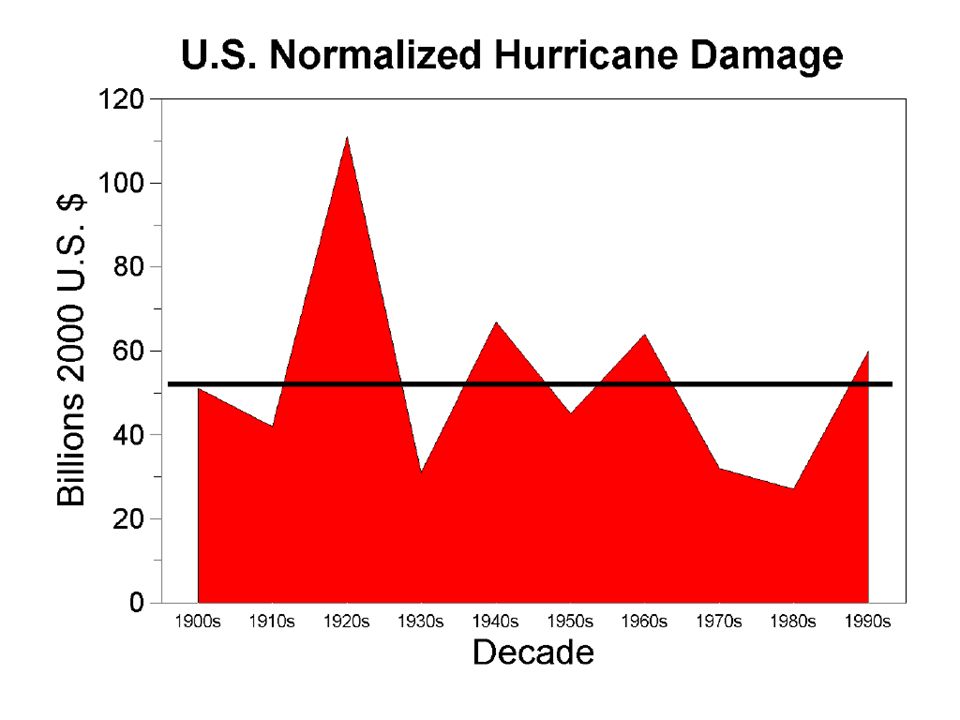
NORMALIZED DAMAGE is estimated economic damages if past storms made landfall with present-day societal conditions. ND = f(inflation, population, wealth) Source: Pielke, Jr., R. A., and C. W. Landsea, 1998: Normalized Hurricane Damages in the United States: 1925-1995. Weather and Forecasting, 13:351-361.
 Source: Pielke, Jr., R. A., and C. W. Landsea, 1998: Normalized Hurricane Damages in the United States: Weather and Forecasting, 13:")
13
Atlantic Multidecadal Mode Local Correlation of SST versus REOF Mestas-Nunez and Enfield (1999)
")
15
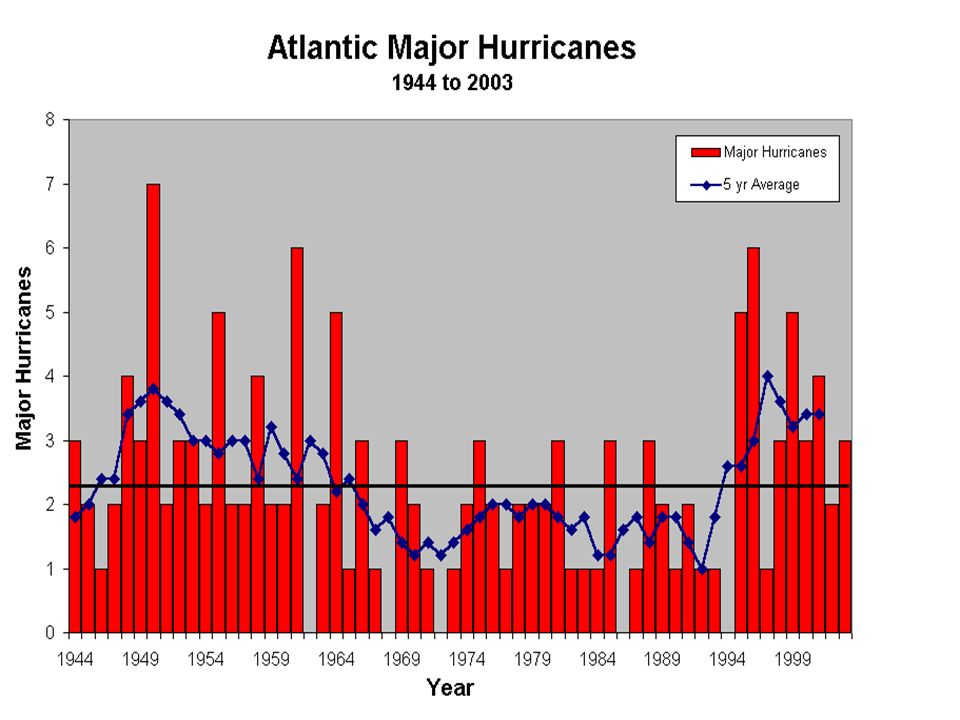
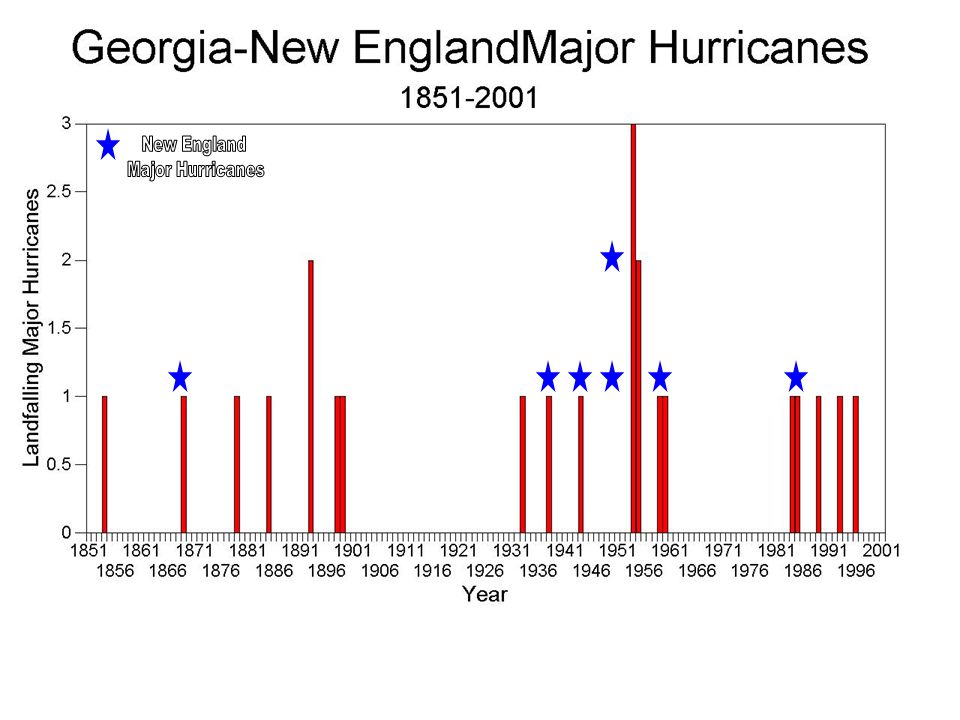
U.S. MAJOR LANDFALLING HURRICANES: 1903-2000 Major East Coast Hurricanes Active Decades Inactive Decades

18
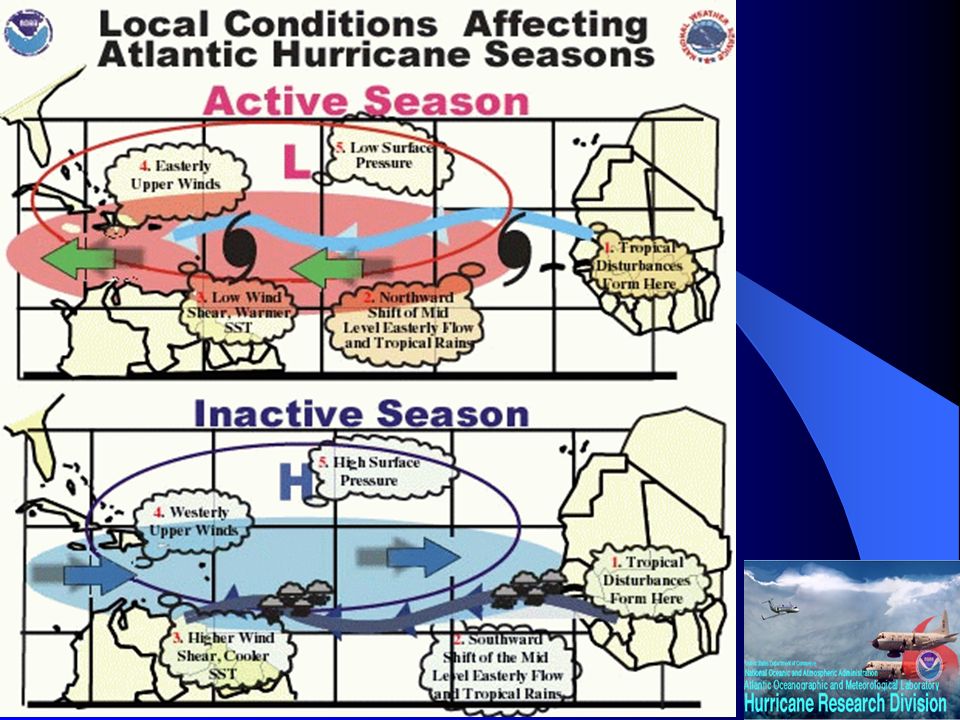
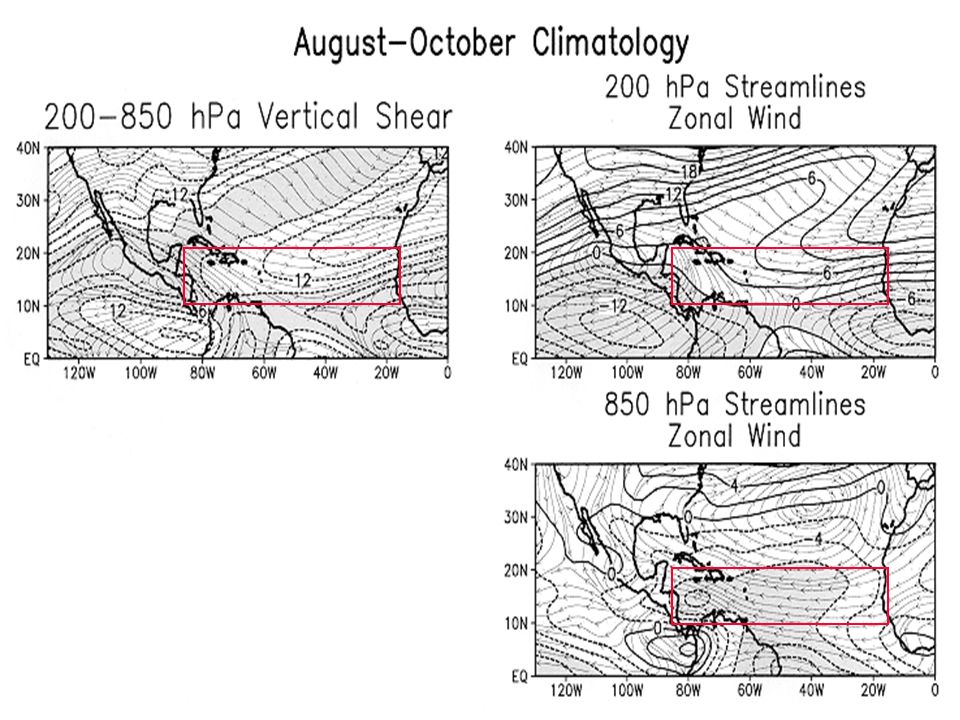
Coverage of Low Tropospheric Vertical Wind Shear

20
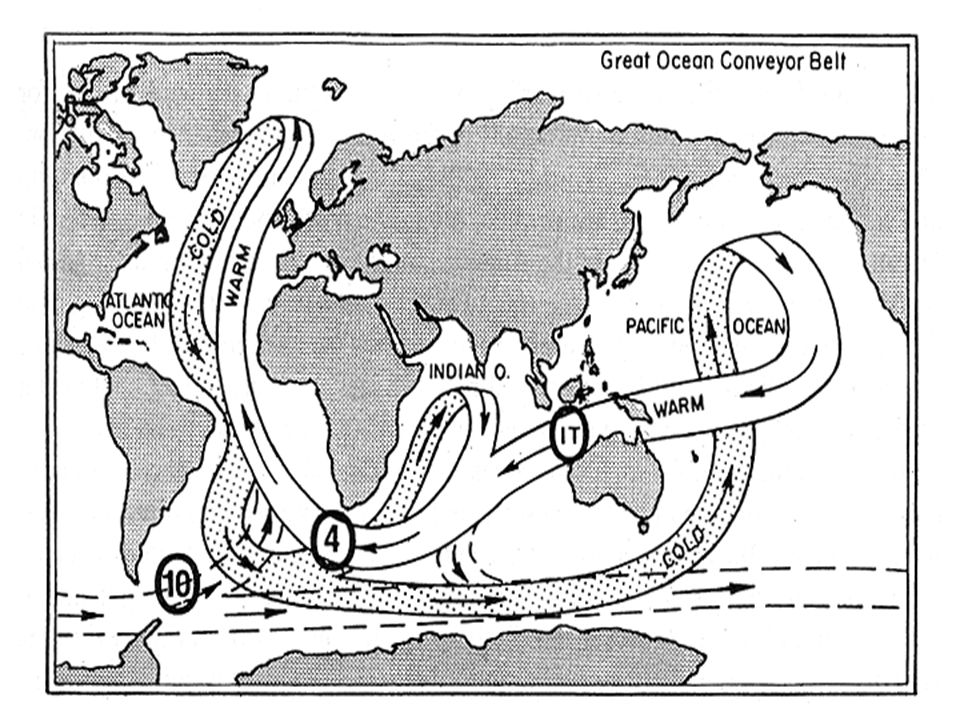
Strong ConveyorWeak Conveyor

22
Global Warming versus Society Changes: Hurricane Damages

23
Dr. Bill Gray Colorado State University

24
Sea Surface Temperatures

26
La Nina versus El Nino Hurricane Probabilities La Nina Hurricane RiskEl Nino Hurricane Risk

27
The “Global Mode”: Enhanced 200mb Subtropical Ridges

28
“Global Mode”: Winter ’98-’99 To ’99 Hurricane Season

29
“Global Mode”: Winter ’96-’97 To ’97 Hurricane Season

30
NOAA Forecast Methodology 1) Assess state of Global Mode currently; 2) Determine probabilities of active/near-average/quiet, given persistence of conditions through season; 3) Adjust probabilities depending upon anticipated Atlantic Multidecadal Mode and El Nino-Southern Oscillation phases For example: Early August 2001 indicated a “near-average” global mode; This would typically suggest: 25% active/50% near-average/25% quiet; After stratifying for WARM Atlantic Mode and neutral ENSO: 40% active/40% near-average/20% quiet.
 Assess state of Global Mode currently; 2) Determine probabilities of active/near-average/quiet, given persistence of conditions through season; 3) Adjust probabilities depending upon anticipated Atlantic Multidecadal Mode and El Nino-Southern Oscillation phases For example: Early August 2001 indicated a near-average global mode; This would typically suggest: 25% active/50% near-average/25% quiet; After stratifying for WARM Atlantic Mode and neutral ENSO: 40% active/40% near-average/20% quiet.")
31
NOAA: 2003 Atlantic Hurricane Outlook 7 August, 2003: There is a 35% probability of a near-normal Atlantic hurricane season in 2003, a 60% probability of an above-normal season, and a 5% chance of a below-normal season… La Nina has not developed as expected. Nonetheless, the expected conditions combined with the active phase of the Atlantic multi-decadal signal are conducive to an above- normal Atlantic hurricane season … Historical data for similar climate conditions indicates a likely range of 12-15 tropical storms this season, 7-9 hurricanes, and 3-4 major hurricanes. 19 May, 2003: There is a 35% probability of a near-normal Atlantic hurricane season in 2003, a 55% probability of an above-normal season, and a 10% chance of a below-normal season… This outlook reflects the ongoing multi-decadal conditions, combined with a 70% chance of La Niña, both of which are conducive to increased activity during the normal peak (August-October) of the hurricane season. … The 2003 outlook calls for 11- 15 tropical storms, with 6-9 becoming hurricanes, and 2-4 becoming major hurricanes.
 of the hurricane season. … The 2003 outlook calls for tropical storms, with 6-9 becoming hurricanes, and 2-4 becoming major hurricanes..")
33
Hurricane Isabel 18 September 2003

34
Active Decades ACE = 114 10 TS, 6.5 H, 3 MH Above Normal Season Near Normal Below Normal Season Historical Perspective: ACE Index Atlantic Basin Main Development Region Active Decade ACE = 134 13 TS, 8 H, 3.6 MH IN-active Decades ACE = 65 9 TS, 5 H, 1.5 MH 2003 Predicted Range

35
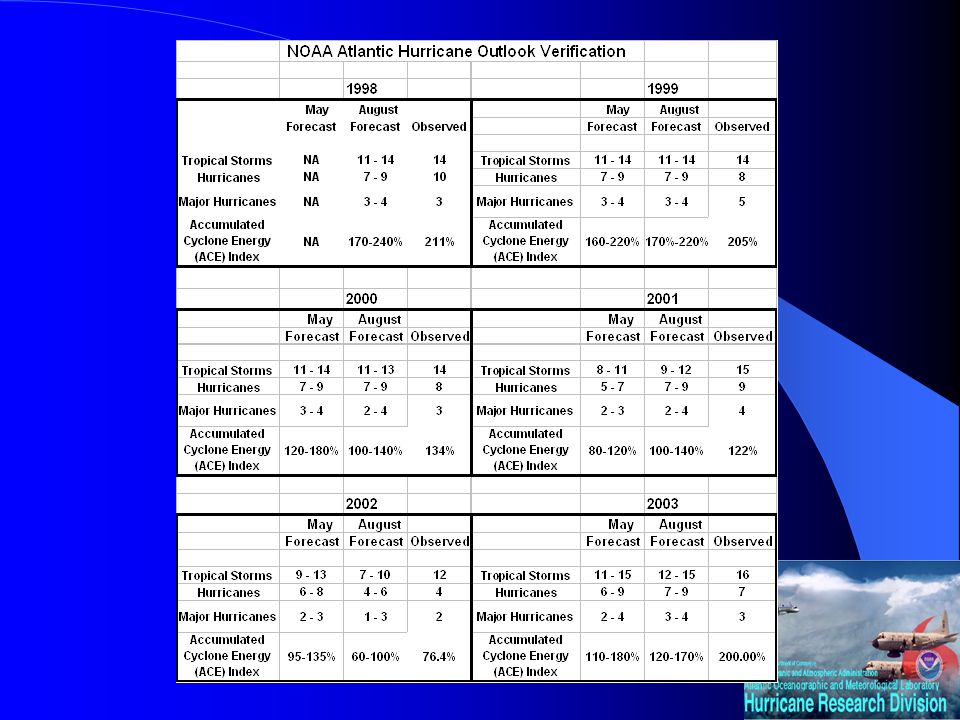
Tropical Storms ACE Index Hurricanes Major Hurricanes 14 12 15 12 88 9 4 3 5 4 2 Forecast Range Observed Green bars show climatological mean and ACE range for near-normal season (76%-120% of Median) NOAA Seasonal Atlantic Hurricane Outlook May Forecast vs. Observed: 1999-2003 16 7 3 135 206 122 200 76

36
NOAA Seasonal Atlantic Hurricane Outlook August Forecast vs. Observed: 1998-2003 Forecast Range Observed Green bars show climatological mean and ACE range for near-normal season (76%-120% of Median) Tropical Storms ACE Index Hurricanes Major Hurricanes 14 12 15 12 14 135 206 76 122 240 8 8 9 4 10 3 5 4 2 3 16 7 3 200
 Tropical Storms ACE Index Hurricanes Major Hurricanes")
37
The “Global Mode” – January 2004

38
Global Ocean Temperature Anomalies

39
El Nino Forecasts For 2004 El Nino La Nina

42
Why have hurricane damages gone way up? How have hurricanes changed in the past? What environmental factors control hurricanes? What will the next couple decades bring? How is seasonal hurricane forecasting done? How well did the forecasts do in 2003? What is expected at this point for 2004? Outline

Similar presentations


 suggest greater.>")


 Pacific Decadal Oscillation Annular modes.>")

 Winter Weather Forecast Conference OMSI / Oregon Chapter of the AMS 29 October 2011 Winter Weather Forecast Conference OMSI.>")

 Physical Oceanography>")

 –Tropical Pacific: El Nino/Southern Oscillation –Southern Ocean.>")
